| Param | Original file | Final file |
|---|---|---|
| Filename | modeM0/AS1A13_029T01_9000005940_44070cztM0_level2.fits | modeM0/AS1A13_029T01_9000005940_44070cztM0_level2_quad_clean.evt |
| Size (bytes) | 434,655,360 | 113,532,480 |
| Size | 414.5 MB | 108.3 MB |
| Events in quadrant A | 4,399,642 | 763,518 |
| Events in quadrant B | 3,107,149 | 802,647 |
| Events in quadrant C | 3,290,467 | 740,713 |
| Events in quadrant D | 4,767,234 | 660,501 |
| Mode SS | |||
|---|---|---|---|
| Quadrant | BADHDUFLAG | Total packets | Discarded packets |
| A | 0 | 136 | 0 |
| B | 0 | 136 | 0 |
| C | 0 | 136 | 0 |
| D | 0 | 136 | 0 |
| Mode M0 | |||
|---|---|---|---|
| Quadrant | BADHDUFLAG | Total packets | Discarded packets |
| A | 0 | 17700 | 2 |
| B | 0 | 13896 | 2 |
| C | 0 | 14497 | 2 |
| D | 0 | 18763 | 2 |
| Mode M9 | |||
|---|---|---|---|
| Quadrant | BADHDUFLAG | Total packets | Discarded packets |
| A | 0 | 16 | 0 |
| B | 0 | 17 | 0 |
| C | 0 | 17 | 0 |
| D | 0 | 17 | 0 |
| Quadrant | Total seconds | Saturated seconds | Saturation percentage |
|---|---|---|---|
| A | 6753 | 121 | 1.791796% |
| B | 6753 | 76 | 1.125426% |
| C | 6753 | 98 | 1.451207% |
| D | 6753 | 387 | 5.730786% |
Noise dominated data is calculated using 1-second bins in cleaned event files. If a bin has >2000 counts, and if more than 50% of those come from <1% of pixels, then it is considered to be noise-dominated and hence unusable.
| Quadrant | # 1 sec bins | Bins with >0 counts | Bins with >2000 counts | High rate bins dominated by noise | Noise dominated (total time) | Noise dominated (detector-on time) | Marked lightcurve |
|---|---|---|---|---|---|---|---|
| A | 7718 | 6754 | 3 | 3 | 0.04% | 0.04% | 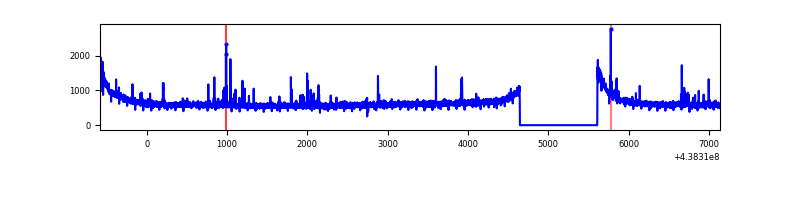 |
| B | 7718 | 6754 | 0 | 0 | 0.00% | 0.00% | 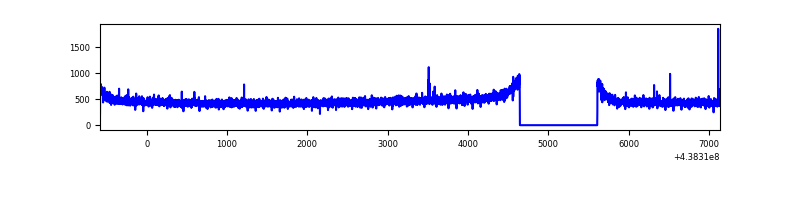 |
| C | 7718 | 6754 | 41 | 41 | 0.53% | 0.61% | 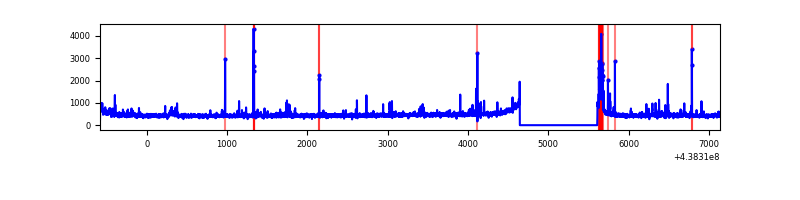 |
| D | 7718 | 6754 | 304 | 304 | 3.94% | 4.50% | 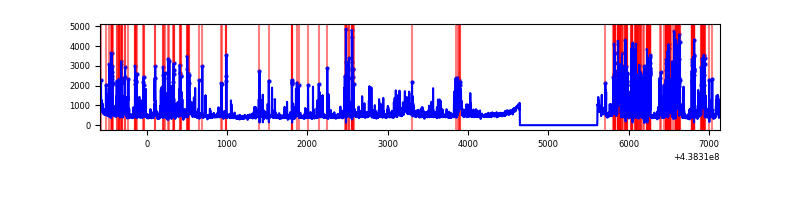 |
Top three noisy pixels from each quadrant. If the there are fewer than three noisy pixels in the level2.evt file, extra rows are filled as -1
| Pixel properties | Quadrant properties | ||||||
|---|---|---|---|---|---|---|---|
| Quadrant | DetID | PixID | Counts | Sigma | Mean | Median | Sigma |
| A | 10 | 83 | 1269999 | 7917.38 | 779 | 763 | 160.3 |
| A | 7 | 3 | 71642 | 442.14 | 779 | 763 | 160.3 |
| A | 10 | 248 | 13020 | 76.46 | 779 | 763 | 160.3 |
| B | 12 | 111 | 19999 | 124.21 | 785 | 759 | 154.9 |
| B | 11 | 111 | 18405 | 113.92 | 785 | 759 | 154.9 |
| B | 14 | 111 | 18276 | 113.08 | 785 | 759 | 154.9 |
| C | 14 | 96 | 151491 | 826.27 | 771 | 777 | 182.4 |
| C | 14 | 254 | 81609 | 443.15 | 771 | 777 | 182.4 |
| C | 11 | 16 | 28946 | 154.43 | 771 | 777 | 182.4 |
| D | 13 | 249 | 1308724 | 7032.41 | 750 | 729 | 186.0 |
| D | 5 | 222 | 152905 | 818.17 | 750 | 729 | 186.0 |
| D | 2 | 249 | 117892 | 629.92 | 750 | 729 | 186.0 |
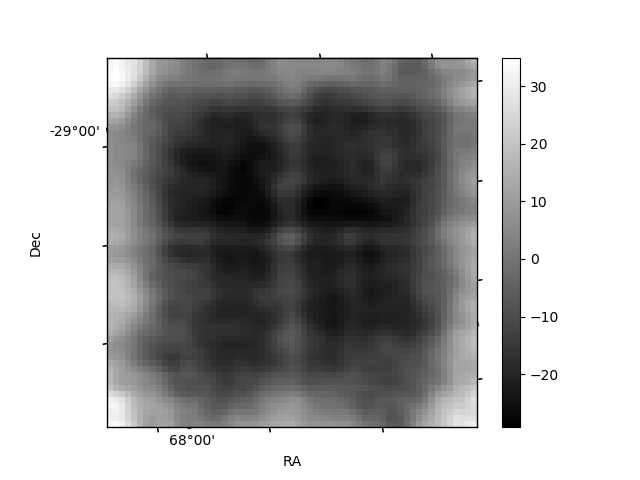
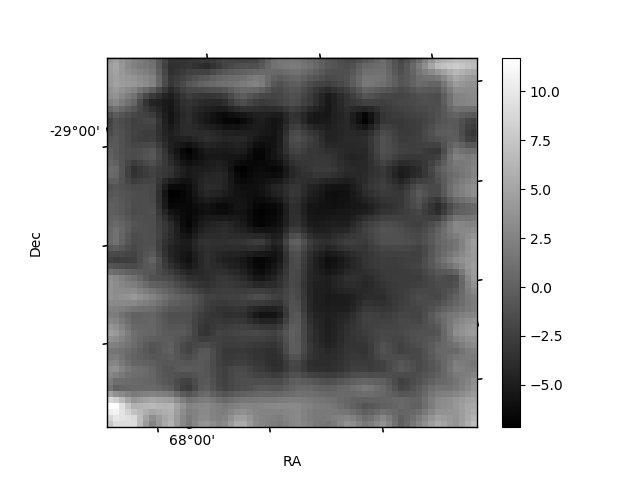
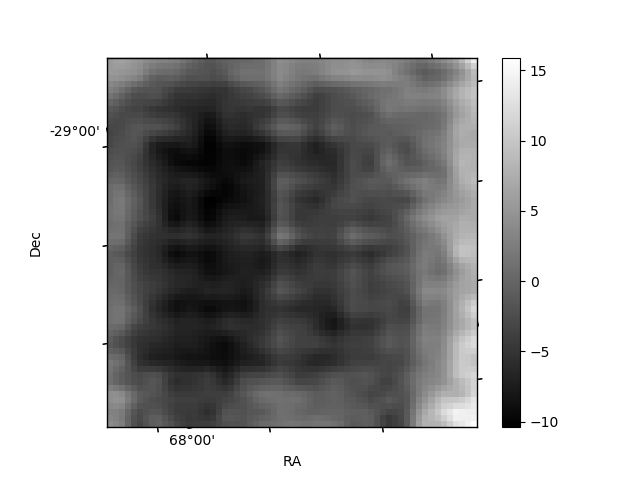
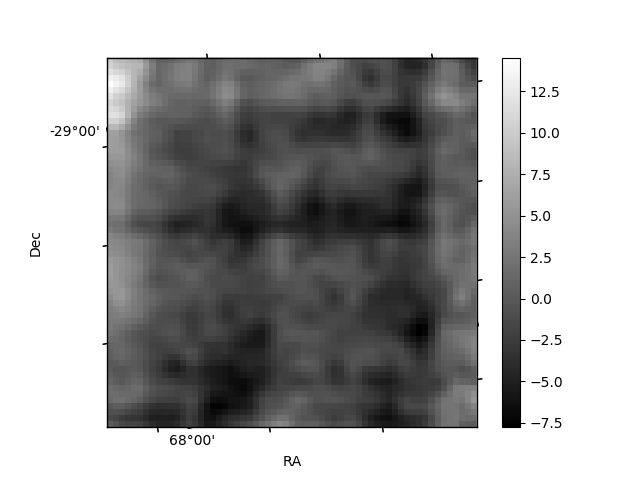
Histogram calculated using DETX and DETY for each event in the final _common_clean file
| Quadrant A | 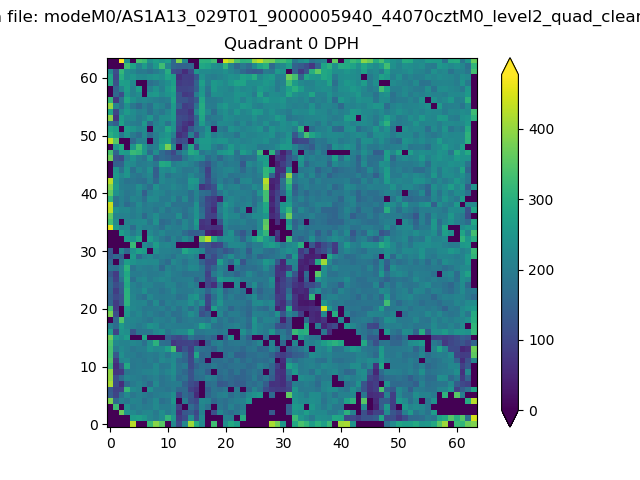 |
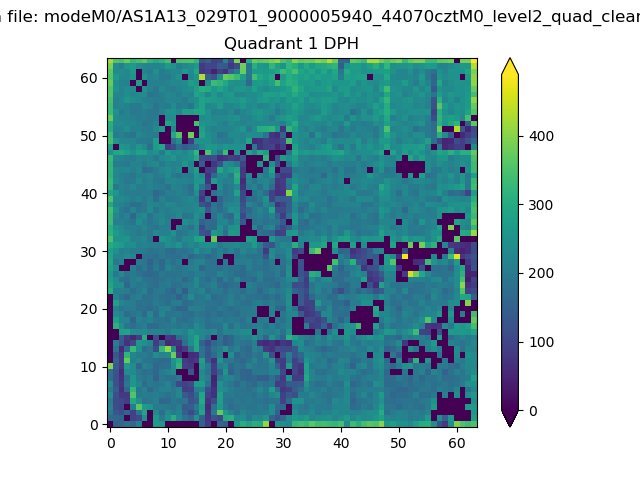 |
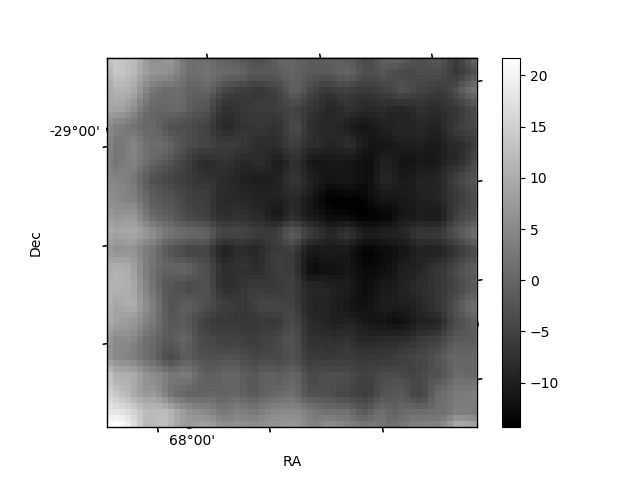
Quadrant B |
|---|---|---|---|
| Quadrant D | 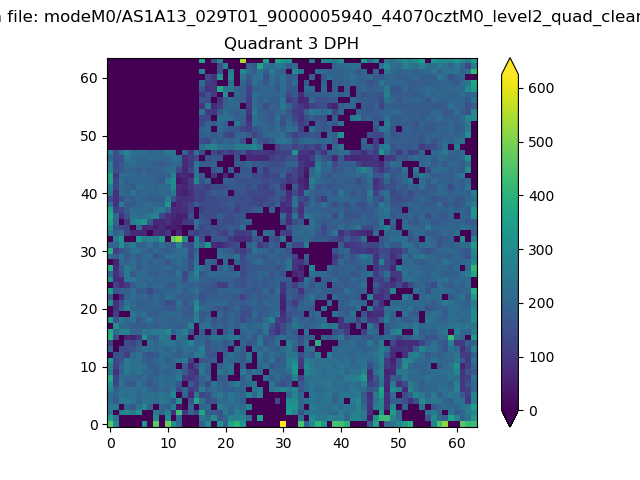 |
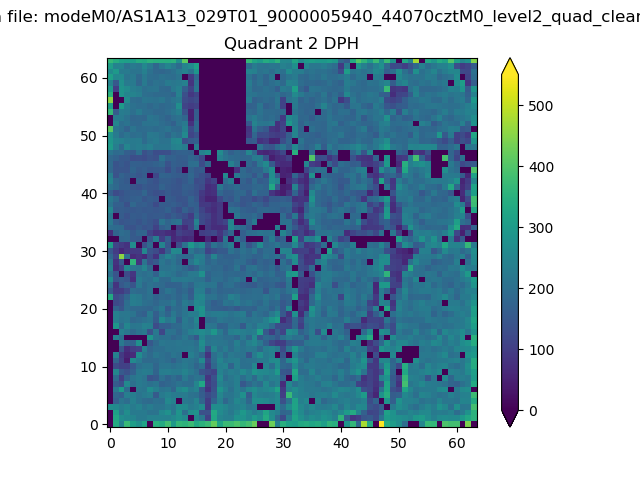 |
Quadrant C |
| Plot type | Count rate plots | Images |
|---|---|---|
| Comparison with Poisson distribution Blue bars denote a histogram of data divided into 1 sec bins. Red curve is a Poisson curve with rate = median count rate of data. |
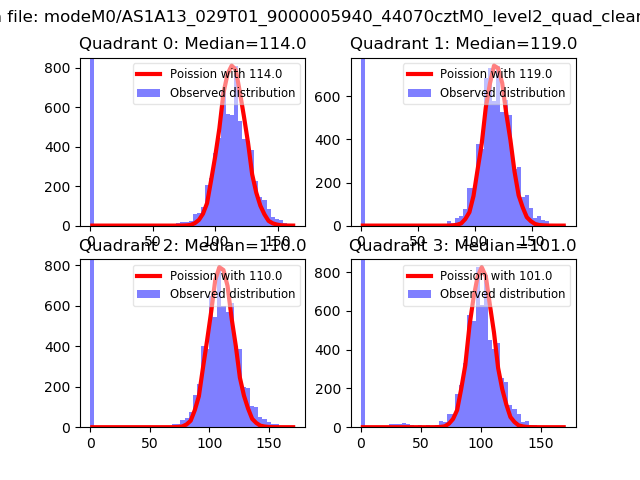 |
 |
| Quadrant-wise count rates Data is divided into 100 sec bins |
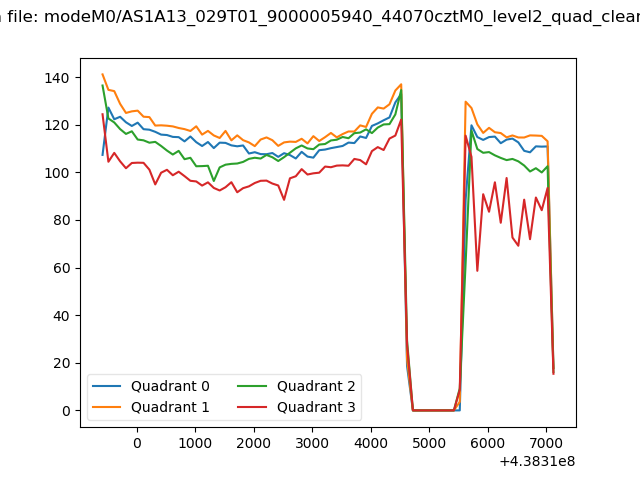 |
|
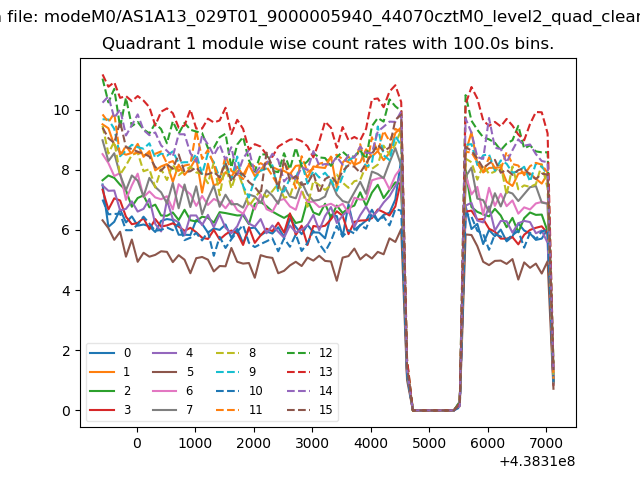
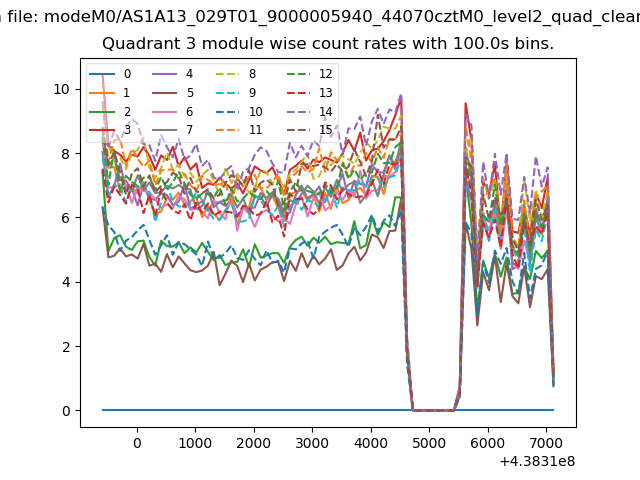
| Module-wise count rates for Quadrant A Data is divided into 100 sec bins |
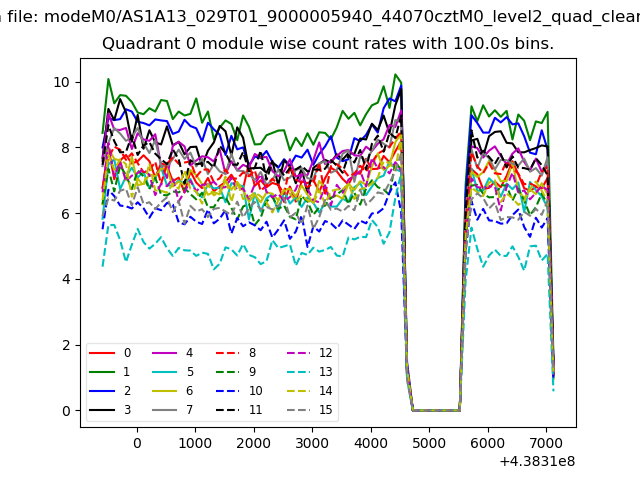 |
 |
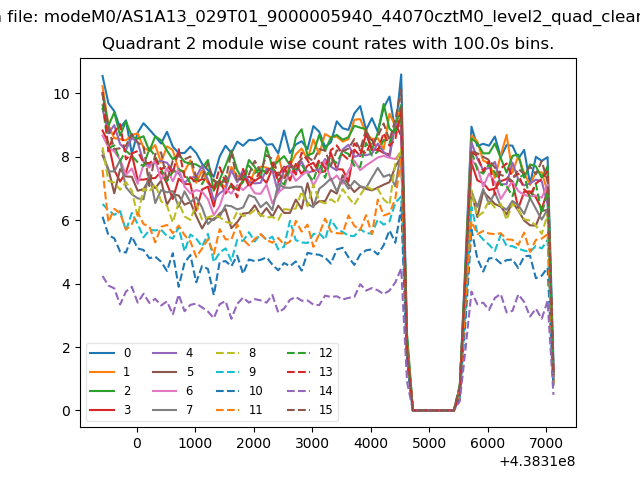
| Module-wise count rates for Quadrant B Data is divided into 100 sec bins |
 |
 |
| Module-wise count rates for Quadrant C Data is divided into 100 sec bins |
 |
 |
| Module-wise count rates for Quadrant D Data is divided into 100 sec bins |
 |
 |
| Parameter | Plot |
|---|---|
| CZT HV Monitor | 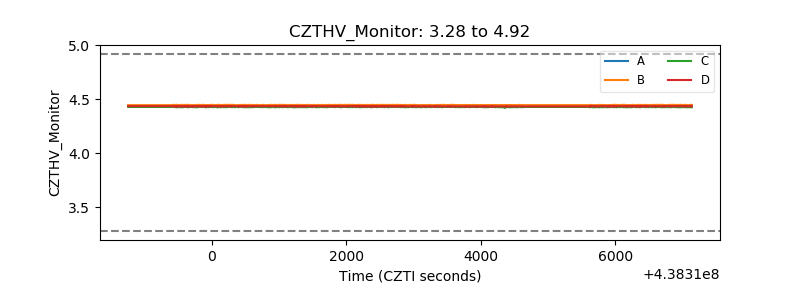 |
| D_VDD | 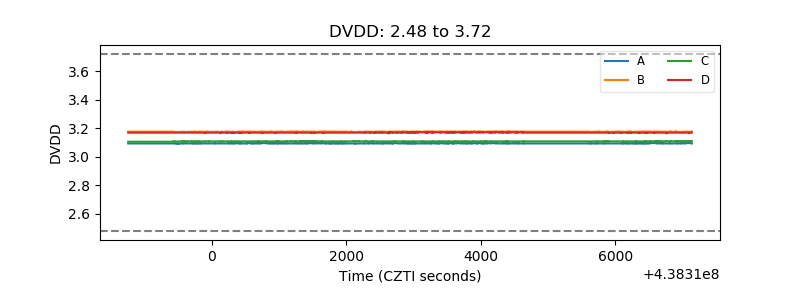 |
| Temperature 1 | 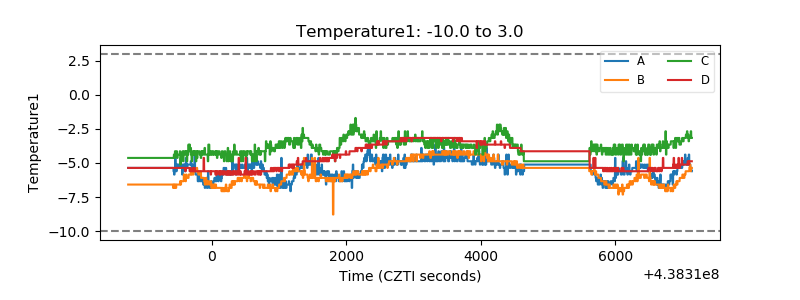 |
| Veto HV Monitor | 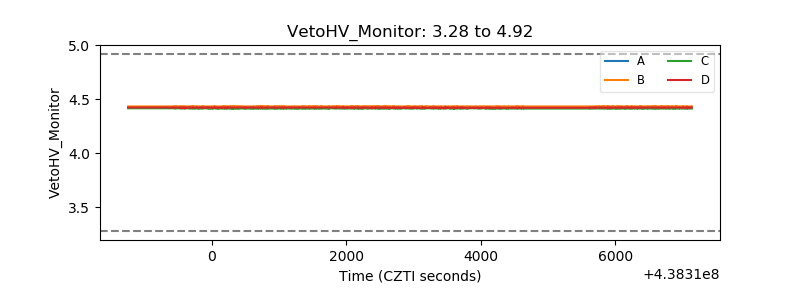 |
| Veto LLD | 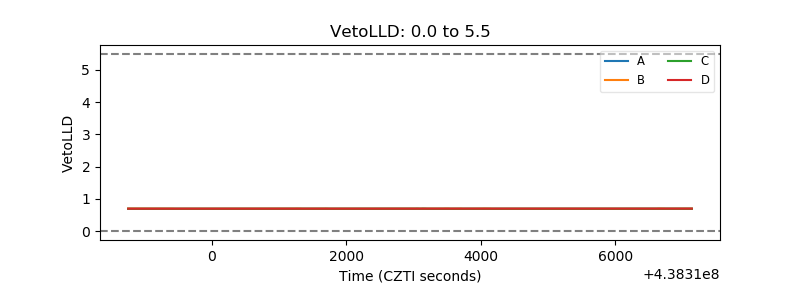 |
| Alpha Counter | 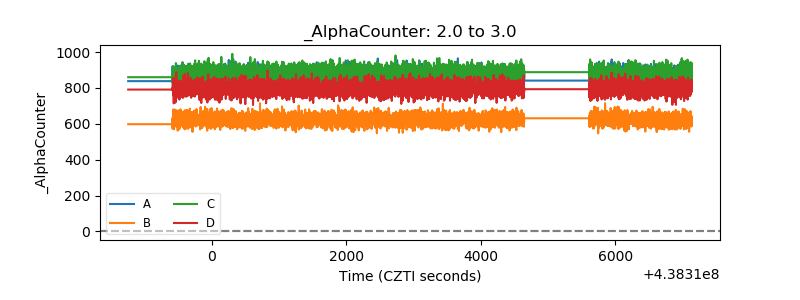 |
| _CPM_Rate | 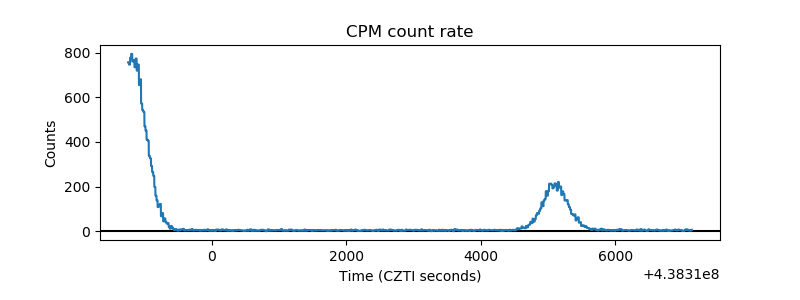 |
| CZT Counter | 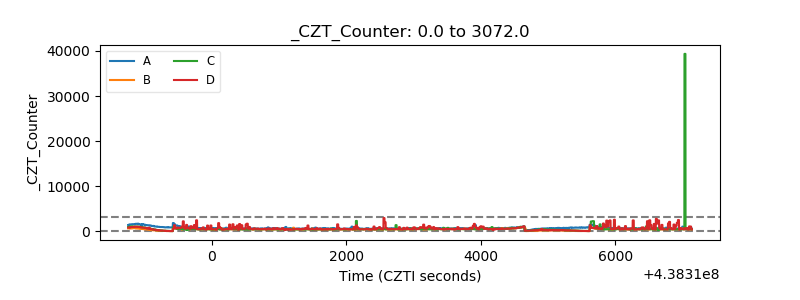 |
| +2.5 Volts monitor | 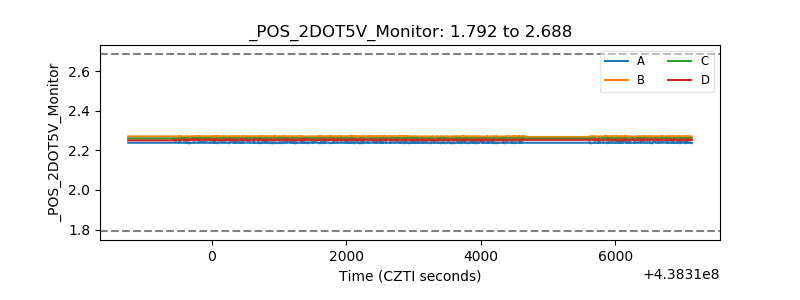 |
| +5 Volts monitor | 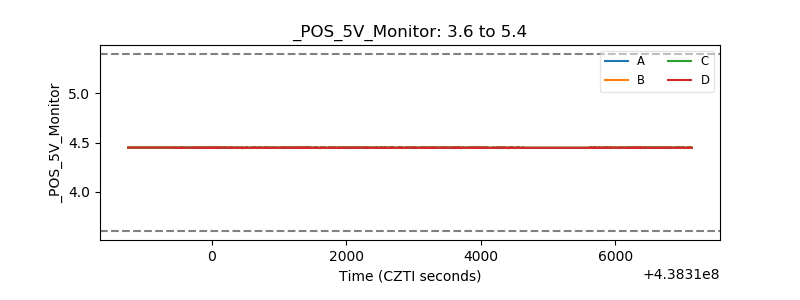 |
| _ROLL_ROT | 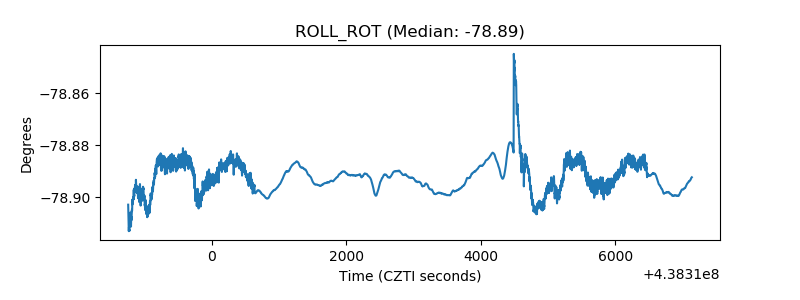 |
| _Roll_DEC | 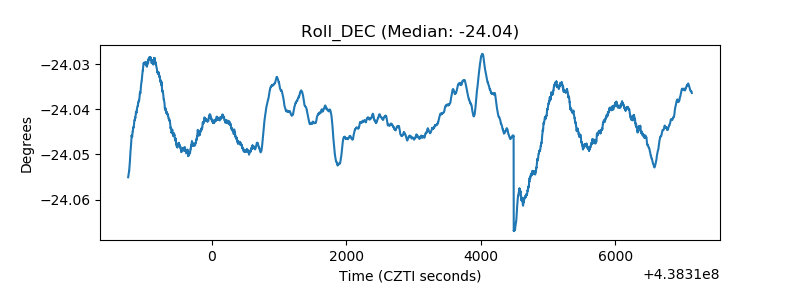 |
| _Roll_RA | 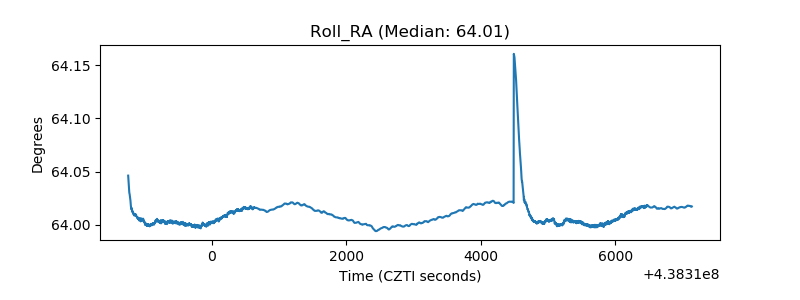 |
| Veto Counter | 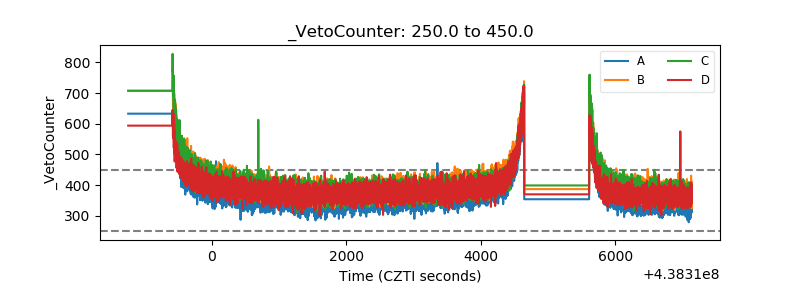 |