| Param | Original file | Final file |
|---|---|---|
| Filename | modeM0/AS1A13_029T01_9000005940_44071cztM0_level2.fits | modeM0/AS1A13_029T01_9000005940_44071cztM0_level2_quad_clean.evt |
| Size (bytes) | 458,593,920 | 110,338,560 |
| Size | 437.3 MB | 105.2 MB |
| Events in quadrant A | 4,230,649 | 745,599 |
| Events in quadrant B | 3,100,508 | 777,891 |
| Events in quadrant C | 3,237,197 | 724,312 |
| Events in quadrant D | 5,875,024 | 615,719 |
| Mode SS | |||
|---|---|---|---|
| Quadrant | BADHDUFLAG | Total packets | Discarded packets |
| A | 0 | 140 | 0 |
| B | 0 | 140 | 0 |
| C | 0 | 140 | 0 |
| D | 0 | 140 | 0 |
| Mode M0 | |||
|---|---|---|---|
| Quadrant | BADHDUFLAG | Total packets | Discarded packets |
| A | 0 | 17150 | 1 |
| B | 0 | 14009 | 1 |
| C | 0 | 14440 | 1 |
| D | 0 | 22209 | 1 |
| Mode M9 | |||
|---|---|---|---|
| Quadrant | BADHDUFLAG | Total packets | Discarded packets |
| A | 0 | 5 | 0 |
| B | 0 | 5 | 0 |
| C | 0 | 5 | 0 |
| D | 0 | 5 | 0 |
| Quadrant | Total seconds | Saturated seconds | Saturation percentage |
|---|---|---|---|
| A | 6846 | 108 | 1.577564% |
| B | 6847 | 102 | 1.489704% |
| C | 6847 | 94 | 1.372864% |
| D | 6846 | 792 | 11.568799% |
Noise dominated data is calculated using 1-second bins in cleaned event files. If a bin has >2000 counts, and if more than 50% of those come from <1% of pixels, then it is considered to be noise-dominated and hence unusable.
| Quadrant | # 1 sec bins | Bins with >0 counts | Bins with >2000 counts | High rate bins dominated by noise | Noise dominated (total time) | Noise dominated (detector-on time) | Marked lightcurve |
|---|---|---|---|---|---|---|---|
| A | 7416 | 6847 | 1 | 1 | 0.01% | 0.01% | 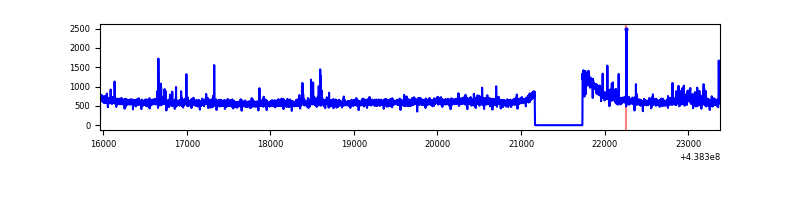 |
| B | 7417 | 6848 | 0 | 0 | 0.00% | 0.00% | 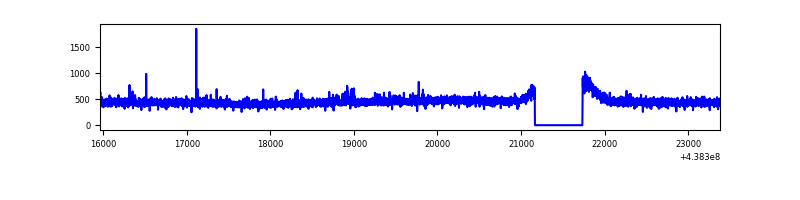 |
| C | 7417 | 6848 | 18 | 18 | 0.24% | 0.26% | 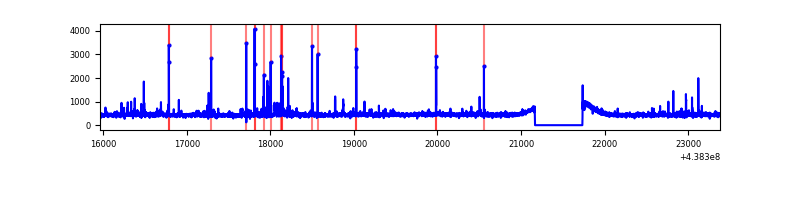 |
| D | 7416 | 6847 | 642 | 642 | 8.66% | 9.38% |  |
Top three noisy pixels from each quadrant. If the there are fewer than three noisy pixels in the level2.evt file, extra rows are filled as -1
| Pixel properties | Quadrant properties | ||||||
|---|---|---|---|---|---|---|---|
| Quadrant | DetID | PixID | Counts | Sigma | Mean | Median | Sigma |
| A | 10 | 83 | 1108872 | 6913.95 | 778 | 759 | 160.3 |
| A | 12 | 227 | 66386 | 409.47 | 778 | 759 | 160.3 |
| A | 15 | 222 | 19800 | 118.8 | 778 | 759 | 160.3 |
| B | 12 | 111 | 20415 | 127.12 | 780 | 756 | 154.6 |
| B | 11 | 111 | 18723 | 116.18 | 780 | 756 | 154.6 |
| B | 14 | 111 | 18369 | 113.89 | 780 | 756 | 154.6 |
| C | 14 | 254 | 100701 | 551.13 | 773 | 780 | 181.3 |
| C | 11 | 16 | 42803 | 231.78 | 773 | 780 | 181.3 |
| C | 0 | 207 | 41908 | 226.85 | 773 | 780 | 181.3 |
| D | 13 | 249 | 1411713 | 7703.39 | 735 | 715 | 183.2 |
| D | 5 | 235 | 686836 | 3745.9 | 735 | 715 | 183.2 |
| D | 5 | 222 | 522638 | 2849.46 | 735 | 715 | 183.2 |
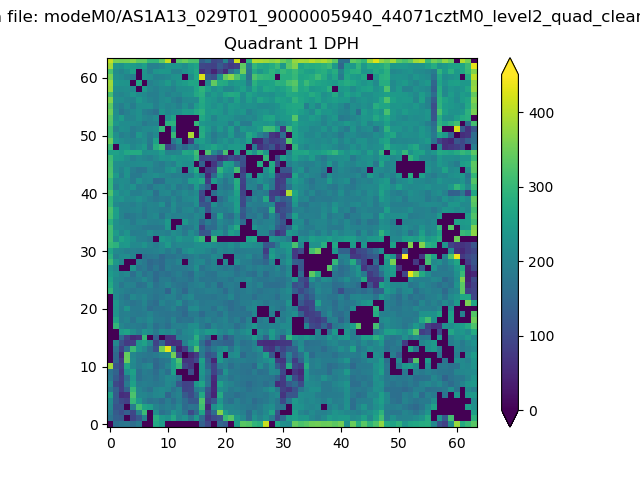
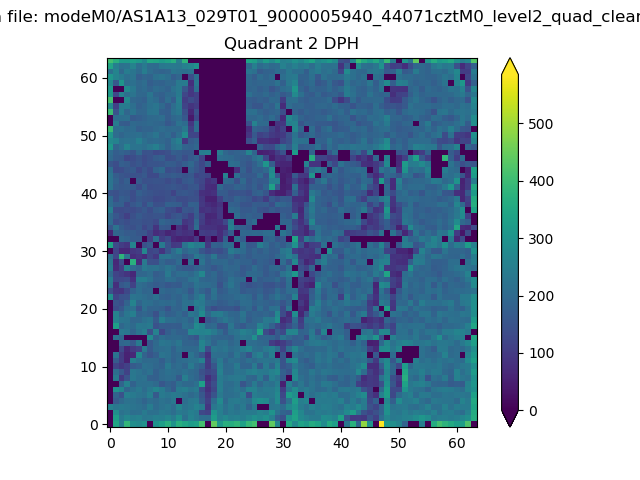
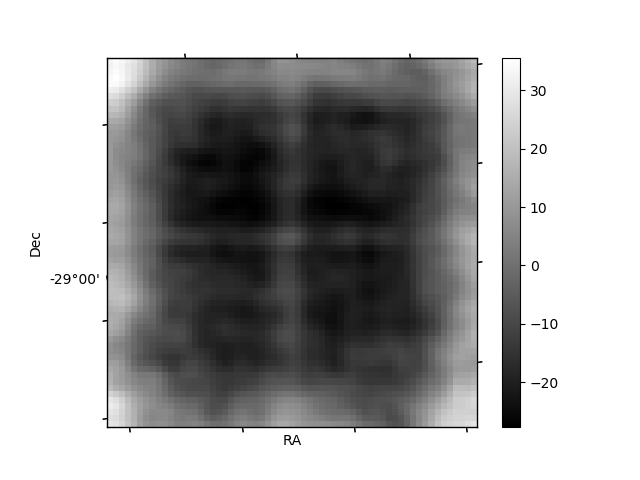
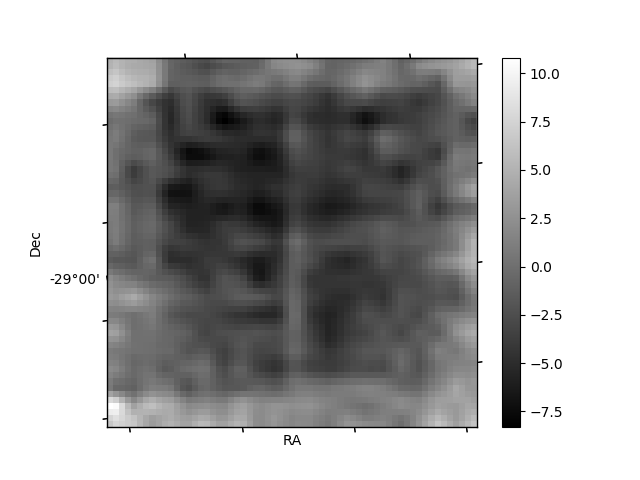
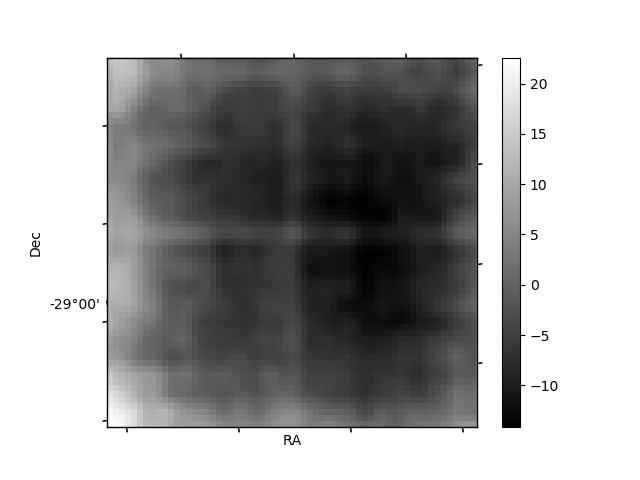
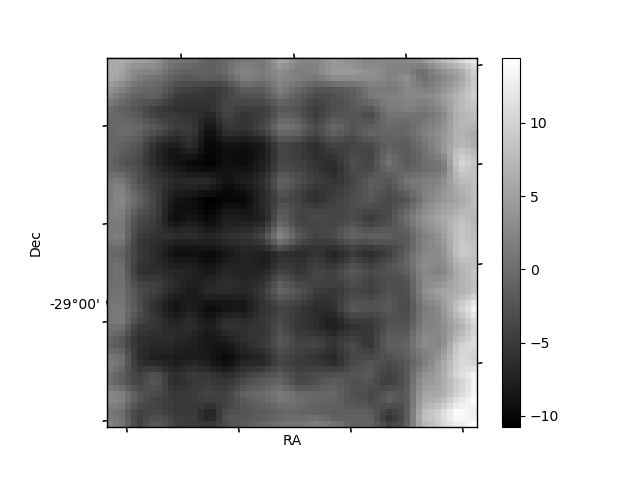
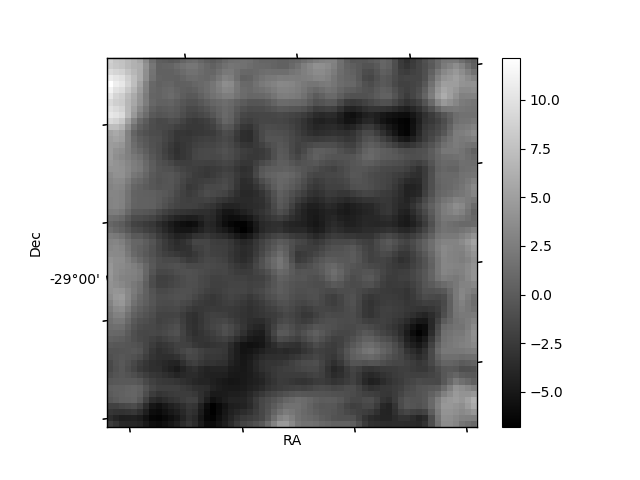
Histogram calculated using DETX and DETY for each event in the final _common_clean file
| Quadrant A | 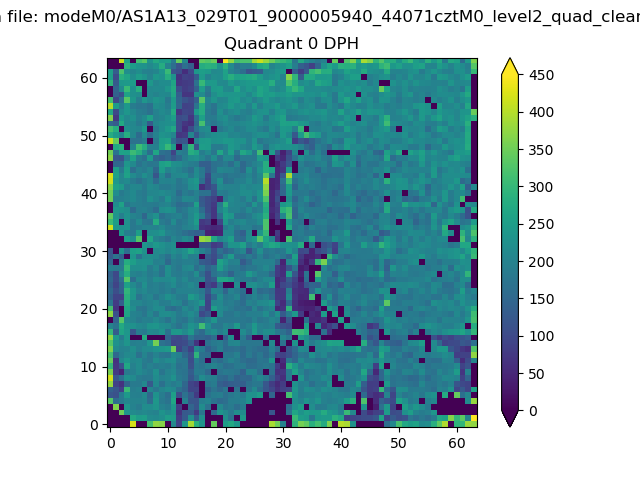 |
 |
Quadrant B |
|---|---|---|---|
| Quadrant D | 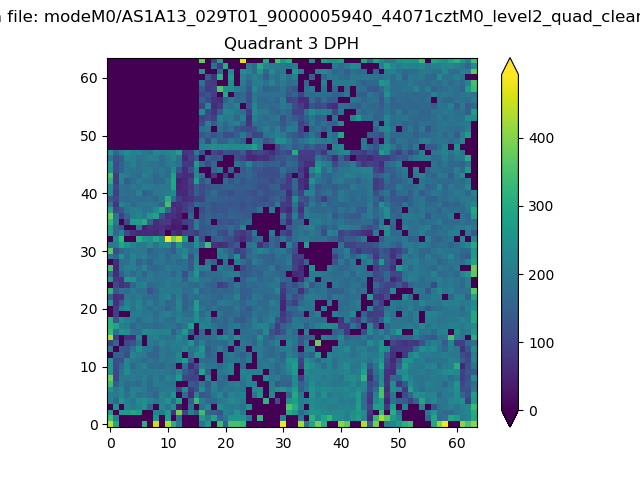 |
 |
Quadrant C |
| Plot type | Count rate plots | Images |
|---|---|---|
| Comparison with Poisson distribution Blue bars denote a histogram of data divided into 1 sec bins. Red curve is a Poisson curve with rate = median count rate of data. |
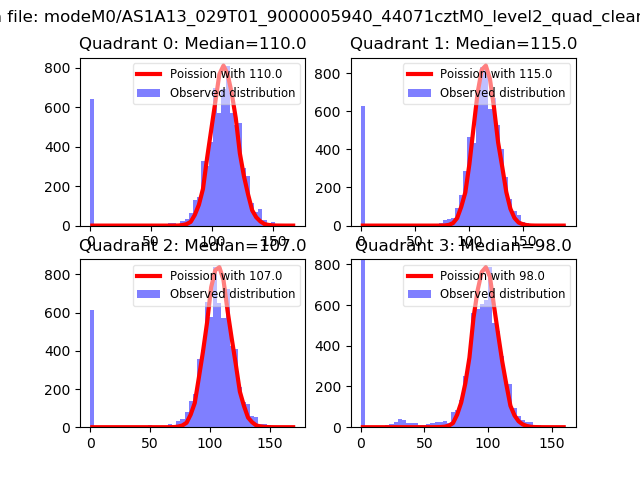 |
 |
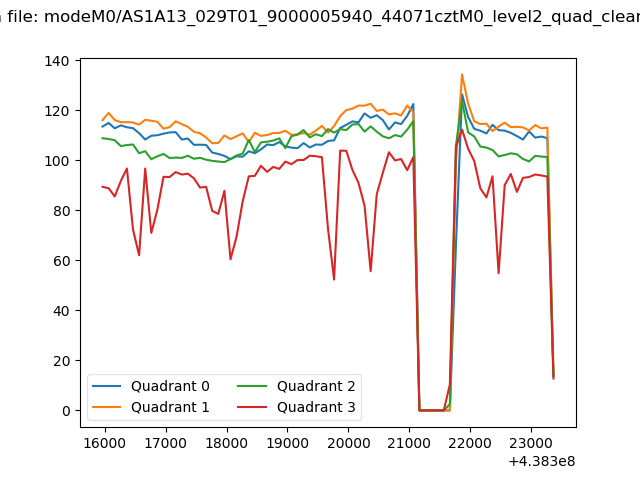
| Quadrant-wise count rates Data is divided into 100 sec bins |
 |
|
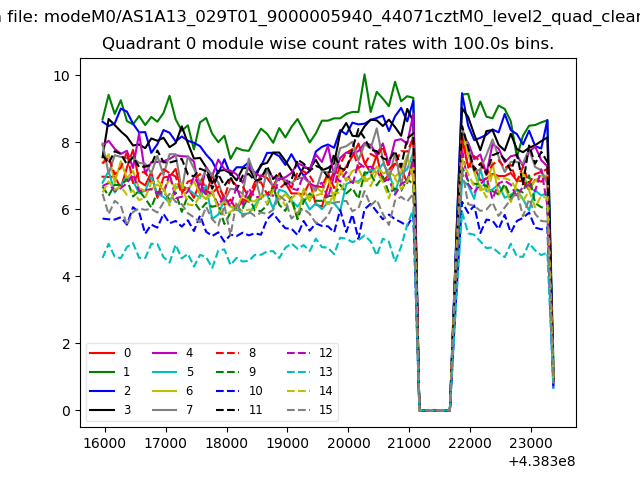
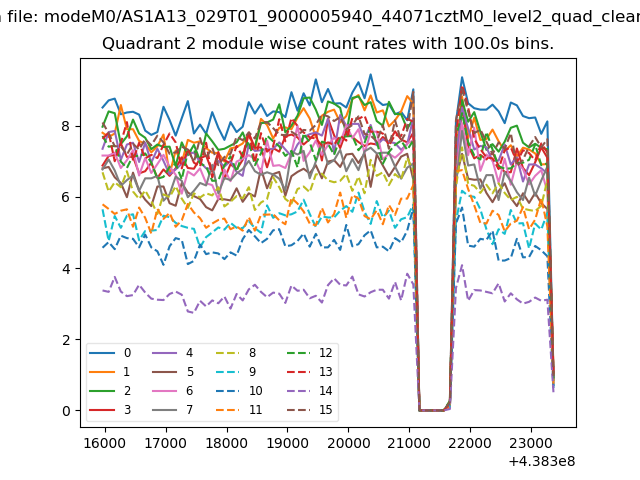
| Module-wise count rates for Quadrant A Data is divided into 100 sec bins |
 |
 |
| Module-wise count rates for Quadrant B Data is divided into 100 sec bins |
 |
 |
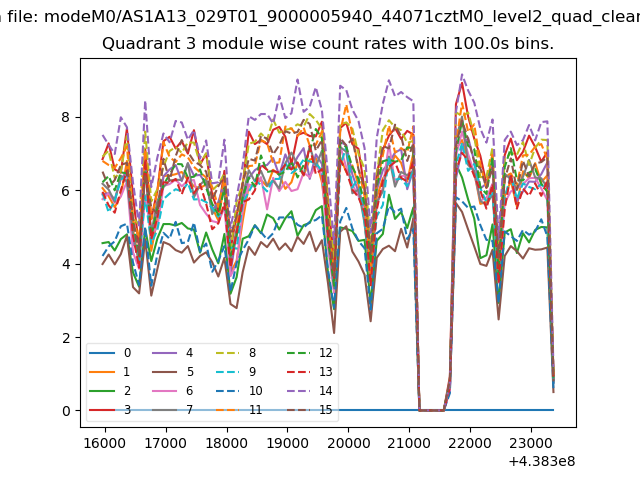
| Module-wise count rates for Quadrant C Data is divided into 100 sec bins |
 |
 |
| Module-wise count rates for Quadrant D Data is divided into 100 sec bins |
 |
 |
| Parameter | Plot |
|---|---|
| CZT HV Monitor |  |
| D_VDD | 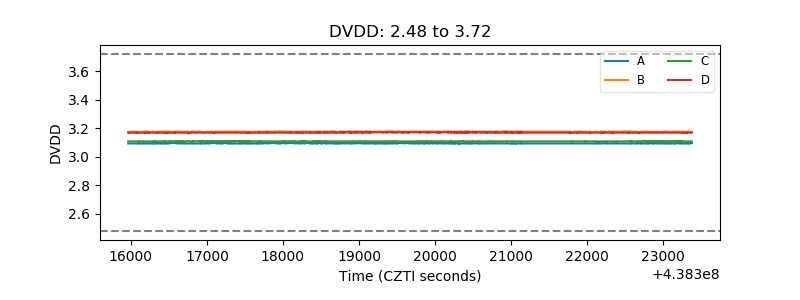 |
| Temperature 1 | 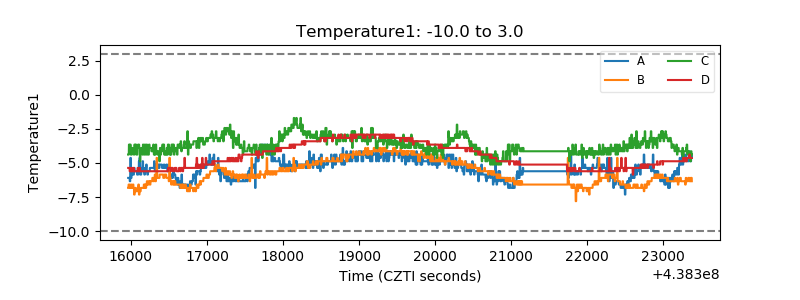 |
| Veto HV Monitor | 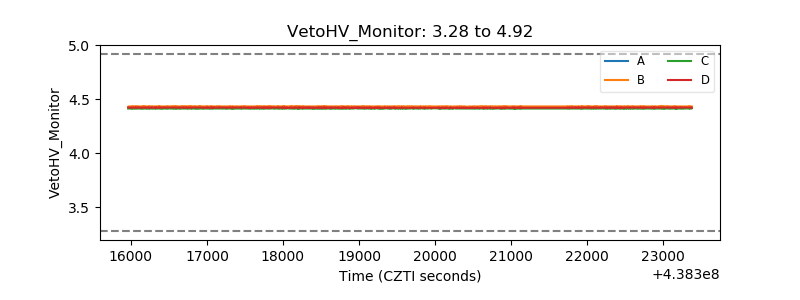 |
| Veto LLD | 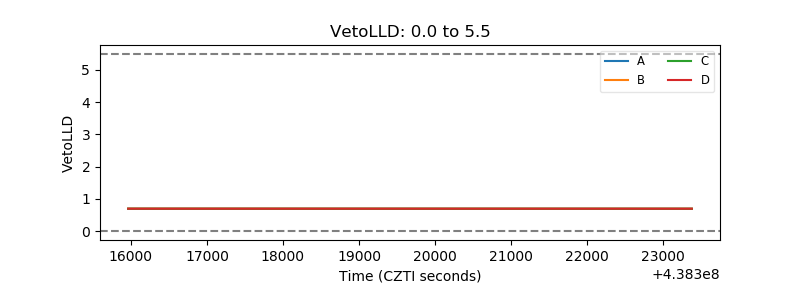 |
| Alpha Counter | 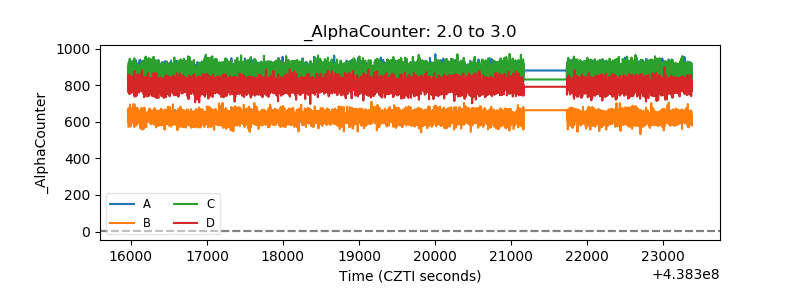 |
| _CPM_Rate | 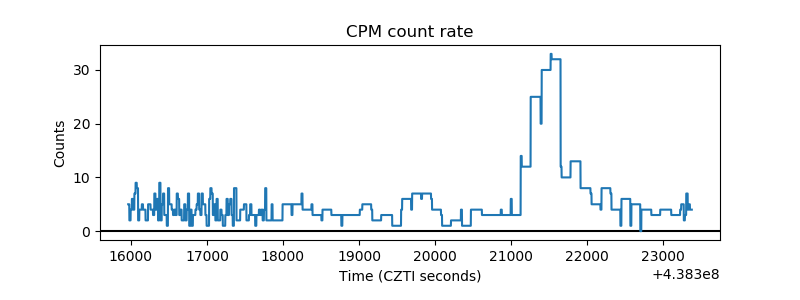 |
| CZT Counter | 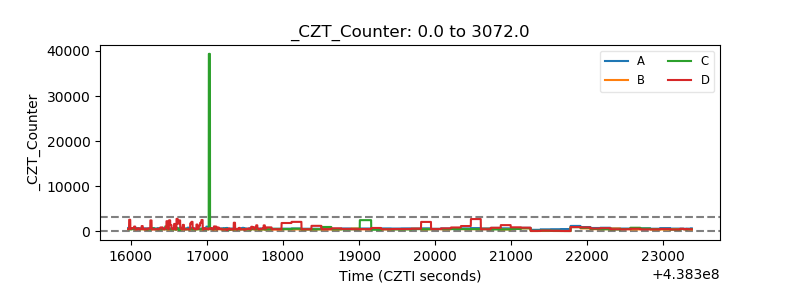 |
| +2.5 Volts monitor | 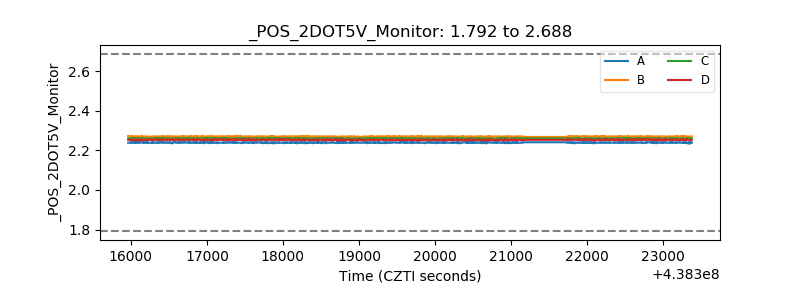 |
| +5 Volts monitor | 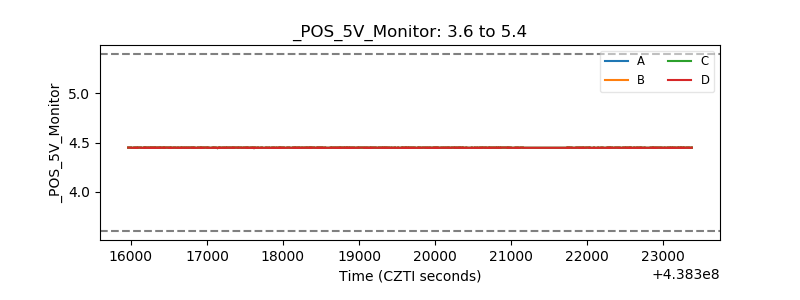 |
| _ROLL_ROT | 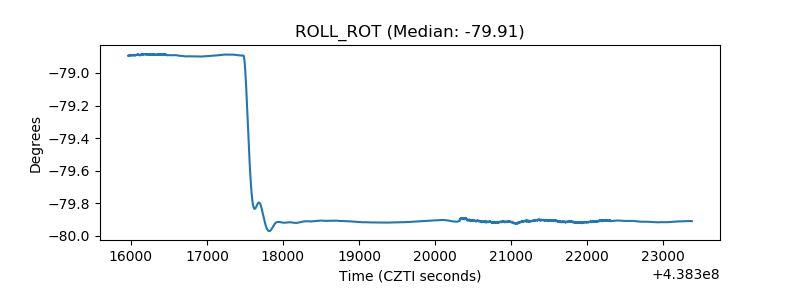 |
| _Roll_DEC | 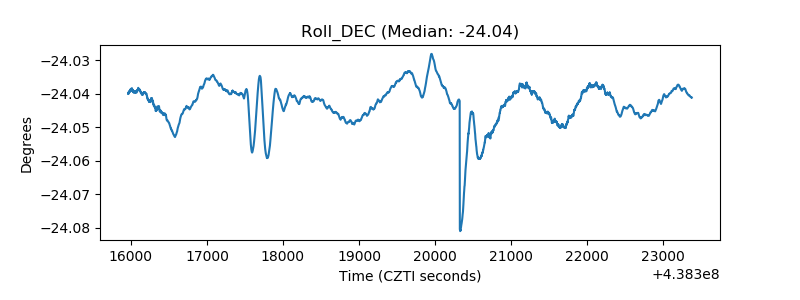 |
| _Roll_RA | 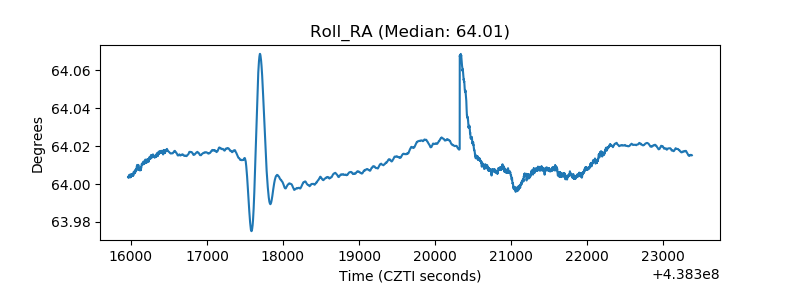 |
| Veto Counter | 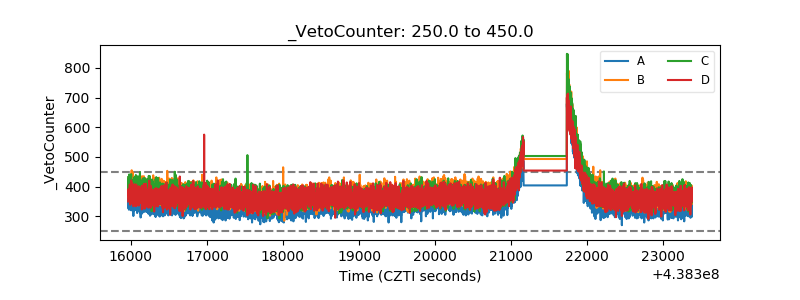 |