| Param | Original file | Final file |
|---|---|---|
| Filename | modeM0/AS1A13_029T01_9000005940_44072cztM0_level2.fits | modeM0/AS1A13_029T01_9000005940_44072cztM0_level2_quad_clean.evt |
| Size (bytes) | 510,517,440 | 128,600,640 |
| Size | 486.9 MB | 122.6 MB |
| Events in quadrant A | 5,880,310 | 859,420 |
| Events in quadrant B | 3,650,993 | 895,846 |
| Events in quadrant C | 3,739,491 | 838,121 |
| Events in quadrant D | 5,011,710 | 749,528 |
| Mode SS | |||
|---|---|---|---|
| Quadrant | BADHDUFLAG | Total packets | Discarded packets |
| A | 0 | 162 | 0 |
| B | 0 | 162 | 0 |
| C | 0 | 162 | 0 |
| D | 0 | 162 | 0 |
| Mode M0 | |||
|---|---|---|---|
| Quadrant | BADHDUFLAG | Total packets | Discarded packets |
| A | 0 | 23602 | 1 |
| B | 0 | 16502 | 1 |
| C | 0 | 16817 | 1 |
| D | 0 | 20419 | 1 |
| Mode M9 | |||
|---|---|---|---|
| Quadrant | BADHDUFLAG | Total packets | Discarded packets |
| A | 0 | 5 | 0 |
| B | 0 | 5 | 0 |
| C | 0 | 5 | 0 |
| D | 0 | 5 | 0 |
| Quadrant | Total seconds | Saturated seconds | Saturation percentage |
|---|---|---|---|
| A | 7922 | 193 | 2.436253% |
| B | 7921 | 140 | 1.767454% |
| C | 7921 | 92 | 1.161470% |
| D | 7922 | 397 | 5.011361% |
Noise dominated data is calculated using 1-second bins in cleaned event files. If a bin has >2000 counts, and if more than 50% of those come from <1% of pixels, then it is considered to be noise-dominated and hence unusable.
| Quadrant | # 1 sec bins | Bins with >0 counts | Bins with >2000 counts | High rate bins dominated by noise | Noise dominated (total time) | Noise dominated (detector-on time) | Marked lightcurve |
|---|---|---|---|---|---|---|---|
| A | 8492 | 7923 | 24 | 24 | 0.28% | 0.30% | 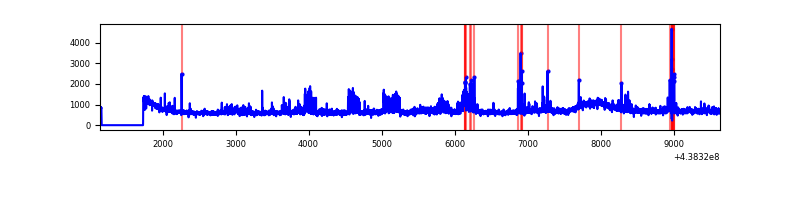 |
| B | 8491 | 7922 | 0 | 0 | 0.00% | 0.00% | 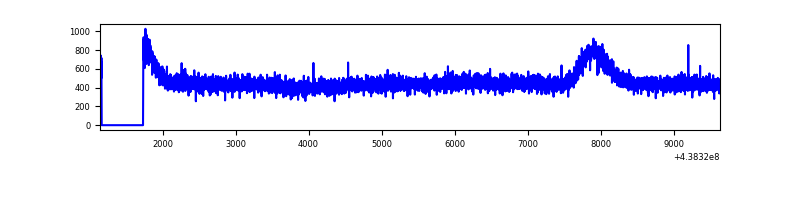 |
| C | 8491 | 7922 | 8 | 8 | 0.09% | 0.10% | 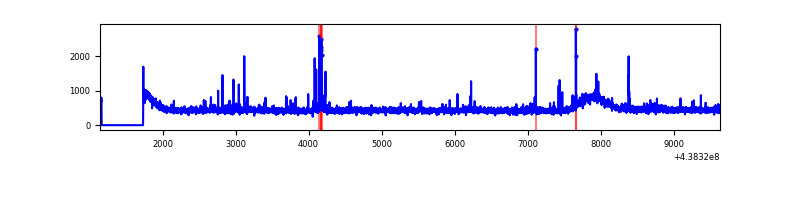 |
| D | 8492 | 7923 | 251 | 251 | 2.96% | 3.17% | 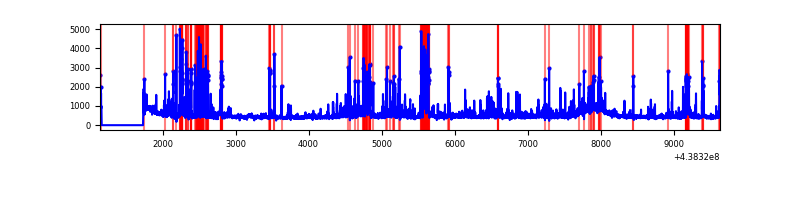 |
Top three noisy pixels from each quadrant. If the there are fewer than three noisy pixels in the level2.evt file, extra rows are filled as -1
| Pixel properties | Quadrant properties | ||||||
|---|---|---|---|---|---|---|---|
| Quadrant | DetID | PixID | Counts | Sigma | Mean | Median | Sigma |
| A | 10 | 83 | 1222462 | 6428.91 | 922 | 901 | 190.0 |
| A | 15 | 222 | 873301 | 4591.33 | 922 | 901 | 190.0 |
| A | 12 | 227 | 108042 | 563.87 | 922 | 901 | 190.0 |
| B | 12 | 111 | 24698 | 128.5 | 925 | 895 | 185.2 |
| B | 11 | 111 | 22670 | 117.55 | 925 | 895 | 185.2 |
| B | 14 | 111 | 22419 | 116.19 | 925 | 895 | 185.2 |
| C | 14 | 254 | 113581 | 515.57 | 918 | 925 | 218.5 |
| C | 11 | 16 | 14271 | 61.08 | 918 | 925 | 218.5 |
| C | 4 | 254 | 10835 | 45.35 | 918 | 925 | 218.5 |
| D | 13 | 249 | 540101 | 2404.79 | 899 | 874 | 224.2 |
| D | 1 | 52 | 422628 | 1880.9 | 899 | 874 | 224.2 |
| D | 5 | 235 | 270005 | 1200.24 | 899 | 874 | 224.2 |
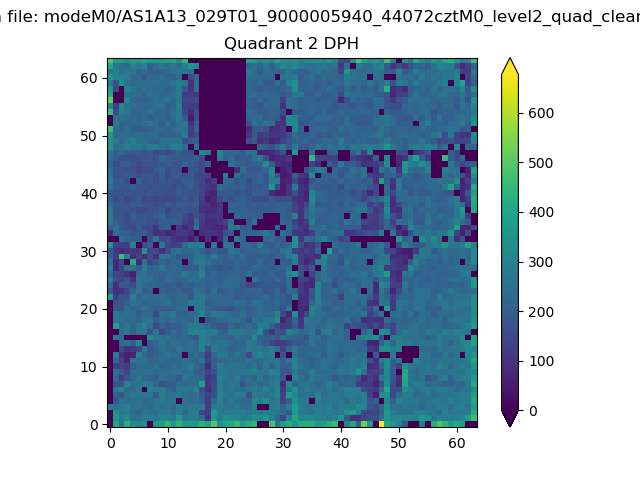
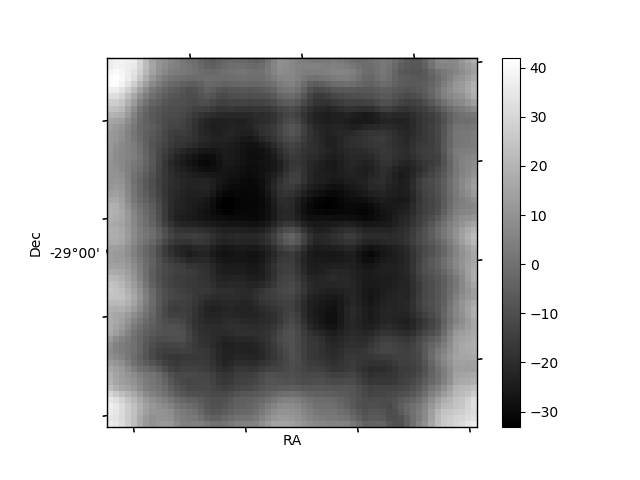
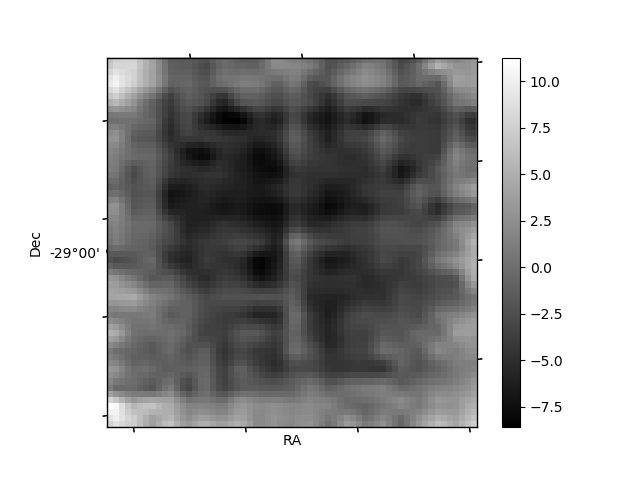
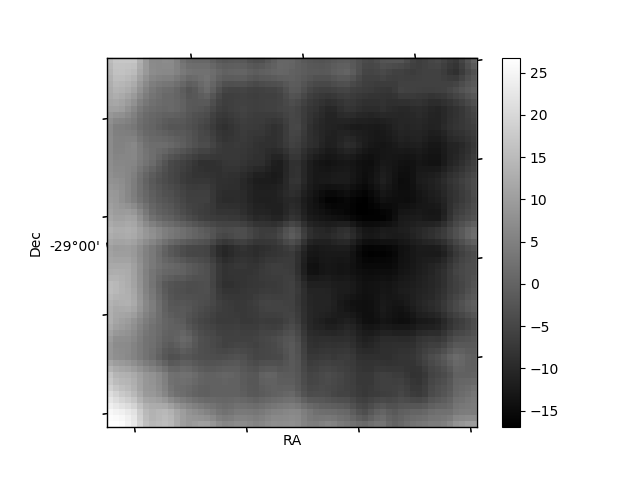
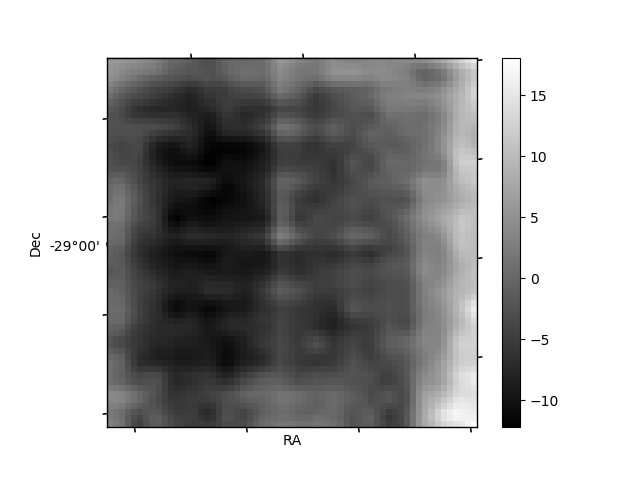
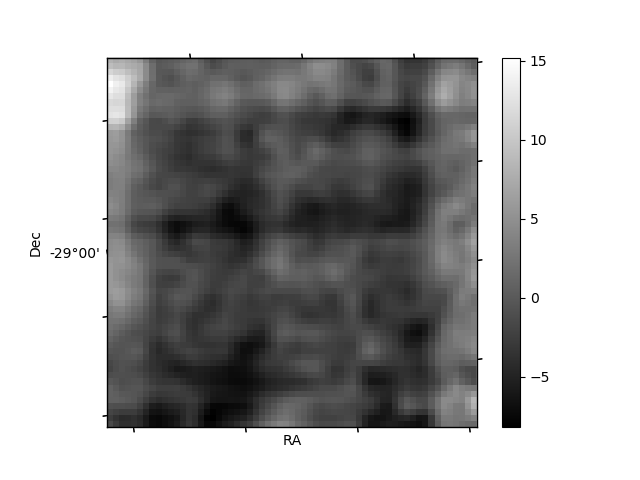
Histogram calculated using DETX and DETY for each event in the final _common_clean file
| Quadrant A | 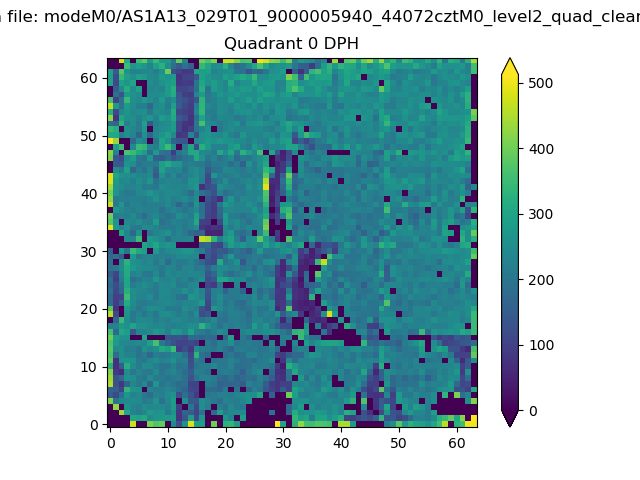 |
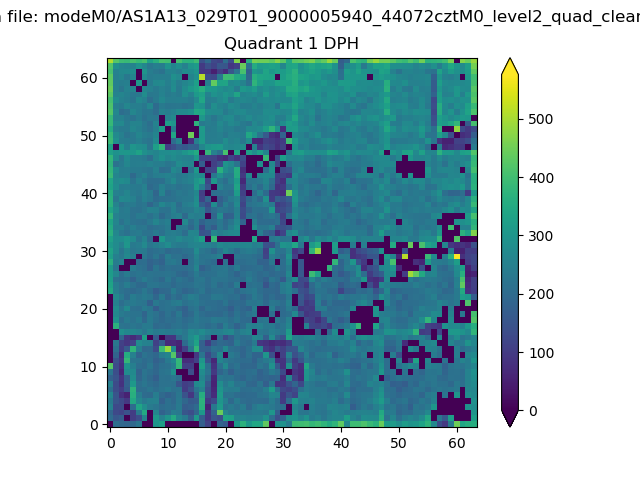 |
Quadrant B |
|---|---|---|---|
| Quadrant D | 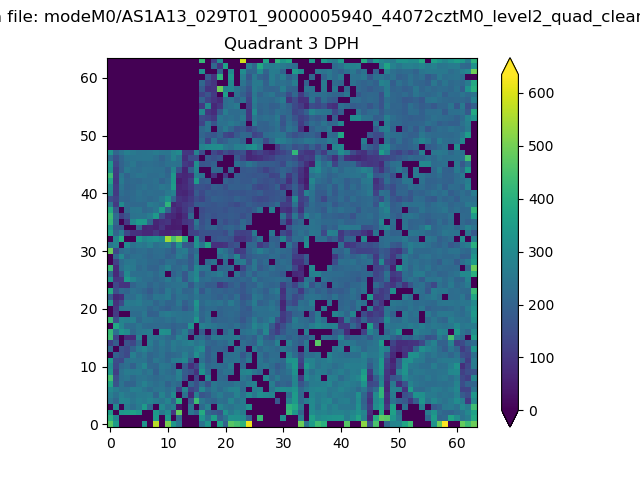 |
 |
Quadrant C |
| Plot type | Count rate plots | Images |
|---|---|---|
| Comparison with Poisson distribution Blue bars denote a histogram of data divided into 1 sec bins. Red curve is a Poisson curve with rate = median count rate of data. |
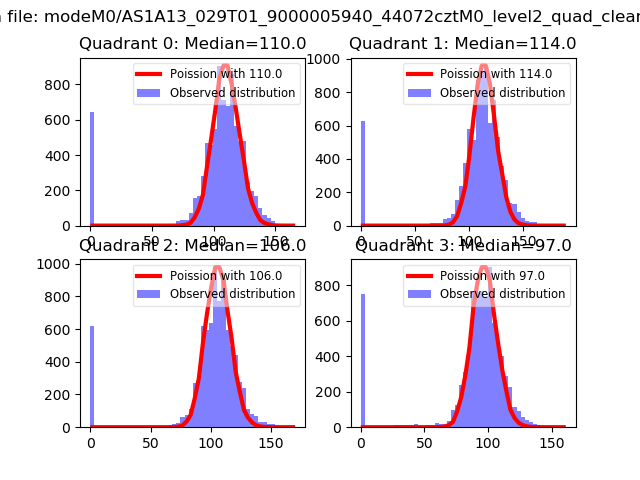 |
 |
| Quadrant-wise count rates Data is divided into 100 sec bins |
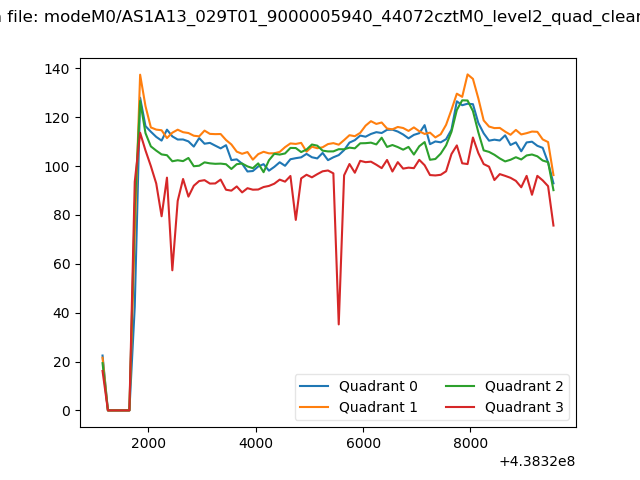 |
|
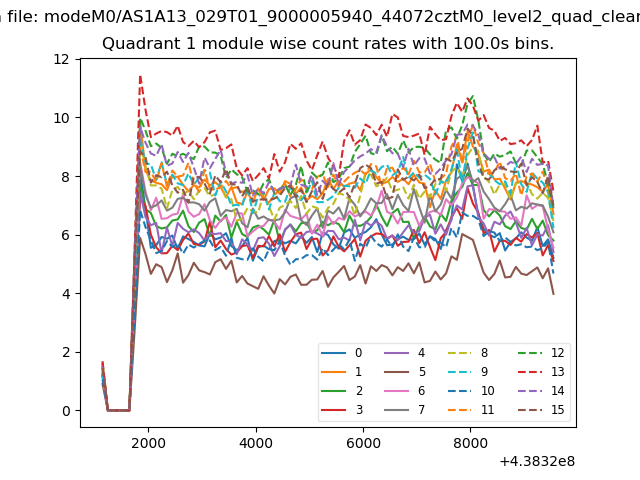
| Module-wise count rates for Quadrant A Data is divided into 100 sec bins |
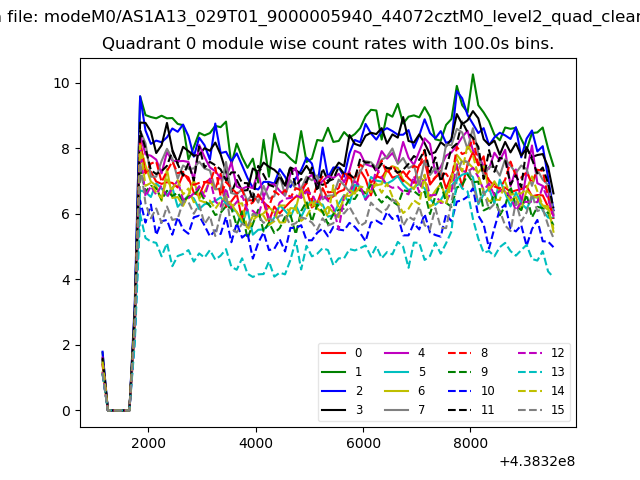 |
 |
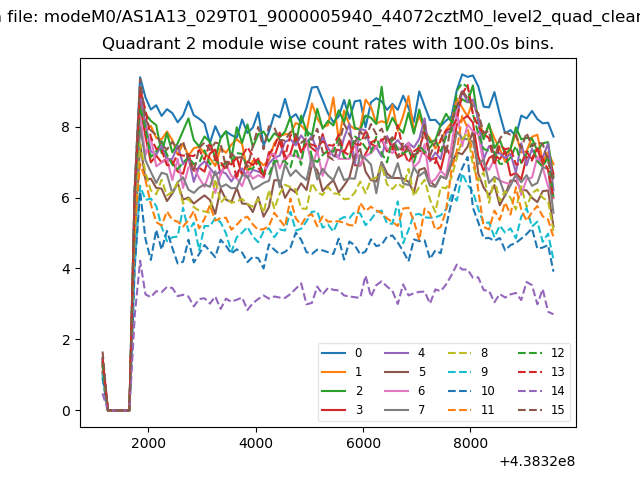
| Module-wise count rates for Quadrant B Data is divided into 100 sec bins |
 |
 |
| Module-wise count rates for Quadrant C Data is divided into 100 sec bins |
 |
 |
| Module-wise count rates for Quadrant D Data is divided into 100 sec bins |
 |
 |
| Parameter | Plot |
|---|---|
| CZT HV Monitor | 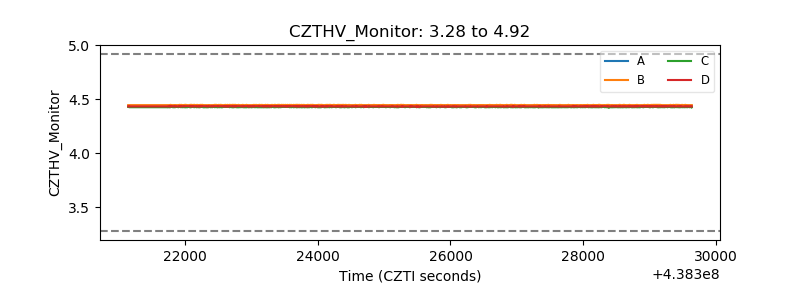 |
| D_VDD | 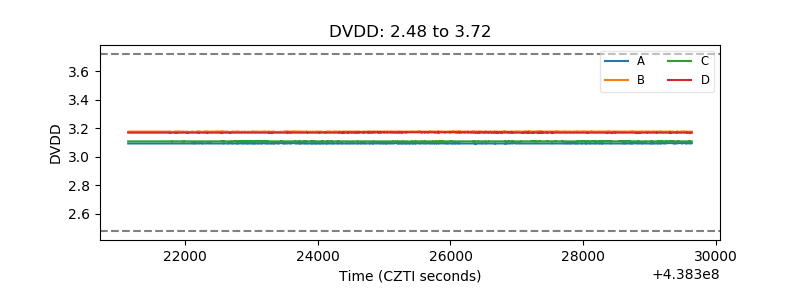 |
| Temperature 1 | 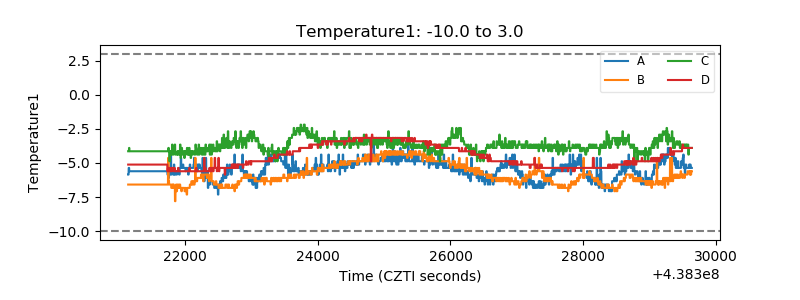 |
| Veto HV Monitor | 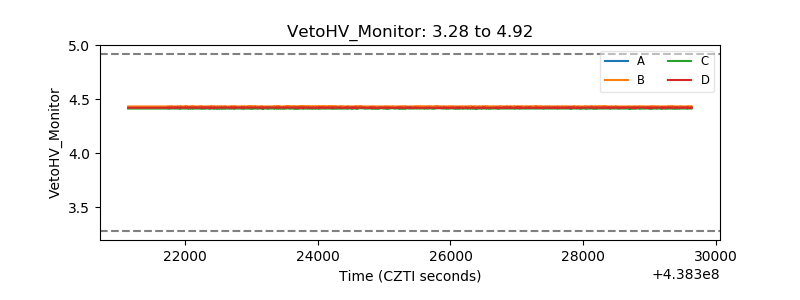 |
| Veto LLD | 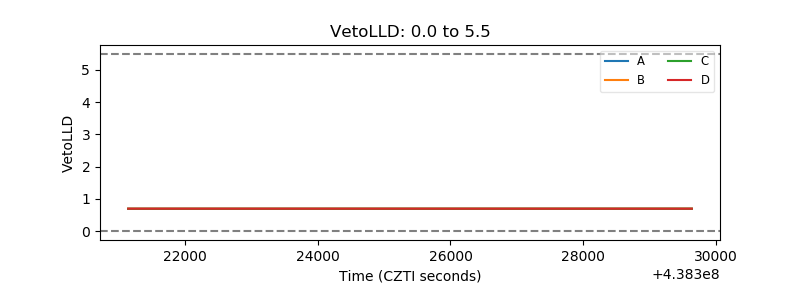 |
| Alpha Counter | 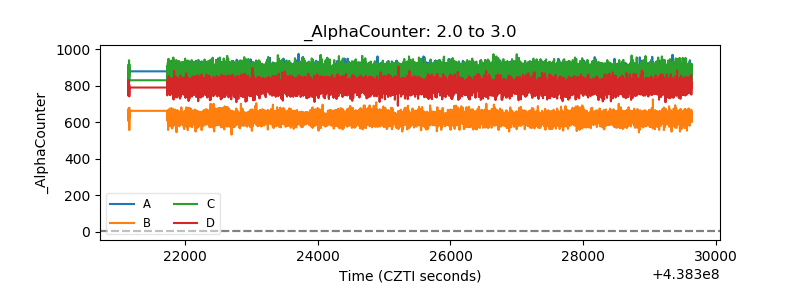 |
| _CPM_Rate | 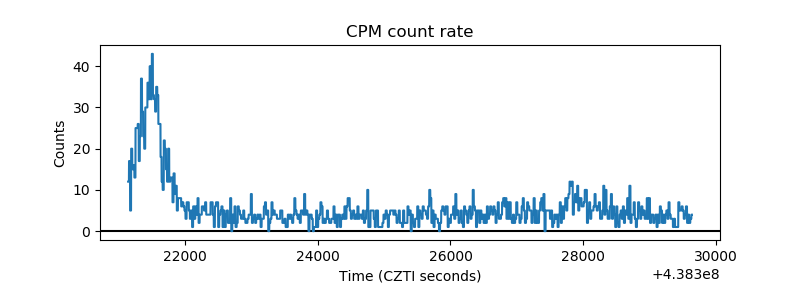 |
| CZT Counter | 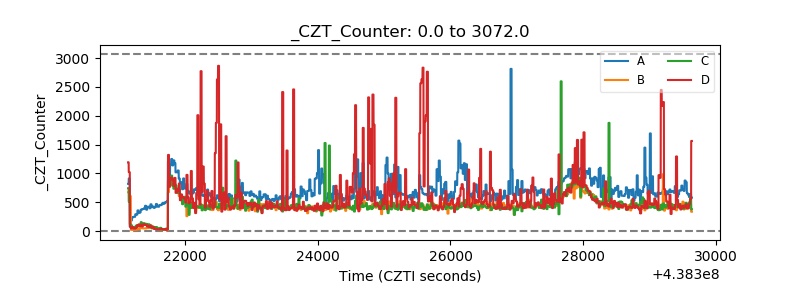 |
| +2.5 Volts monitor | 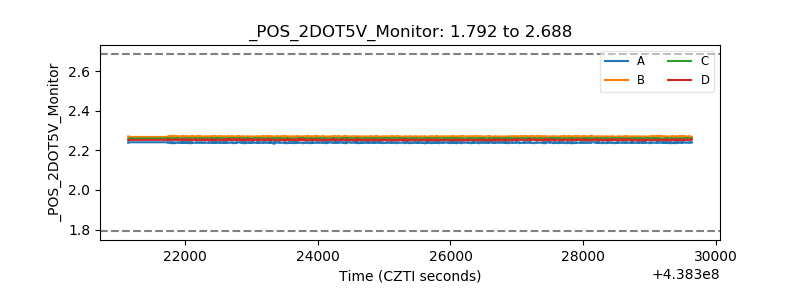 |
| +5 Volts monitor | 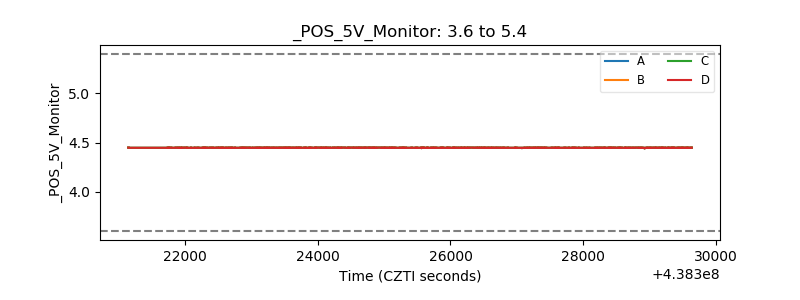 |
| _ROLL_ROT |  |
| _Roll_DEC | 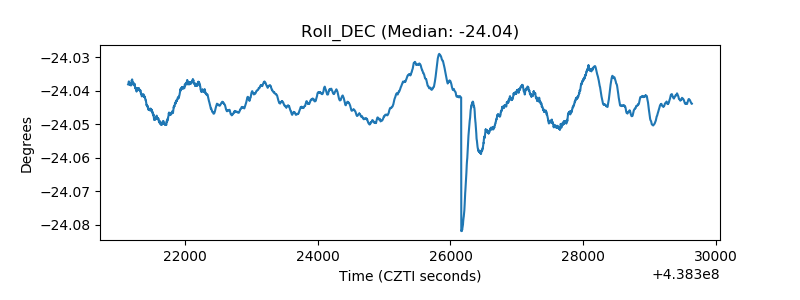 |
| _Roll_RA | 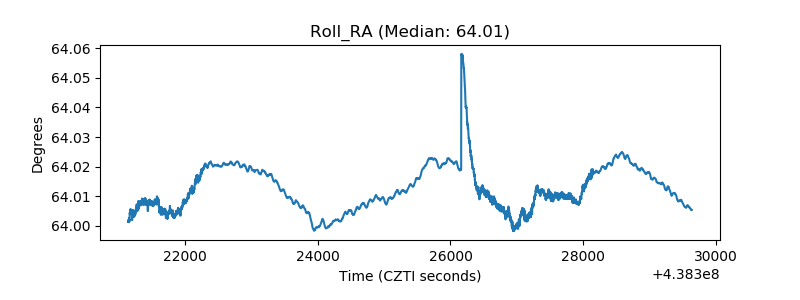 |
| Veto Counter | 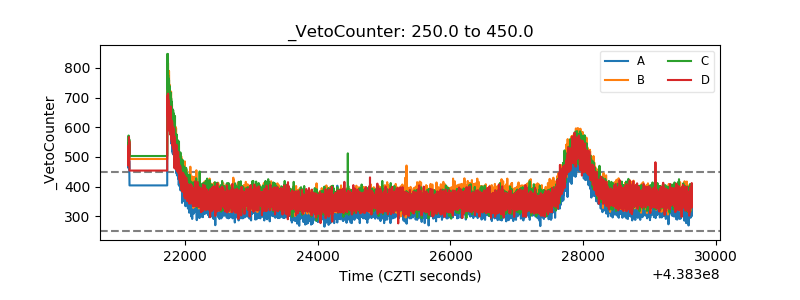 |