| Param | Original file | Final file |
|---|---|---|
| Filename | modeM0/AS1A13_029T01_9000005940_44073cztM0_level2.fits | modeM0/AS1A13_029T01_9000005940_44073cztM0_level2_quad_clean.evt |
| Size (bytes) | 489,994,560 | 125,400,960 |
| Size | 467.3 MB | 119.6 MB |
| Events in quadrant A | 5,861,991 | 835,166 |
| Events in quadrant B | 3,474,127 | 869,891 |
| Events in quadrant C | 3,655,484 | 813,147 |
| Events in quadrant D | 4,546,050 | 740,709 |
| Mode SS | |||
|---|---|---|---|
| Quadrant | BADHDUFLAG | Total packets | Discarded packets |
| A | 0 | 156 | 0 |
| B | 0 | 156 | 0 |
| C | 0 | 156 | 0 |
| D | 0 | 156 | 0 |
| Mode M0 | |||
|---|---|---|---|
| Quadrant | BADHDUFLAG | Total packets | Discarded packets |
| A | 0 | 23716 | 0 |
| B | 0 | 15875 | 0 |
| C | 0 | 16396 | 0 |
| D | 0 | 18820 | 0 |
| Quadrant | Total seconds | Saturated seconds | Saturation percentage |
|---|---|---|---|
| A | 7732 | 58 | 0.750129% |
| B | 7732 | 7 | 0.090533% |
| C | 7733 | 35 | 0.452606% |
| D | 7733 | 164 | 2.120781% |
Noise dominated data is calculated using 1-second bins in cleaned event files. If a bin has >2000 counts, and if more than 50% of those come from <1% of pixels, then it is considered to be noise-dominated and hence unusable.
| Quadrant | # 1 sec bins | Bins with >0 counts | Bins with >2000 counts | High rate bins dominated by noise | Noise dominated (total time) | Noise dominated (detector-on time) | Marked lightcurve |
|---|---|---|---|---|---|---|---|
| A | 7732 | 7732 | 27 | 27 | 0.35% | 0.35% | 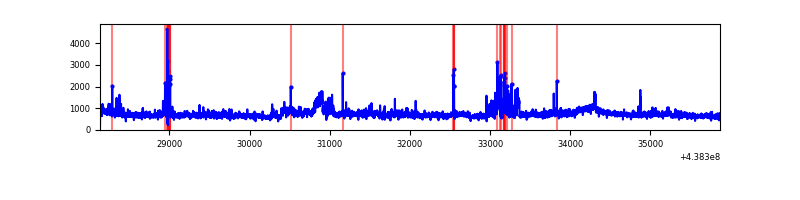 |
| B | 7732 | 7732 | 0 | 0 | 0.00% | 0.00% | 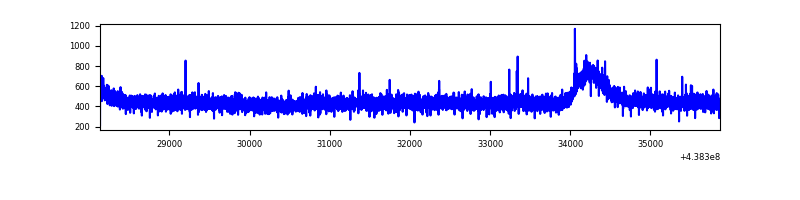 |
| C | 7733 | 7733 | 21 | 21 | 0.27% | 0.27% | 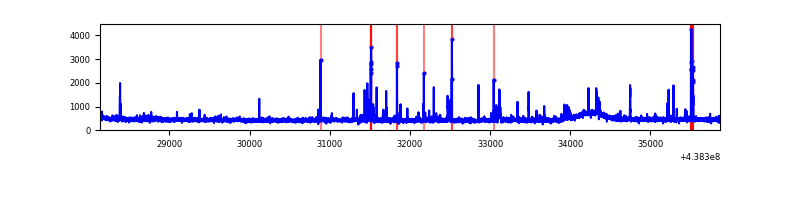 |
| D | 7733 | 7733 | 120 | 120 | 1.55% | 1.55% | 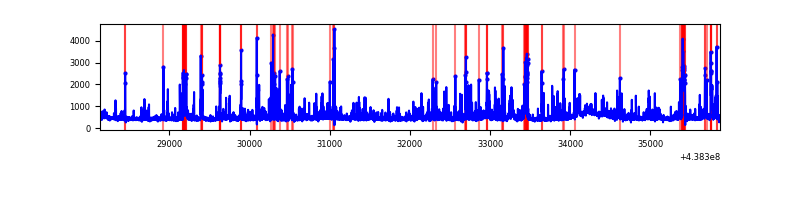 |
Top three noisy pixels from each quadrant. If the there are fewer than three noisy pixels in the level2.evt file, extra rows are filled as -1
| Pixel properties | Quadrant properties | ||||||
|---|---|---|---|---|---|---|---|
| Quadrant | DetID | PixID | Counts | Sigma | Mean | Median | Sigma |
| A | 10 | 83 | 1133714 | 6158.73 | 879 | 860 | 183.9 |
| A | 15 | 222 | 1023963 | 5562.07 | 879 | 860 | 183.9 |
| A | 15 | 223 | 192173 | 1040.07 | 879 | 860 | 183.9 |
| B | 12 | 111 | 23380 | 127.64 | 879 | 850 | 176.5 |
| B | 11 | 111 | 21148 | 114.99 | 879 | 850 | 176.5 |
| B | 14 | 111 | 21120 | 114.83 | 879 | 850 | 176.5 |
| C | 14 | 254 | 136859 | 660.6 | 868 | 872 | 205.9 |
| C | 4 | 254 | 44574 | 212.3 | 868 | 872 | 205.9 |
| C | 15 | 157 | 36493 | 173.04 | 868 | 872 | 205.9 |
| D | 13 | 249 | 363320 | 1683.03 | 857 | 831 | 215.4 |
| D | 5 | 235 | 293191 | 1357.42 | 857 | 831 | 215.4 |
| D | 1 | 52 | 276536 | 1280.09 | 857 | 831 | 215.4 |
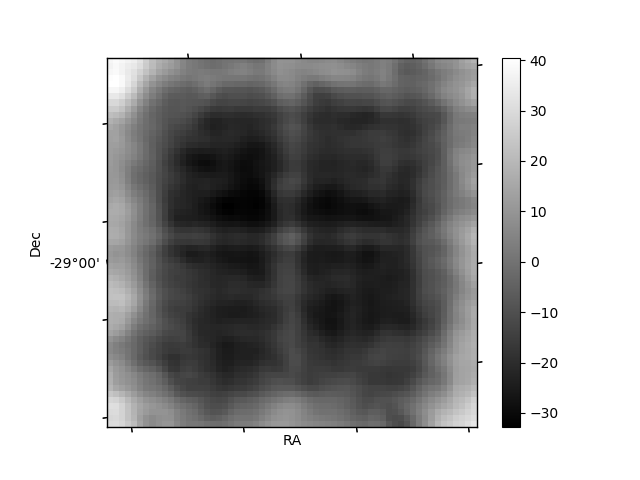
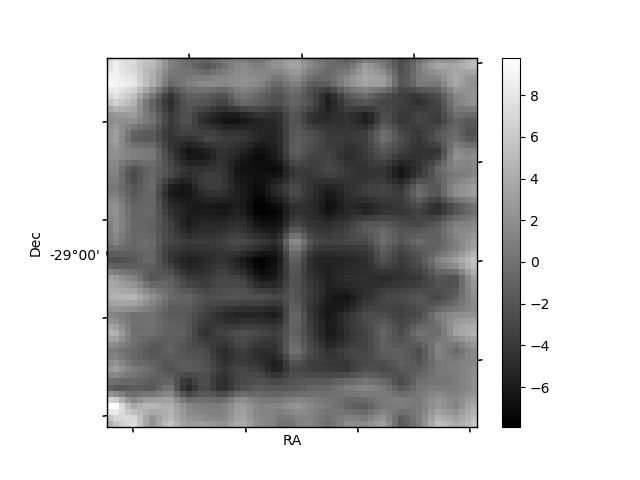
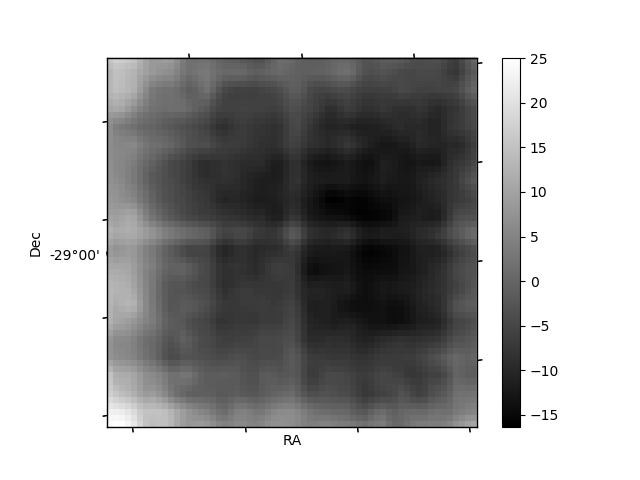
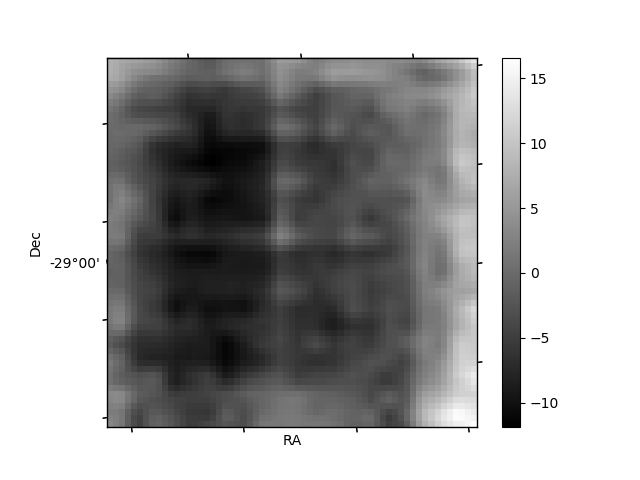
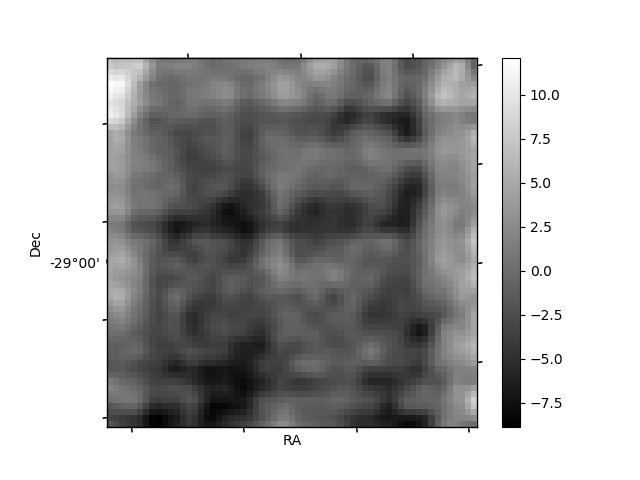
Histogram calculated using DETX and DETY for each event in the final _common_clean file
| Quadrant A | 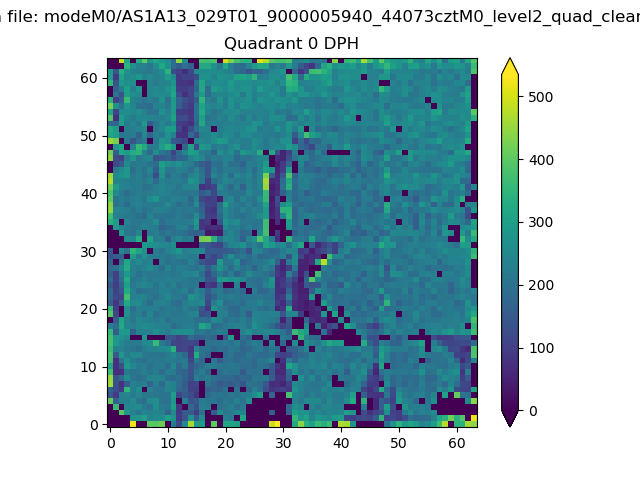 |
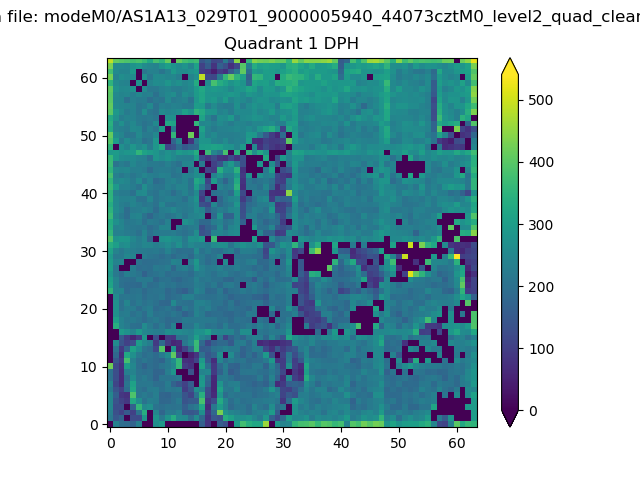 |
Quadrant B |
|---|---|---|---|
| Quadrant D | 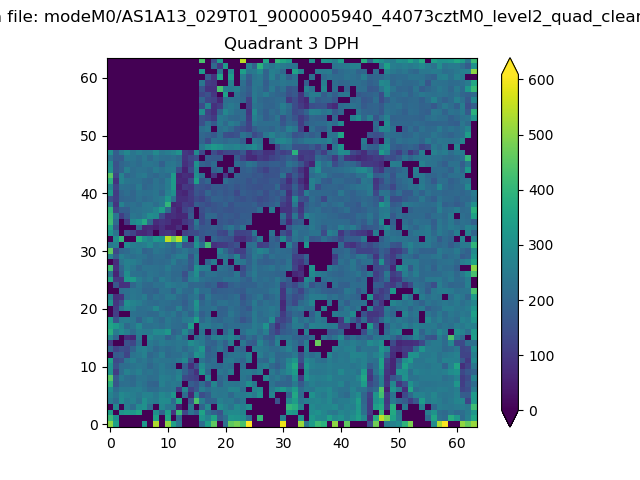 |
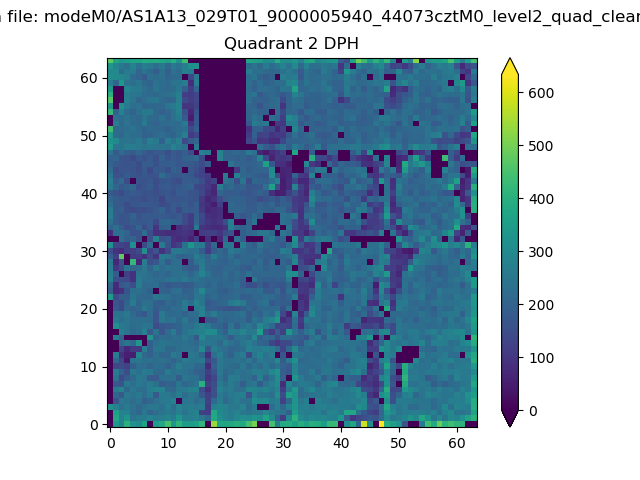 |
Quadrant C |
| Plot type | Count rate plots | Images |
|---|---|---|
| Comparison with Poisson distribution Blue bars denote a histogram of data divided into 1 sec bins. Red curve is a Poisson curve with rate = median count rate of data. |
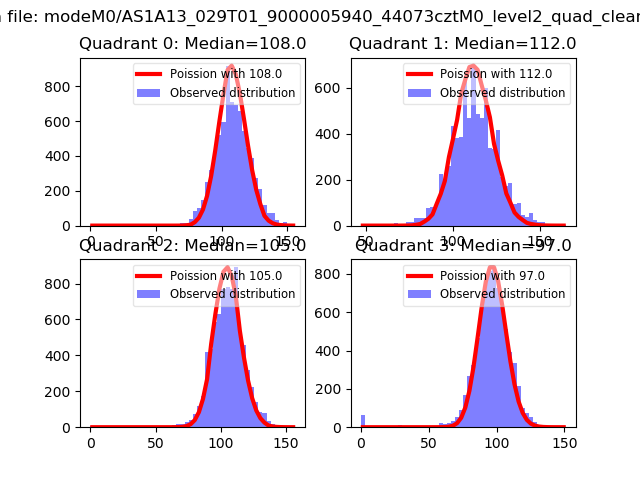 |
 |
| Quadrant-wise count rates Data is divided into 100 sec bins |
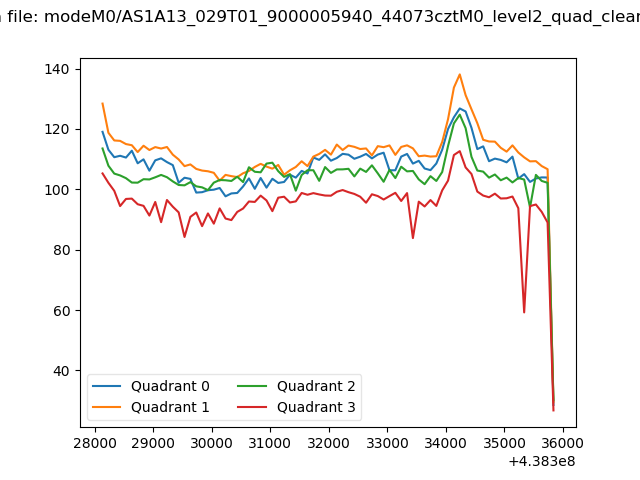 |
|
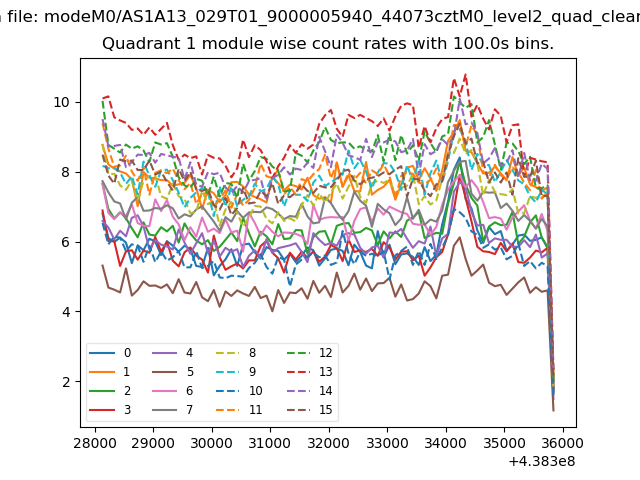
| Module-wise count rates for Quadrant A Data is divided into 100 sec bins |
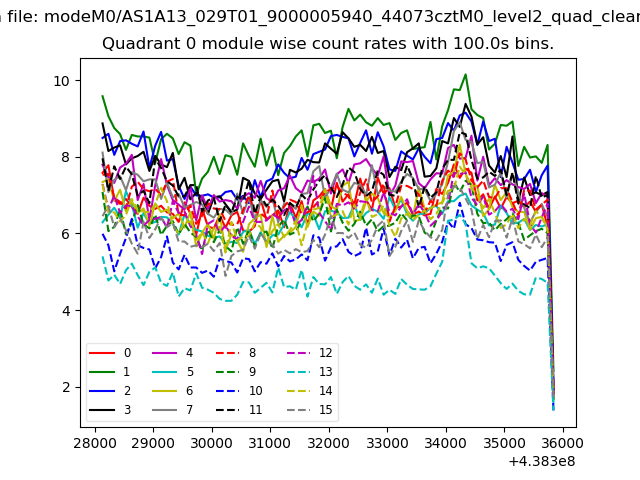 |
 |
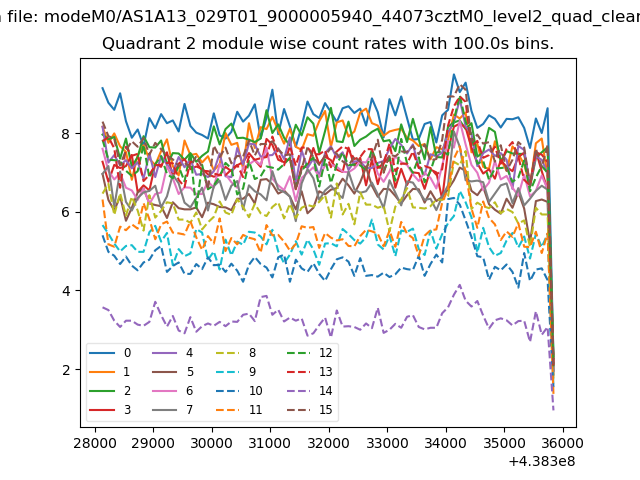
| Module-wise count rates for Quadrant B Data is divided into 100 sec bins |
 |
 |
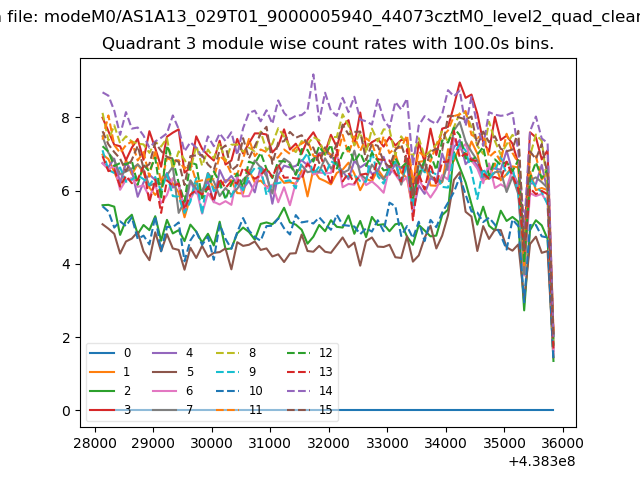
| Module-wise count rates for Quadrant C Data is divided into 100 sec bins |
 |
 |
| Module-wise count rates for Quadrant D Data is divided into 100 sec bins |
 |
 |
| Parameter | Plot |
|---|---|
| CZT HV Monitor | 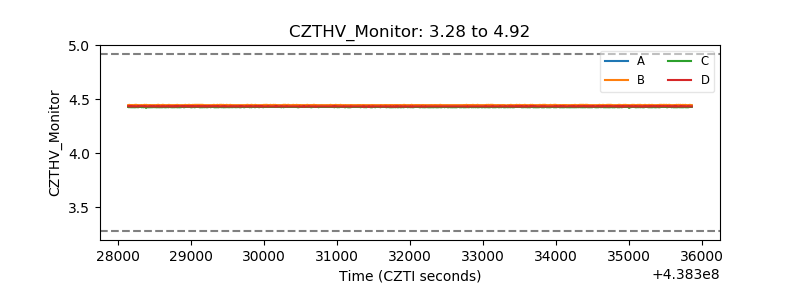 |
| D_VDD | 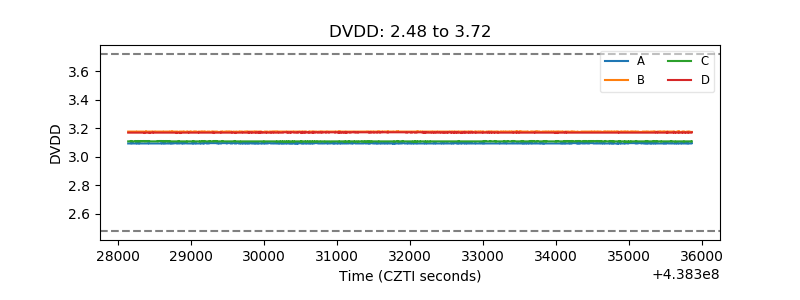 |
| Temperature 1 | 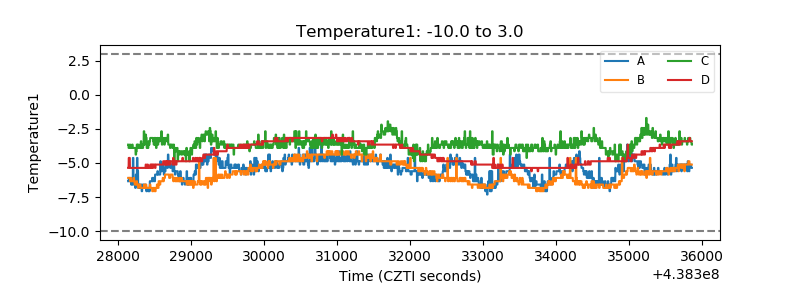 |
| Veto HV Monitor | 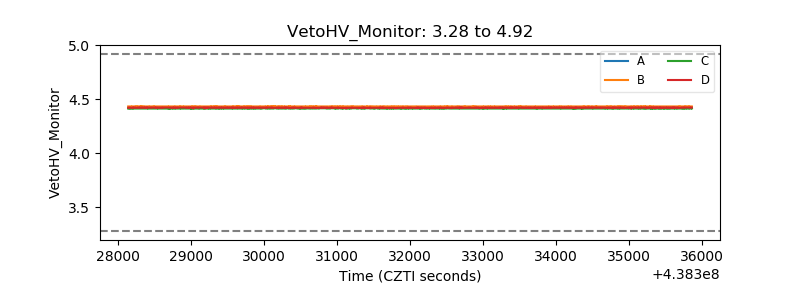 |
| Veto LLD | 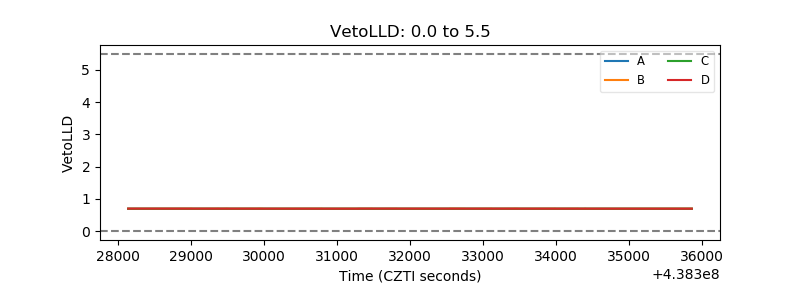 |
| Alpha Counter | 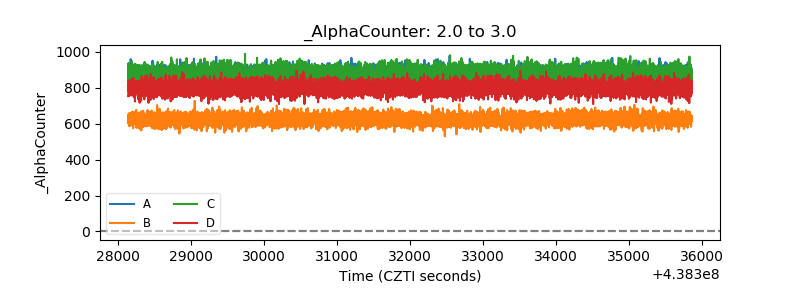 |
| _CPM_Rate | 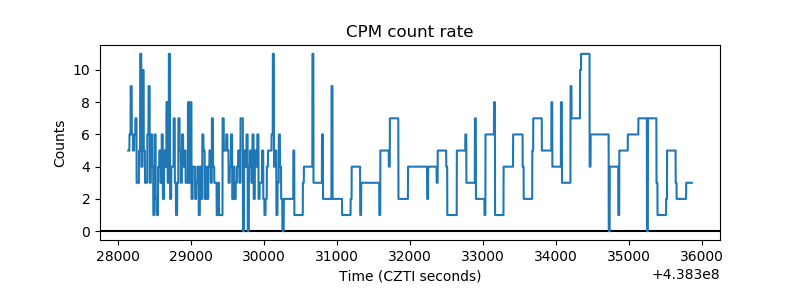 |
| CZT Counter | 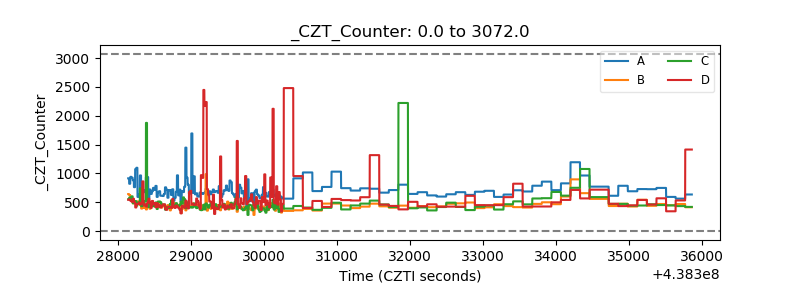 |
| +2.5 Volts monitor | 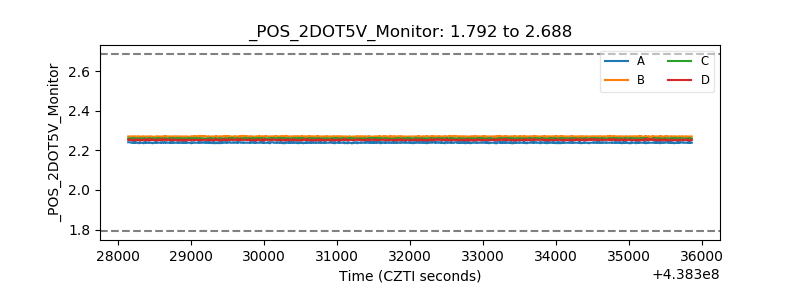 |
| +5 Volts monitor | 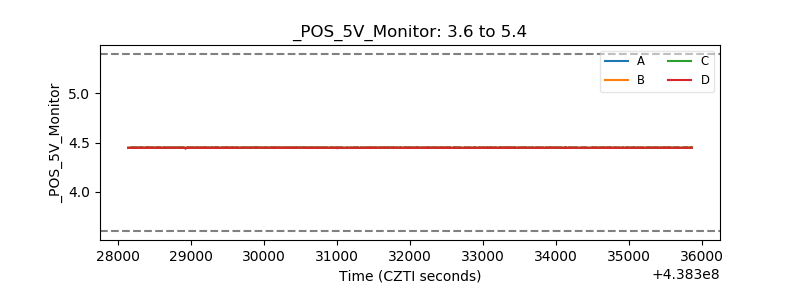 |
| _ROLL_ROT | 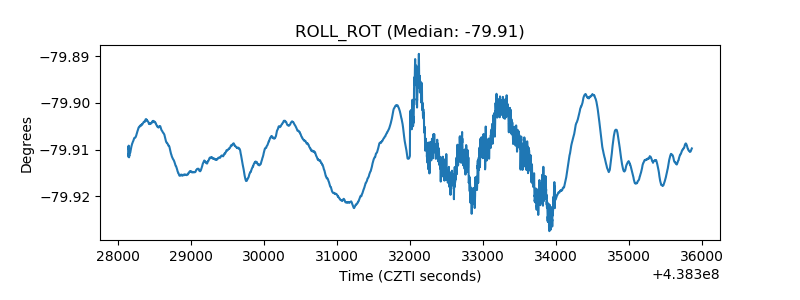 |
| _Roll_DEC | 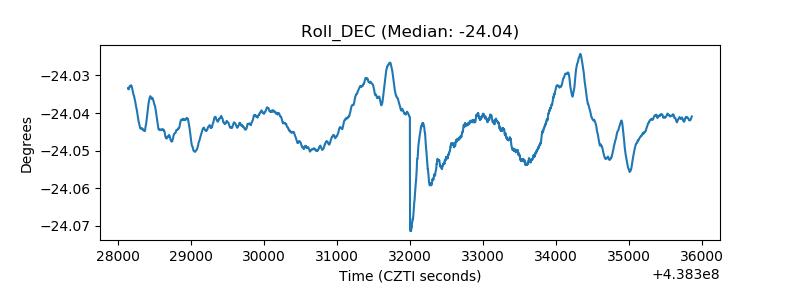 |
| _Roll_RA | 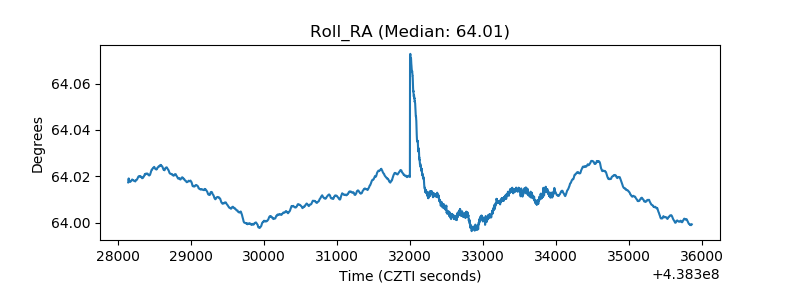 |
| Veto Counter | 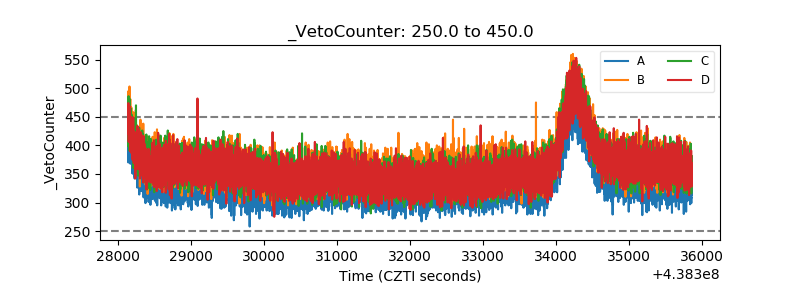 |