| Param | Original file | Final file |
|---|---|---|
| Filename | modeM0/AS1A13_029T01_9000005940_44074cztM0_level2.fits | modeM0/AS1A13_029T01_9000005940_44074cztM0_level2_quad_clean.evt |
| Size (bytes) | 586,451,520 | 143,421,120 |
| Size | 559.3 MB | 136.8 MB |
| Events in quadrant A | 6,195,932 | 956,673 |
| Events in quadrant B | 4,171,646 | 984,313 |
| Events in quadrant C | 4,489,682 | 941,662 |
| Events in quadrant D | 6,162,473 | 843,708 |
| Mode SS | |||
|---|---|---|---|
| Quadrant | BADHDUFLAG | Total packets | Discarded packets |
| A | 0 | 178 | 0 |
| B | 0 | 178 | 0 |
| C | 0 | 178 | 0 |
| D | 0 | 178 | 0 |
| Mode M0 | |||
|---|---|---|---|
| Quadrant | BADHDUFLAG | Total packets | Discarded packets |
| A | 0 | 25081 | 0 |
| B | 0 | 18694 | 1 |
| C | 0 | 19655 | 0 |
| D | 0 | 24489 | 0 |
| Quadrant | Total seconds | Saturated seconds | Saturation percentage |
|---|---|---|---|
| A | 8877 | 201 | 2.264278% |
| B | 8877 | 211 | 2.376929% |
| C | 8877 | 134 | 1.509519% |
| D | 8877 | 448 | 5.046750% |
Noise dominated data is calculated using 1-second bins in cleaned event files. If a bin has >2000 counts, and if more than 50% of those come from <1% of pixels, then it is considered to be noise-dominated and hence unusable.
| Quadrant | # 1 sec bins | Bins with >0 counts | Bins with >2000 counts | High rate bins dominated by noise | Noise dominated (total time) | Noise dominated (detector-on time) | Marked lightcurve |
|---|---|---|---|---|---|---|---|
| A | 8877 | 8877 | 10 | 10 | 0.11% | 0.11% | 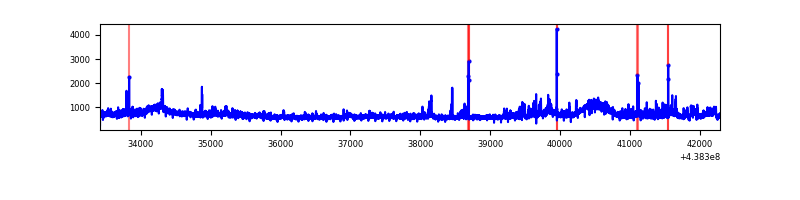 |
| B | 8877 | 8877 | 0 | 0 | 0.00% | 0.00% | 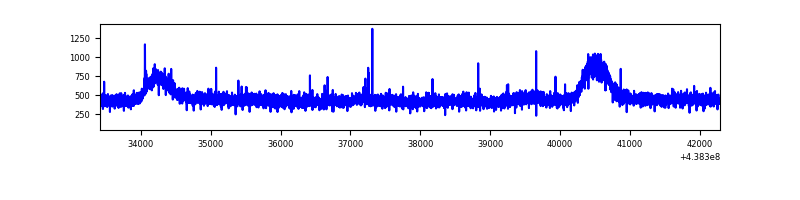 |
| C | 8877 | 8877 | 41 | 41 | 0.46% | 0.46% | 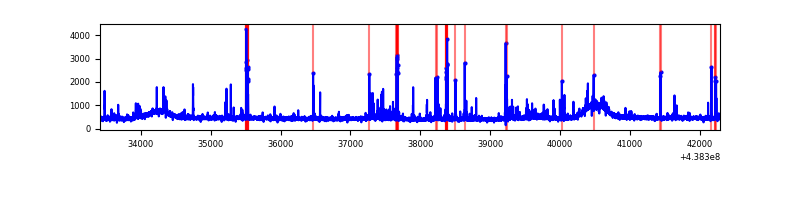 |
| D | 8877 | 8877 | 322 | 322 | 3.63% | 3.63% | 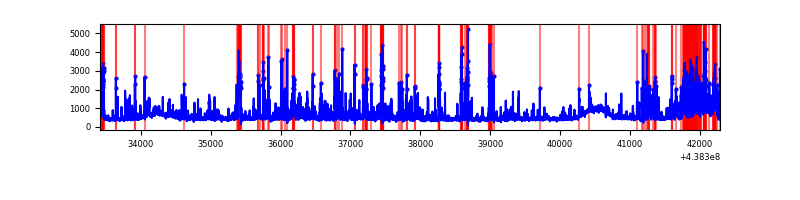 |
Top three noisy pixels from each quadrant. If the there are fewer than three noisy pixels in the level2.evt file, extra rows are filled as -1
| Pixel properties | Quadrant properties | ||||||
|---|---|---|---|---|---|---|---|
| Quadrant | DetID | PixID | Counts | Sigma | Mean | Median | Sigma |
| A | 10 | 83 | 1310590 | 5890.06 | 1055 | 1031 | 222.3 |
| A | 15 | 222 | 736537 | 3308.12 | 1055 | 1031 | 222.3 |
| A | 10 | 248 | 45618 | 200.54 | 1055 | 1031 | 222.3 |
| B | 12 | 111 | 28081 | 128.52 | 1052 | 1016 | 210.6 |
| B | 14 | 111 | 25896 | 118.14 | 1052 | 1016 | 210.6 |
| B | 11 | 111 | 25811 | 117.74 | 1052 | 1016 | 210.6 |
| C | 14 | 254 | 138459 | 551.53 | 1042 | 1049 | 249.1 |
| C | 15 | 158 | 129130 | 514.09 | 1042 | 1049 | 249.1 |
| C | 15 | 157 | 74306 | 294.04 | 1042 | 1049 | 249.1 |
| D | 1 | 52 | 1017354 | 3931.93 | 1024 | 991 | 258.5 |
| D | 13 | 249 | 560797 | 2165.68 | 1024 | 991 | 258.5 |
| D | 5 | 235 | 373104 | 1439.57 | 1024 | 991 | 258.5 |
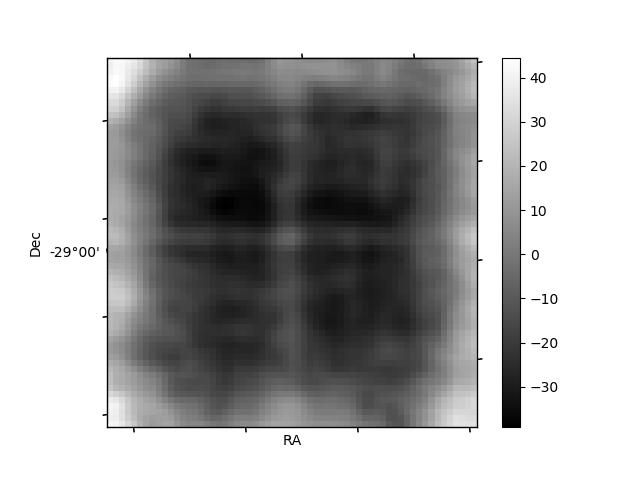
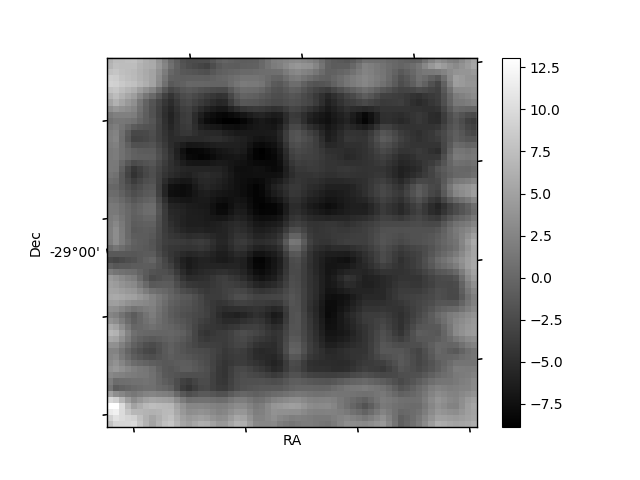
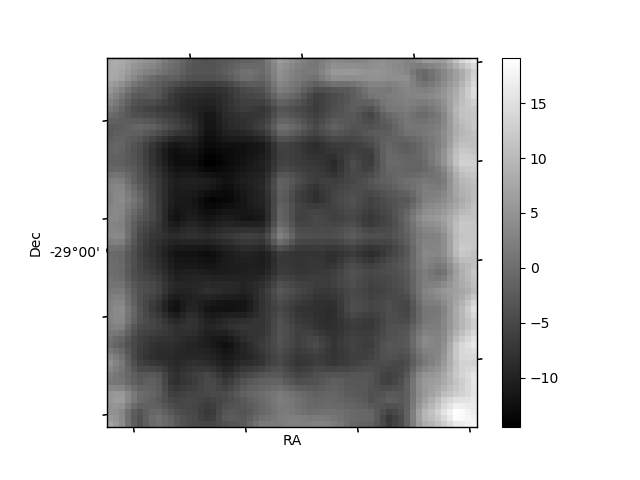
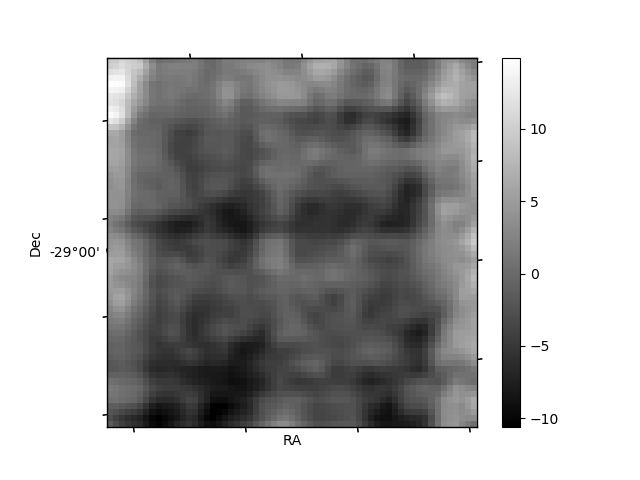
Histogram calculated using DETX and DETY for each event in the final _common_clean file
| Quadrant A | 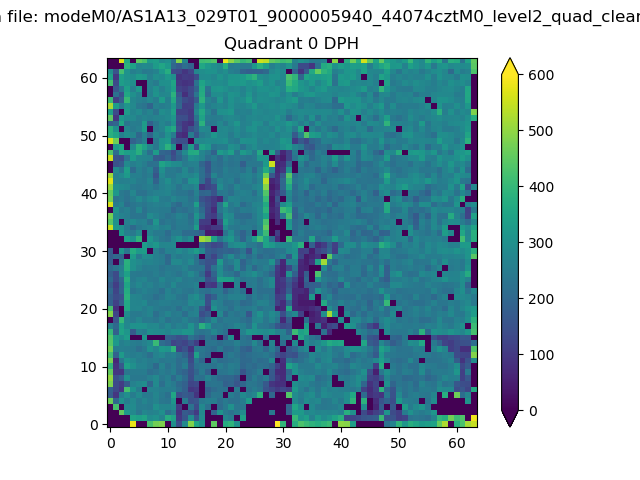 |
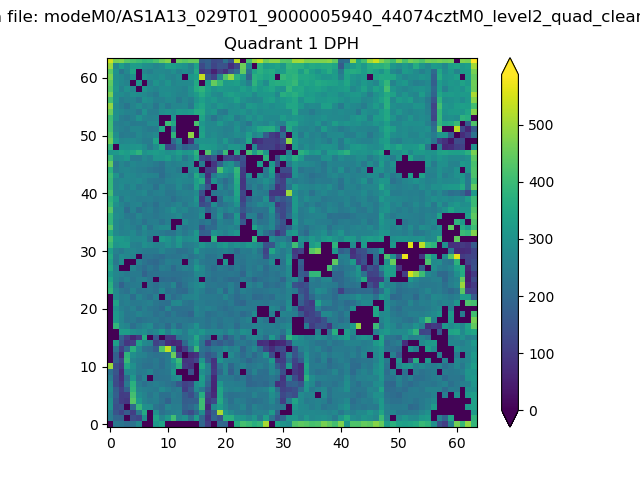 |
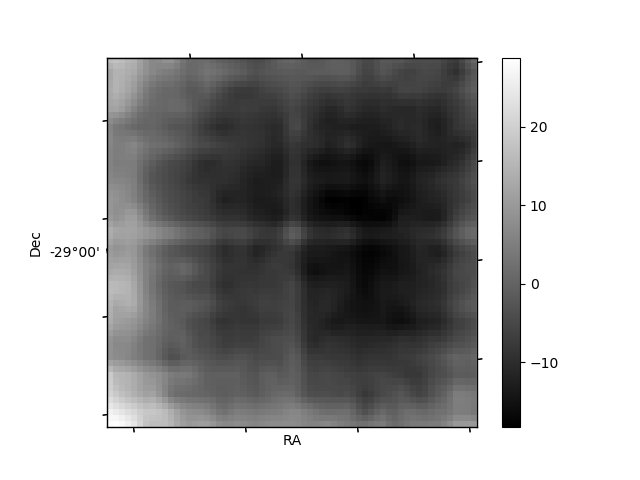
Quadrant B |
|---|---|---|---|
| Quadrant D | 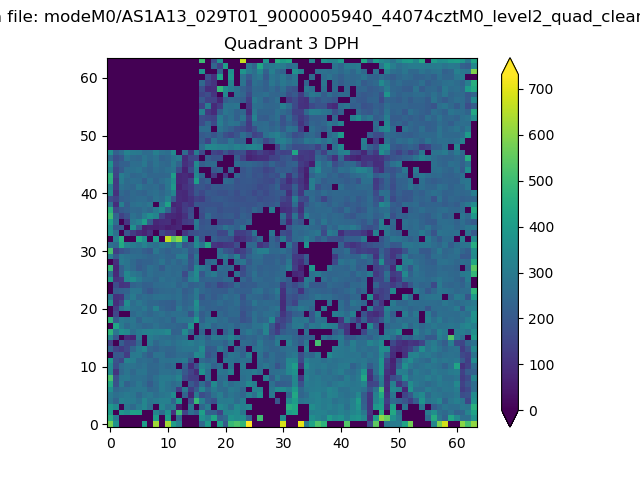 |
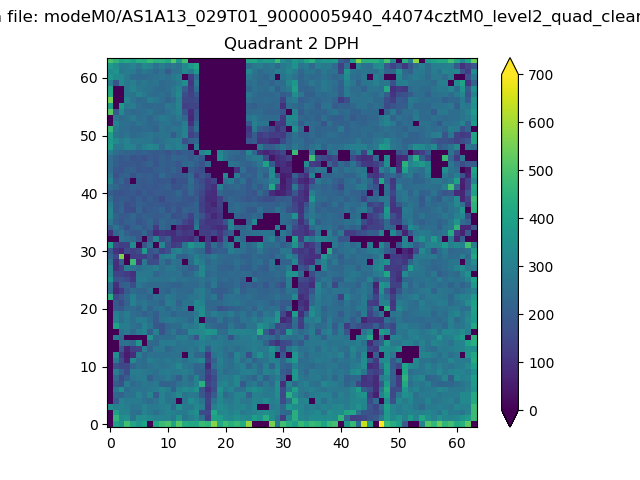 |
Quadrant C |
| Plot type | Count rate plots | Images |
|---|---|---|
| Comparison with Poisson distribution Blue bars denote a histogram of data divided into 1 sec bins. Red curve is a Poisson curve with rate = median count rate of data. |
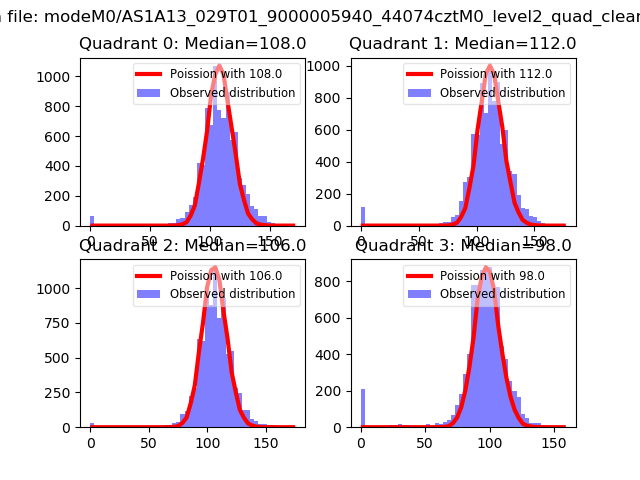 |
 |
| Quadrant-wise count rates Data is divided into 100 sec bins |
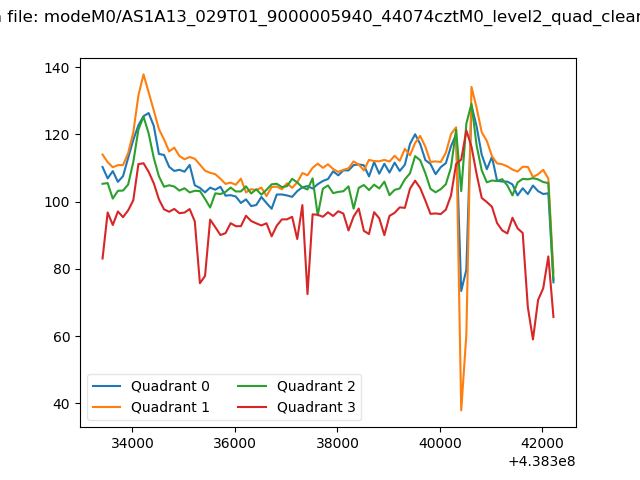 |
|
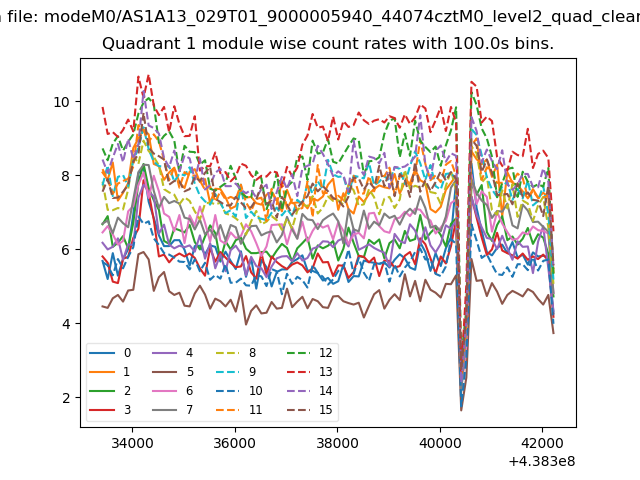
| Module-wise count rates for Quadrant A Data is divided into 100 sec bins |
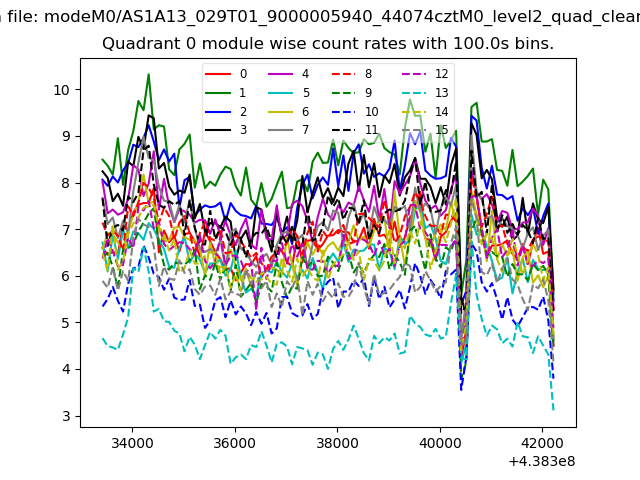 |
 |
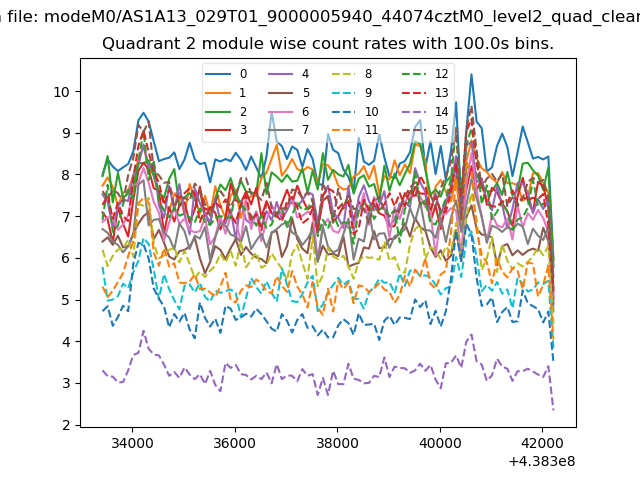
| Module-wise count rates for Quadrant B Data is divided into 100 sec bins |
 |
 |
| Module-wise count rates for Quadrant C Data is divided into 100 sec bins |
 |
 |
| Module-wise count rates for Quadrant D Data is divided into 100 sec bins |
 |
 |
| Parameter | Plot |
|---|---|
| CZT HV Monitor | 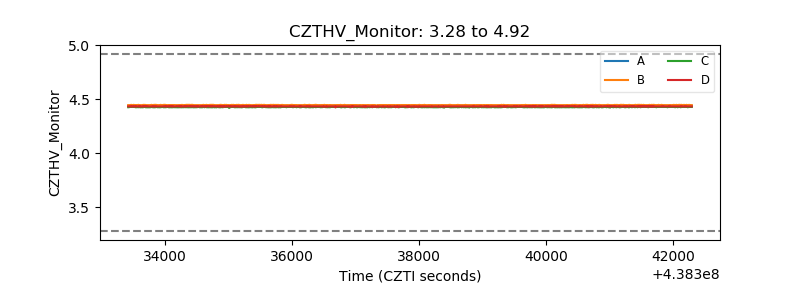 |
| D_VDD | 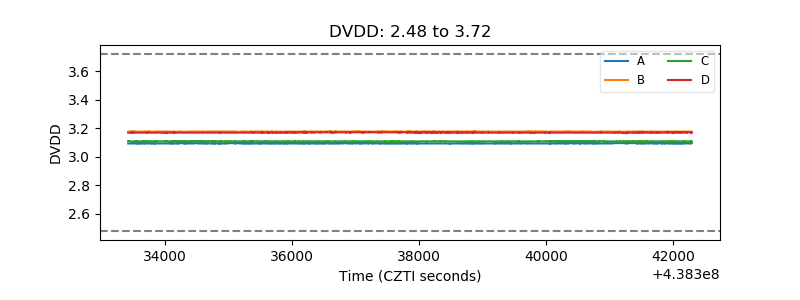 |
| Temperature 1 | 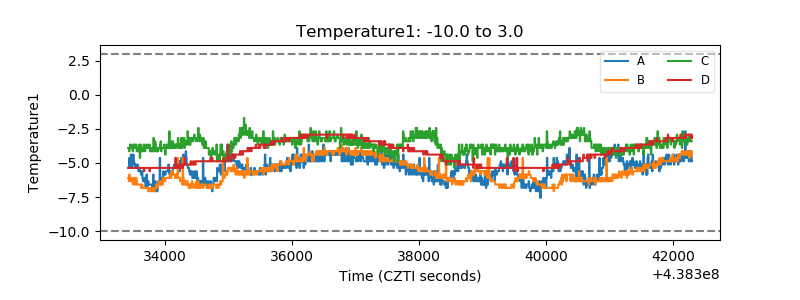 |
| Veto HV Monitor | 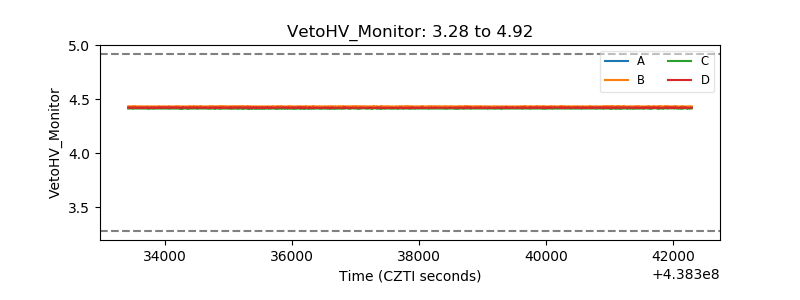 |
| Veto LLD | 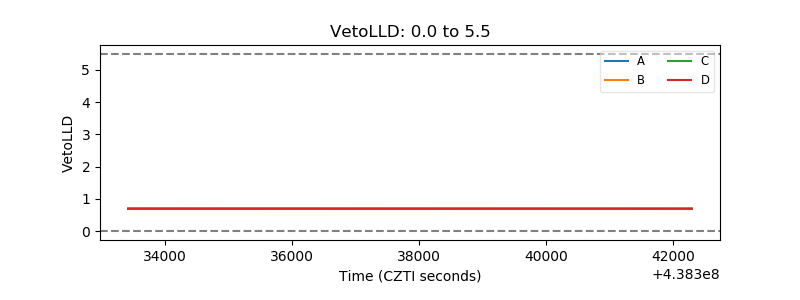 |
| Alpha Counter | 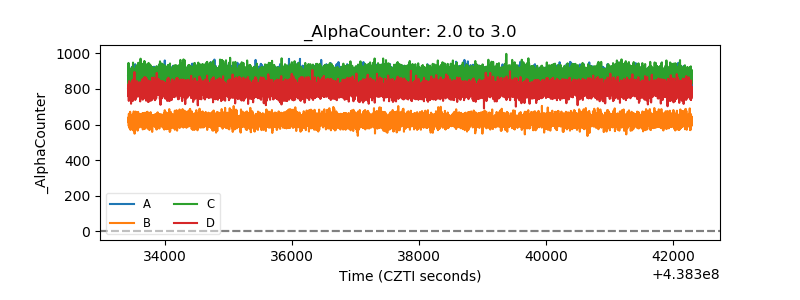 |
| _CPM_Rate | 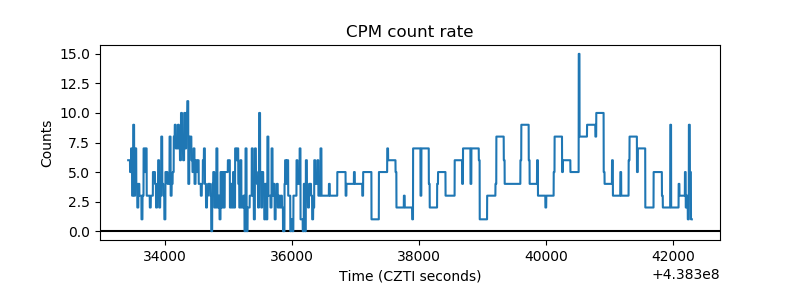 |
| CZT Counter | 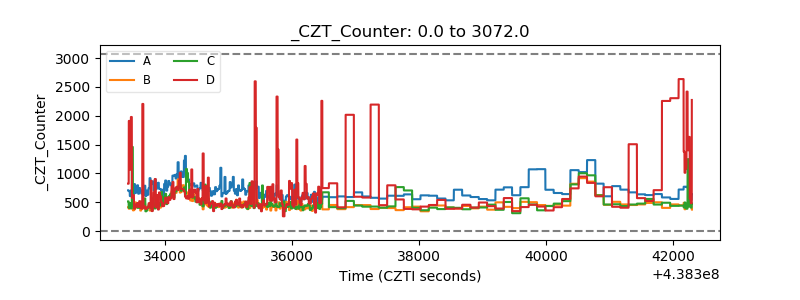 |
| +2.5 Volts monitor | 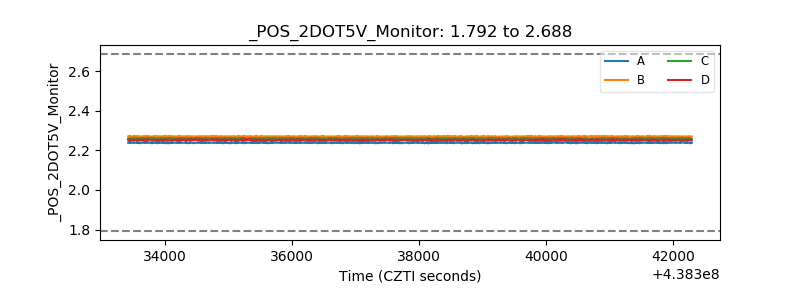 |
| +5 Volts monitor | 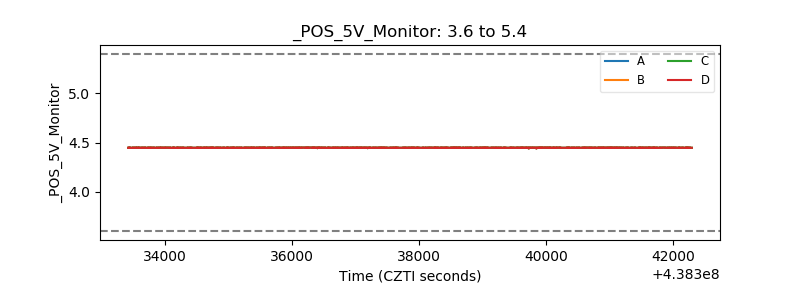 |
| _ROLL_ROT | 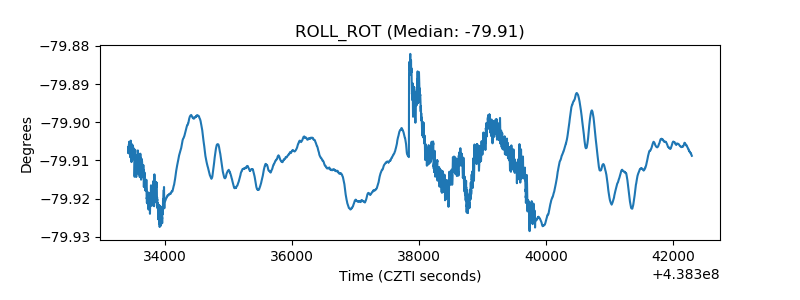 |
| _Roll_DEC | 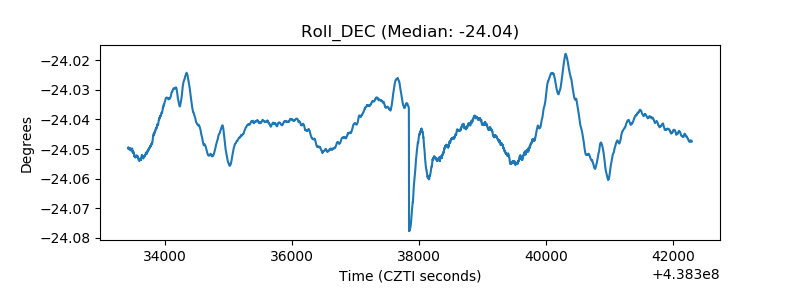 |
| _Roll_RA | 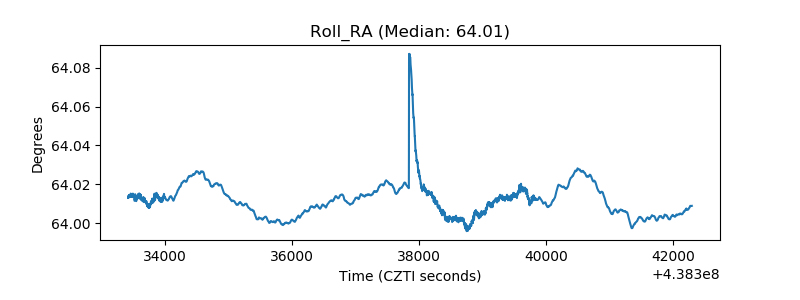 |
| Veto Counter | 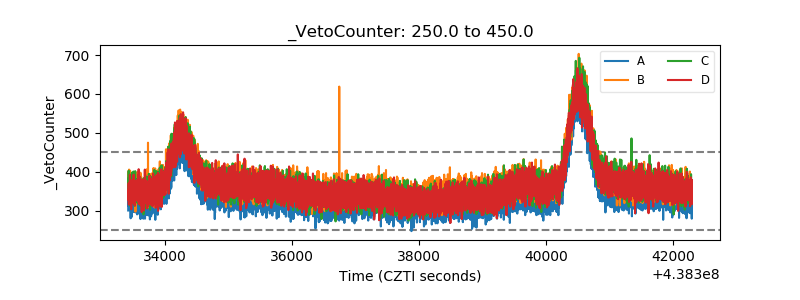 |