| Param | Original file | Final file |
|---|---|---|
| Filename | modeM0/AS1A13_029T01_9000005940_44076cztM0_level2.fits | modeM0/AS1A13_029T01_9000005940_44076cztM0_level2_quad_clean.evt |
| Size (bytes) | 73,304,640 | 15,177,600 |
| Size | 69.9 MB | 14.5 MB |
| Events in quadrant A | 771,403 | 97,226 |
| Events in quadrant B | 588,748 | 94,850 |
| Events in quadrant C | 625,499 | 101,587 |
| Events in quadrant D | 655,151 | 96,513 |
| Mode SS | |||
|---|---|---|---|
| Quadrant | BADHDUFLAG | Total packets | Discarded packets |
| A | 0 | 18 | 0 |
| B | 0 | 18 | 0 |
| C | 0 | 18 | 0 |
| D | 0 | 18 | 0 |
| Mode M0 | |||
|---|---|---|---|
| Quadrant | BADHDUFLAG | Total packets | Discarded packets |
| A | 0 | 2991 | 6 |
| B | 0 | 2321 | 0 |
| C | 0 | 2472 | 0 |
| D | 0 | 2568 | 0 |
| Quadrant | Total seconds | Saturated seconds | Saturation percentage |
|---|---|---|---|
| A | 891 | 162 | 18.181818% |
| B | 892 | 199 | 22.309417% |
| C | 892 | 88 | 9.865471% |
| D | 892 | 54 | 6.053812% |
Noise dominated data is calculated using 1-second bins in cleaned event files. If a bin has >2000 counts, and if more than 50% of those come from <1% of pixels, then it is considered to be noise-dominated and hence unusable.
| Quadrant | # 1 sec bins | Bins with >0 counts | Bins with >2000 counts | High rate bins dominated by noise | Noise dominated (total time) | Noise dominated (detector-on time) | Marked lightcurve |
|---|---|---|---|---|---|---|---|
| A | 891 | 891 | 0 | 0 | 0.00% | 0.00% | 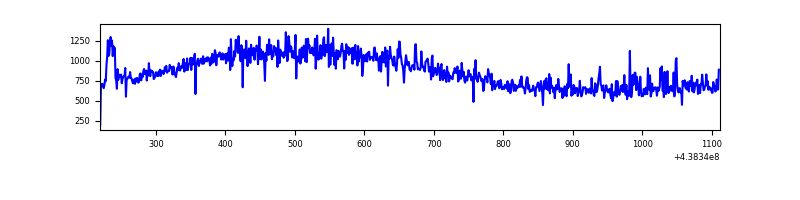 |
| B | 892 | 892 | 0 | 0 | 0.00% | 0.00% | 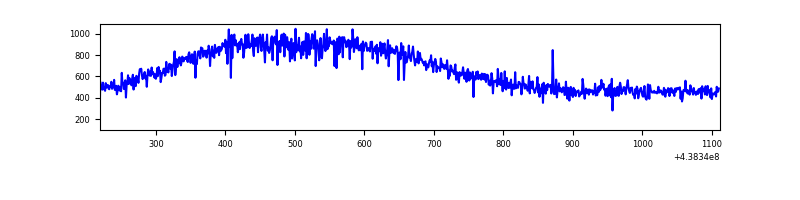 |
| C | 892 | 892 | 1 | 1 | 0.11% | 0.11% | 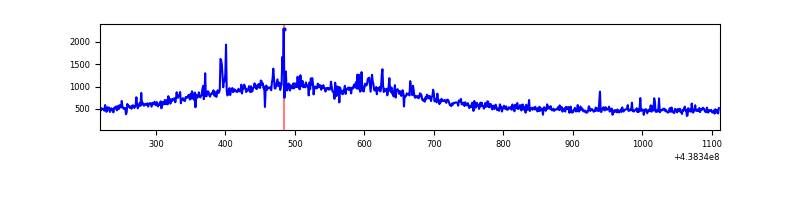 |
| D | 892 | 892 | 3 | 3 | 0.34% | 0.34% |  |
Top three noisy pixels from each quadrant. If the there are fewer than three noisy pixels in the level2.evt file, extra rows are filled as -1
| Pixel properties | Quadrant properties | ||||||
|---|---|---|---|---|---|---|---|
| Quadrant | DetID | PixID | Counts | Sigma | Mean | Median | Sigma |
| A | 10 | 83 | 131526 | 3770.97 | 150 | 146 | 34.8 |
| A | 15 | 222 | 53545 | 1532.7 | 150 | 146 | 34.8 |
| A | 12 | 227 | 3409 | 93.66 | 150 | 146 | 34.8 |
| B | 12 | 111 | 4418 | 125.16 | 148 | 143 | 34.2 |
| B | 14 | 111 | 4086 | 115.44 | 148 | 143 | 34.2 |
| B | 11 | 111 | 3968 | 111.99 | 148 | 143 | 34.2 |
| C | 14 | 254 | 17538 | 439.56 | 150 | 150 | 39.6 |
| C | 11 | 16 | 15042 | 376.47 | 150 | 150 | 39.6 |
| C | 4 | 254 | 2447 | 58.07 | 150 | 150 | 39.6 |
| D | 13 | 249 | 38698 | 922.5 | 152 | 146 | 41.8 |
| D | 2 | 153 | 19846 | 471.4 | 152 | 146 | 41.8 |
| D | 1 | 52 | 13932 | 329.88 | 152 | 146 | 41.8 |
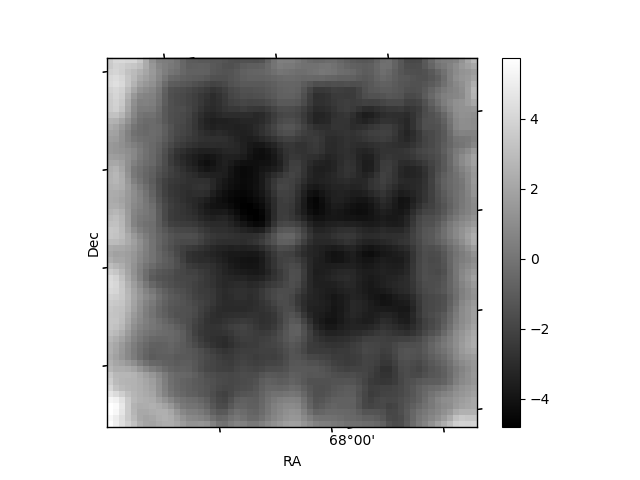
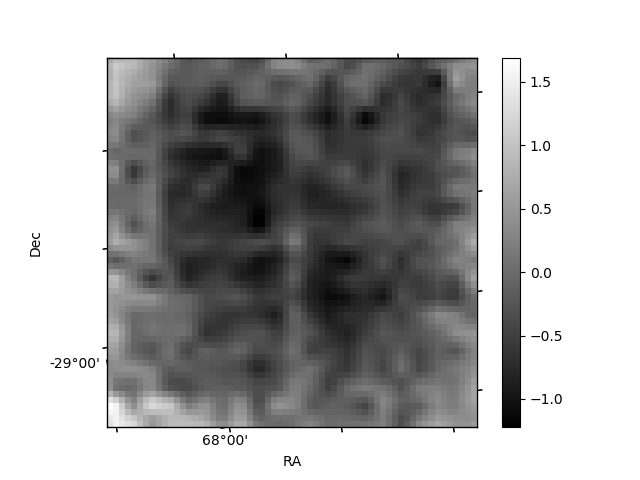
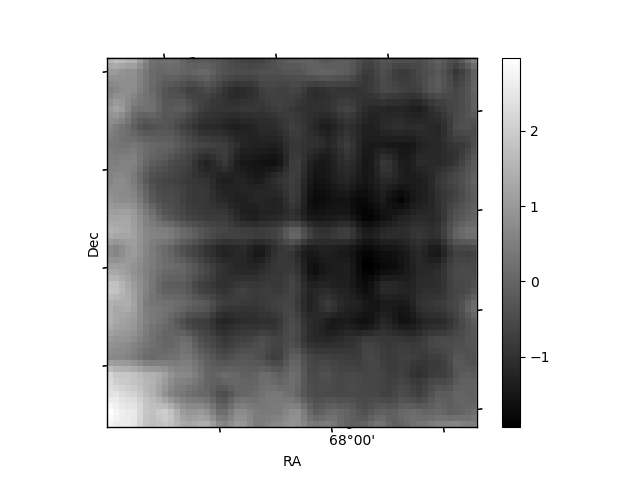
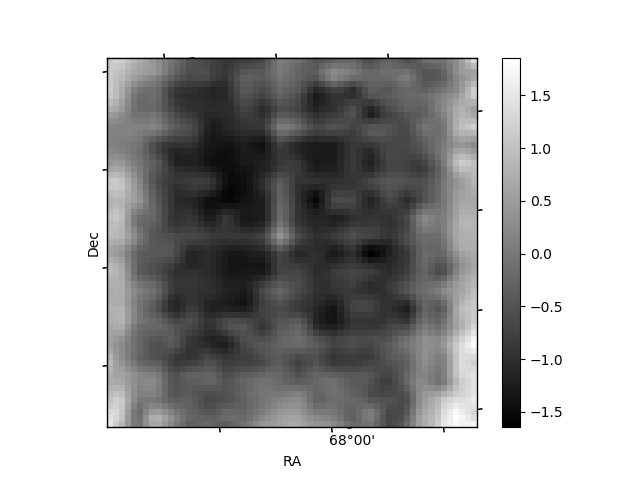
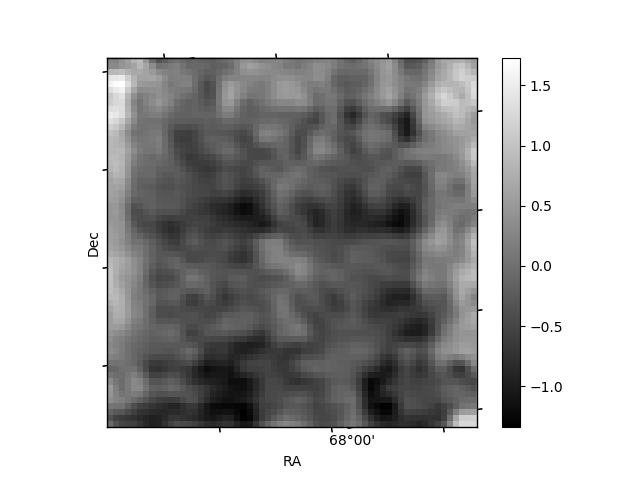
Histogram calculated using DETX and DETY for each event in the final _common_clean file
| Quadrant A | 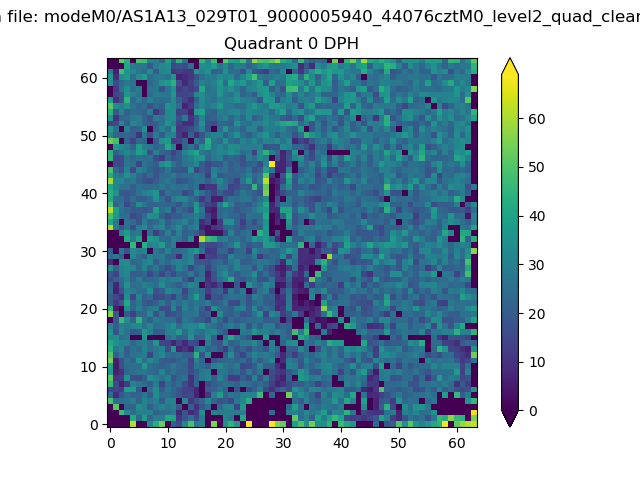 |
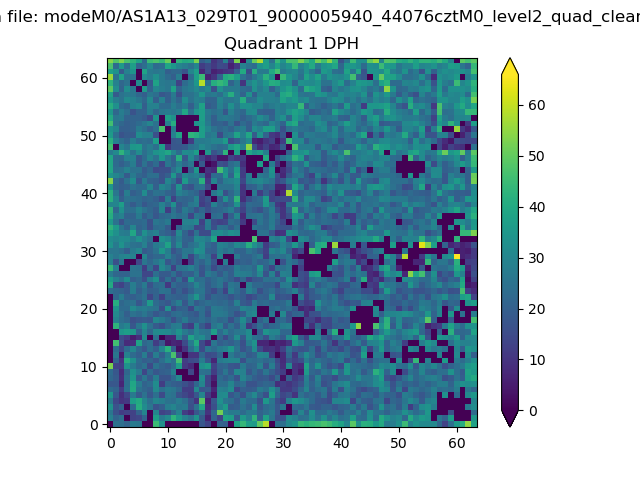 |
Quadrant B |
|---|---|---|---|
| Quadrant D | 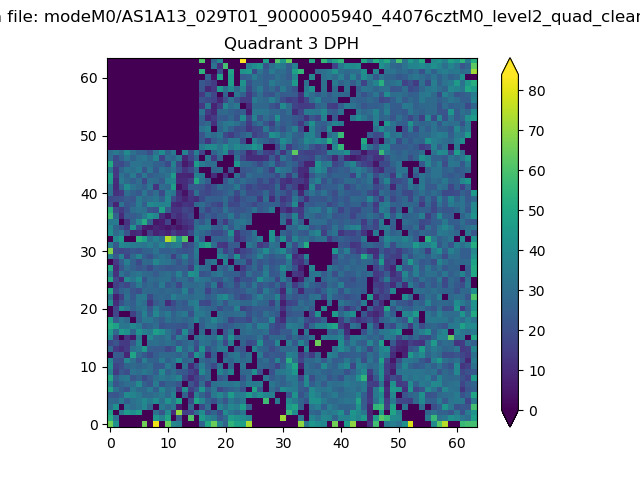 |
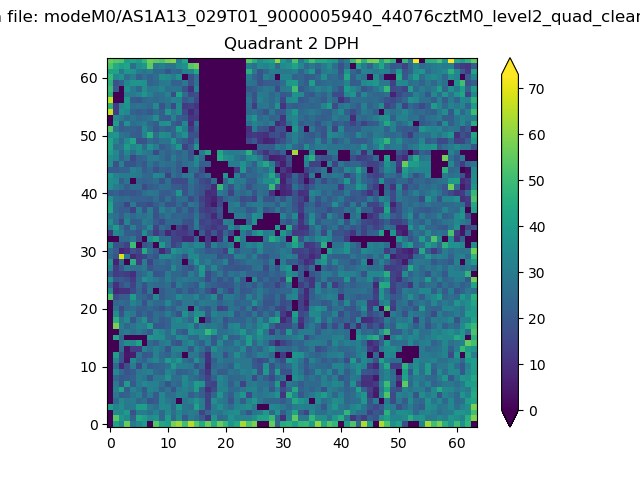 |
Quadrant C |
| Plot type | Count rate plots | Images |
|---|---|---|
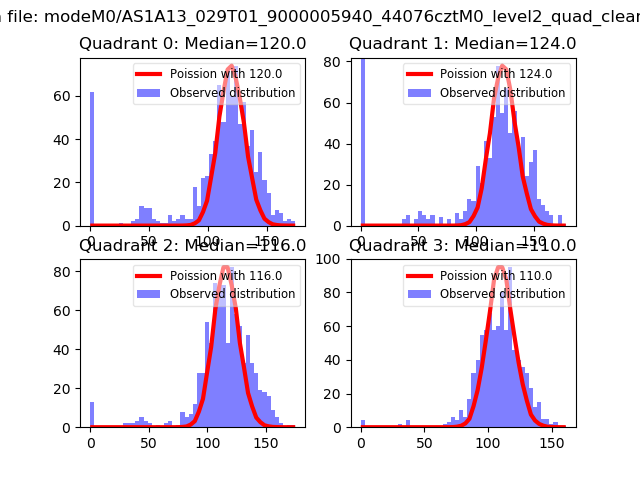
| Comparison with Poisson distribution Blue bars denote a histogram of data divided into 1 sec bins. Red curve is a Poisson curve with rate = median count rate of data. |
 |
 |
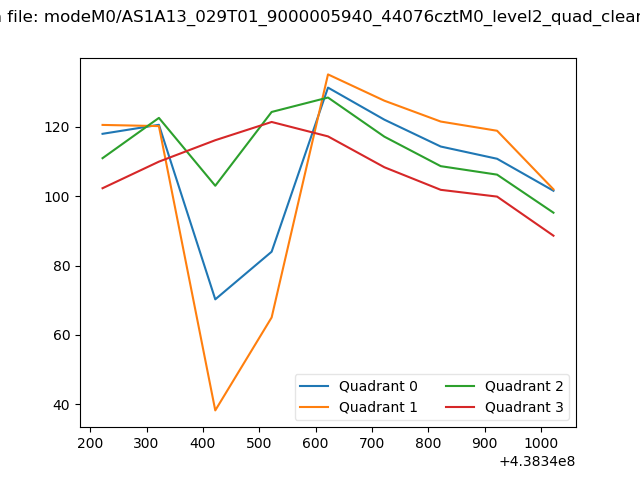
| Quadrant-wise count rates Data is divided into 100 sec bins |
 |
|
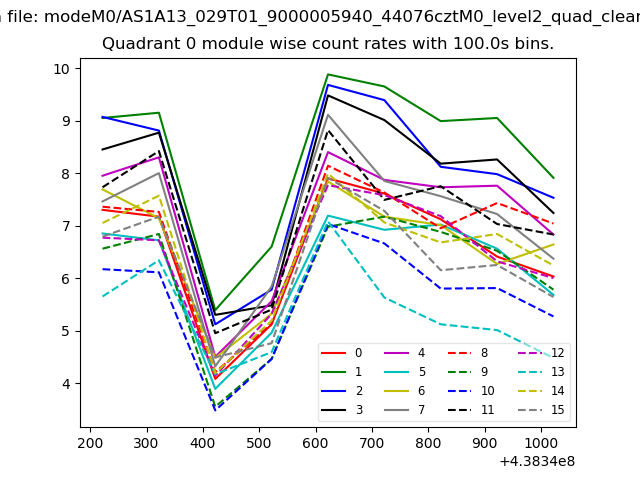
| Module-wise count rates for Quadrant A Data is divided into 100 sec bins |
 |
 |
| Module-wise count rates for Quadrant B Data is divided into 100 sec bins |
 |
 |
| Module-wise count rates for Quadrant C Data is divided into 100 sec bins |
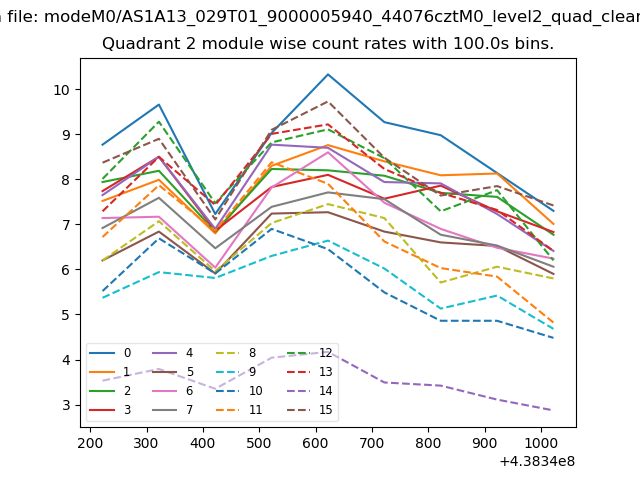 |
 |
| Module-wise count rates for Quadrant D Data is divided into 100 sec bins |
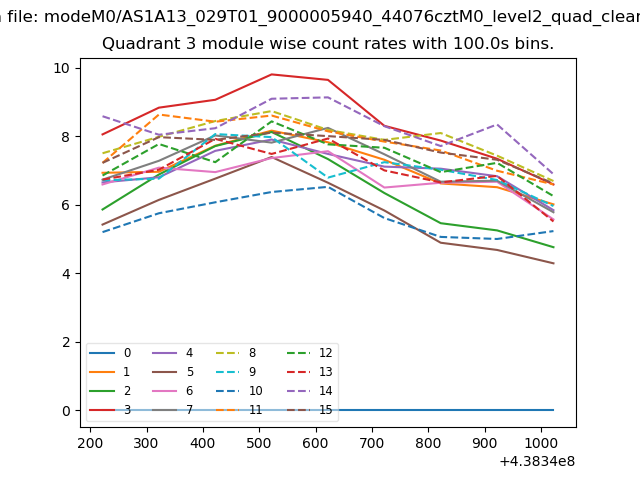 |
 |
| Parameter | Plot |
|---|---|
| CZT HV Monitor |  |
| D_VDD | 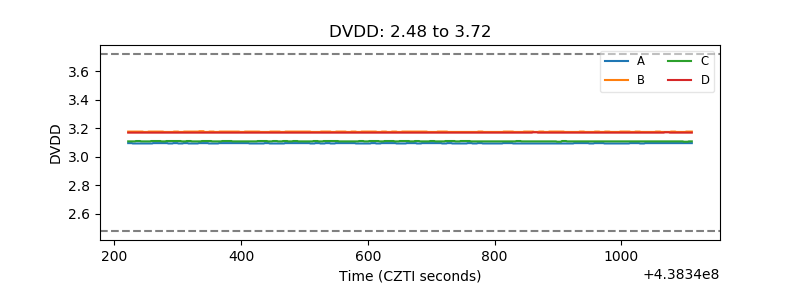 |
| Temperature 1 | 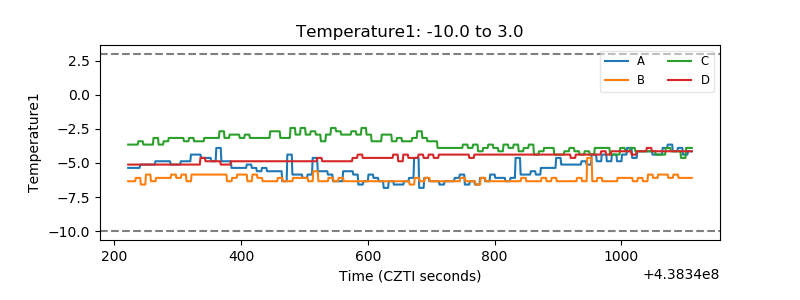 |
| Veto HV Monitor | 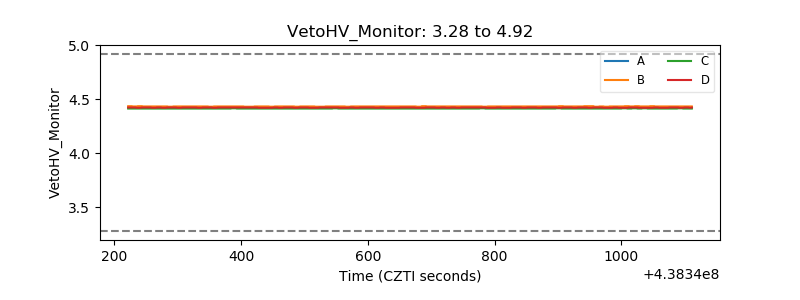 |
| Veto LLD | 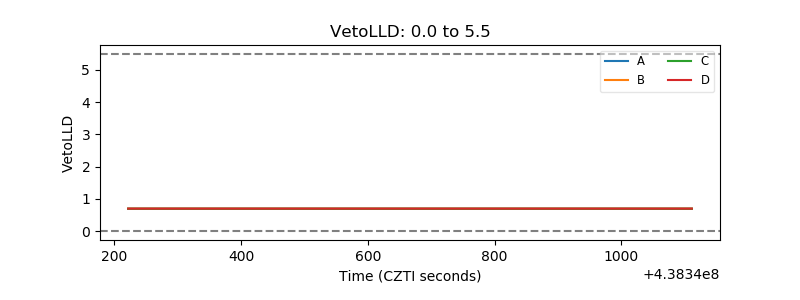 |
| Alpha Counter | 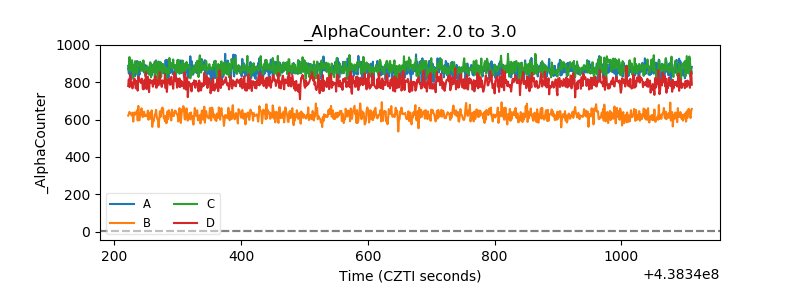 |
| _CPM_Rate | 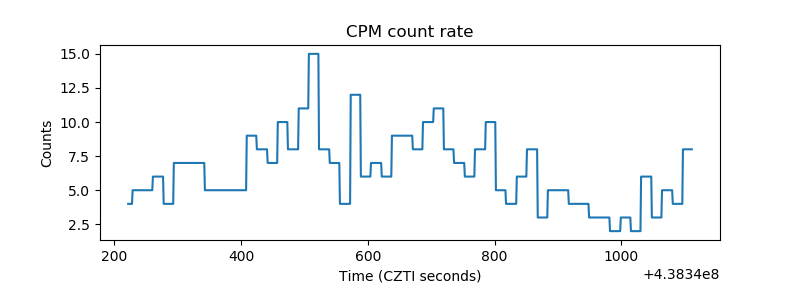 |
| CZT Counter | 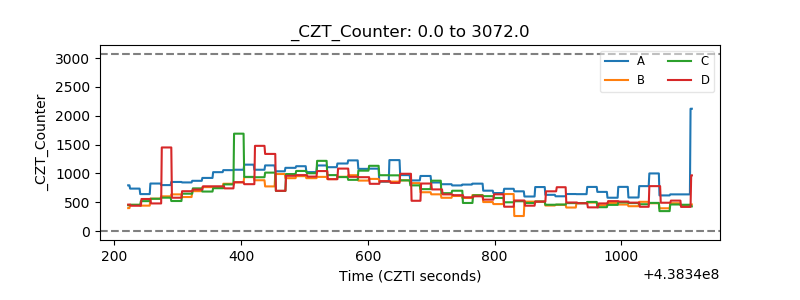 |
| +2.5 Volts monitor | 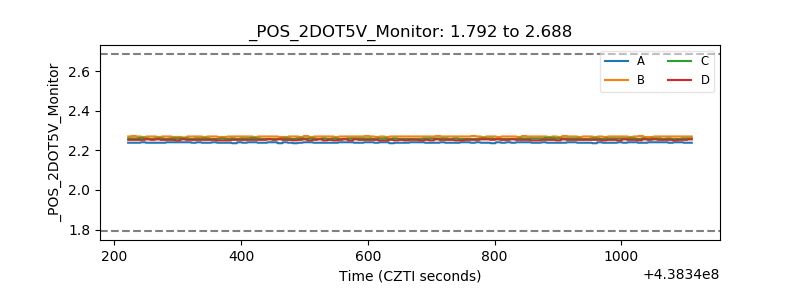 |
| +5 Volts monitor | 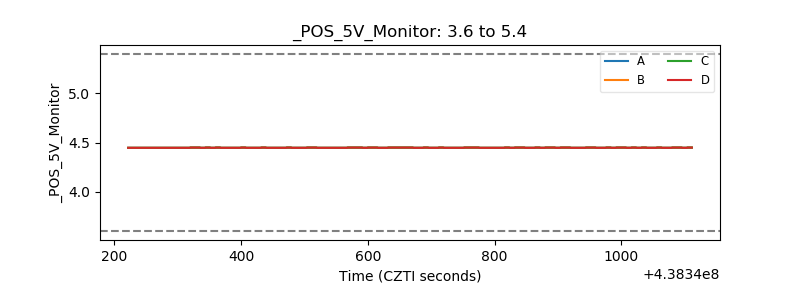 |
| _ROLL_ROT | 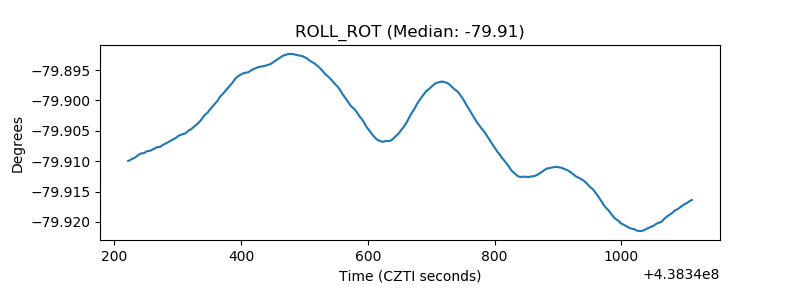 |
| _Roll_DEC | 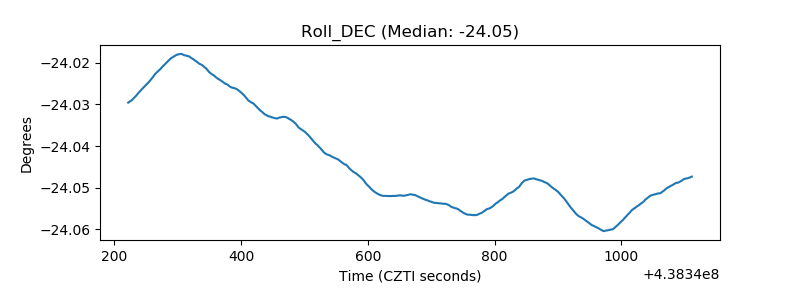 |
| _Roll_RA | 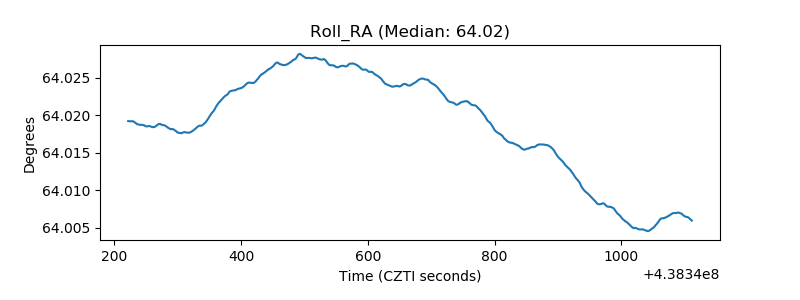 |
| Veto Counter | 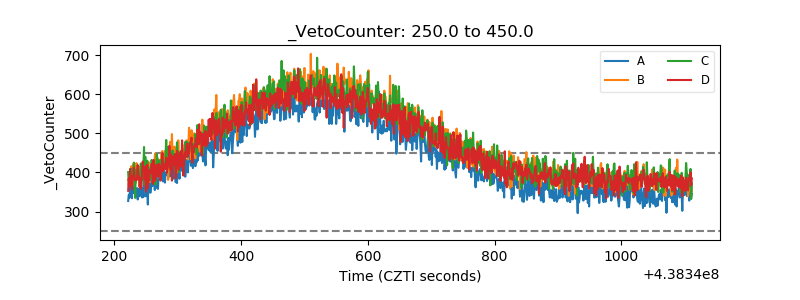 |