| Param | Original file | Final file |
|---|---|---|
| Filename | modeM0/AS1A13_029T01_9000005940_44078cztM0_level2.fits | modeM0/AS1A13_029T01_9000005940_44078cztM0_level2_quad_clean.evt |
| Size (bytes) | 486,112,320 | 119,808,000 |
| Size | 463.6 MB | 114.3 MB |
| Events in quadrant A | 5,021,343 | 807,279 |
| Events in quadrant B | 3,235,674 | 846,896 |
| Events in quadrant C | 3,356,921 | 804,847 |
| Events in quadrant D | 5,833,058 | 678,349 |
| Mode SS | |||
|---|---|---|---|
| Quadrant | BADHDUFLAG | Total packets | Discarded packets |
| A | 0 | 144 | 0 |
| B | 0 | 144 | 0 |
| C | 0 | 144 | 0 |
| D | 0 | 144 | 0 |
| Mode M0 | |||
|---|---|---|---|
| Quadrant | BADHDUFLAG | Total packets | Discarded packets |
| A | 0 | 19712 | 2 |
| B | 0 | 14548 | 2 |
| C | 0 | 15107 | 2 |
| D | 0 | 22321 | 2 |
| Mode M9 | |||
|---|---|---|---|
| Quadrant | BADHDUFLAG | Total packets | Discarded packets |
| A | 0 | 18 | 0 |
| B | 0 | 18 | 0 |
| C | 0 | 18 | 0 |
| D | 0 | 18 | 0 |
| Quadrant | Total seconds | Saturated seconds | Saturation percentage |
|---|---|---|---|
| A | 7044 | 182 | 2.583759% |
| B | 7044 | 79 | 1.121522% |
| C | 7045 | 74 | 1.050390% |
| D | 7045 | 777 | 11.029099% |
Noise dominated data is calculated using 1-second bins in cleaned event files. If a bin has >2000 counts, and if more than 50% of those come from <1% of pixels, then it is considered to be noise-dominated and hence unusable.
| Quadrant | # 1 sec bins | Bins with >0 counts | Bins with >2000 counts | High rate bins dominated by noise | Noise dominated (total time) | Noise dominated (detector-on time) | Marked lightcurve |
|---|---|---|---|---|---|---|---|
| A | 8859 | 7046 | 36 | 36 | 0.41% | 0.51% | 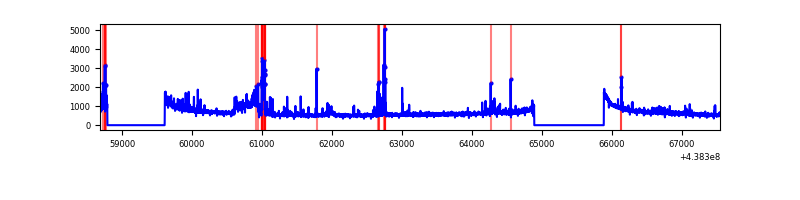 |
| B | 8859 | 7046 | 0 | 0 | 0.00% | 0.00% | 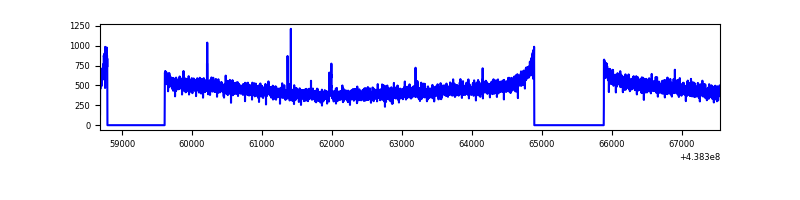 |
| C | 8860 | 7046 | 37 | 37 | 0.42% | 0.53% | 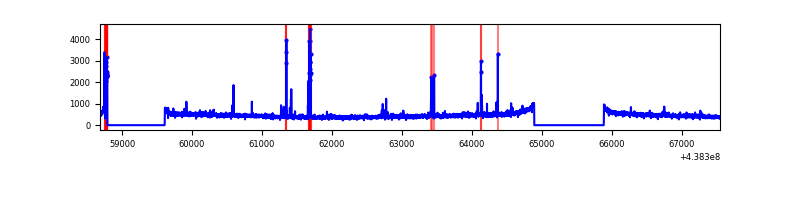 |
| D | 8860 | 7047 | 545 | 545 | 6.15% | 7.73% | 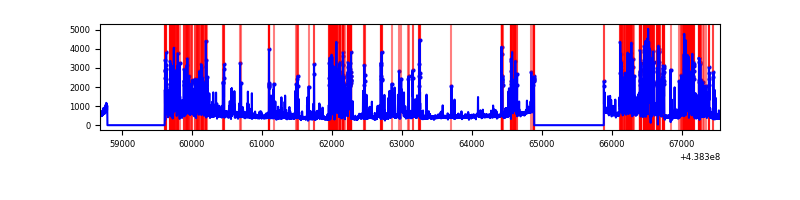 |
Top three noisy pixels from each quadrant. If the there are fewer than three noisy pixels in the level2.evt file, extra rows are filled as -1
| Pixel properties | Quadrant properties | ||||||
|---|---|---|---|---|---|---|---|
| Quadrant | DetID | PixID | Counts | Sigma | Mean | Median | Sigma |
| A | 10 | 83 | 1252486 | 7439.85 | 818 | 804 | 168.2 |
| A | 15 | 222 | 432982 | 2568.81 | 818 | 804 | 168.2 |
| A | 12 | 227 | 95141 | 560.73 | 818 | 804 | 168.2 |
| B | 12 | 111 | 21533 | 126.4 | 821 | 797 | 164.1 |
| B | 11 | 111 | 19537 | 114.23 | 821 | 797 | 164.1 |
| B | 14 | 111 | 19402 | 113.41 | 821 | 797 | 164.1 |
| C | 14 | 254 | 177365 | 933.72 | 800 | 806 | 189.1 |
| C | 4 | 254 | 30660 | 157.88 | 800 | 806 | 189.1 |
| C | 12 | 249 | 6983 | 32.67 | 800 | 806 | 189.1 |
| D | 1 | 52 | 1546602 | 8001.53 | 766 | 743 | 193.2 |
| D | 13 | 249 | 822210 | 4252.0 | 766 | 743 | 193.2 |
| D | 1 | 47 | 212587 | 1096.53 | 766 | 743 | 193.2 |
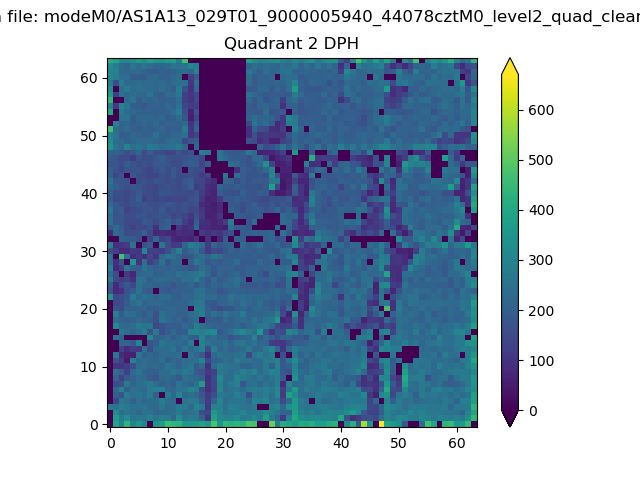
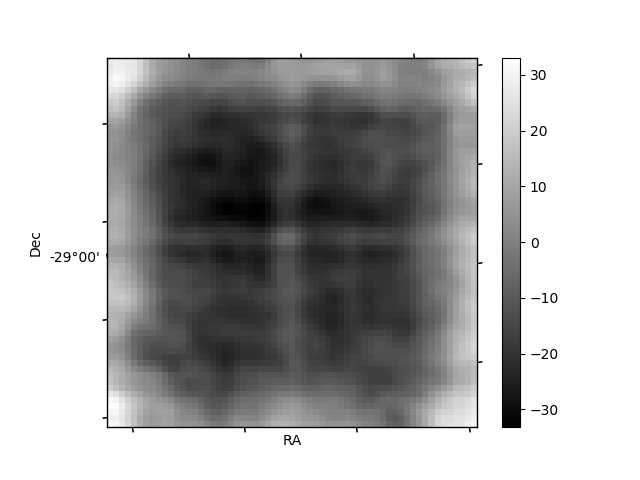
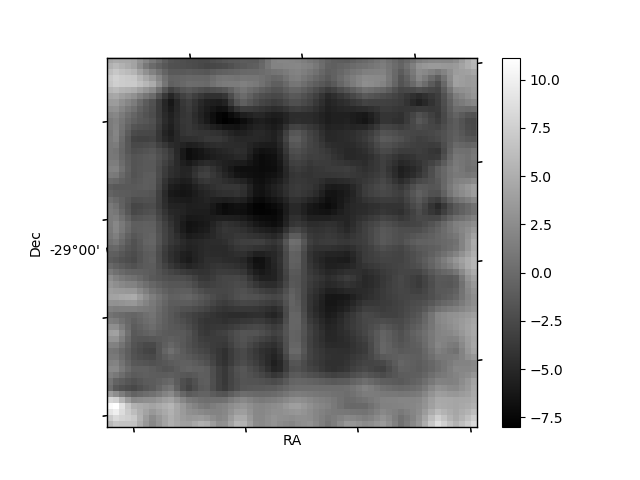
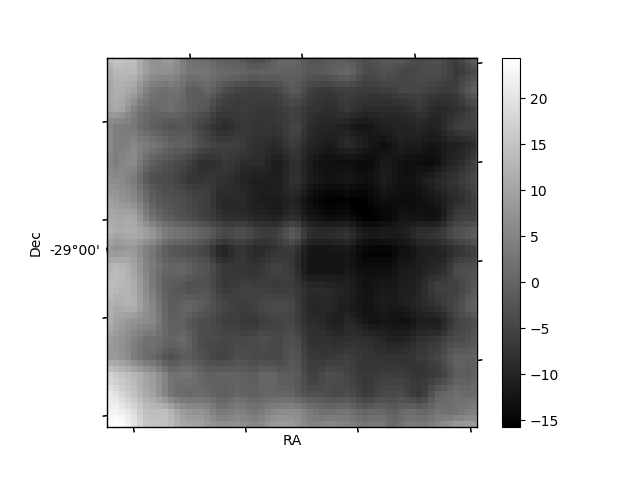
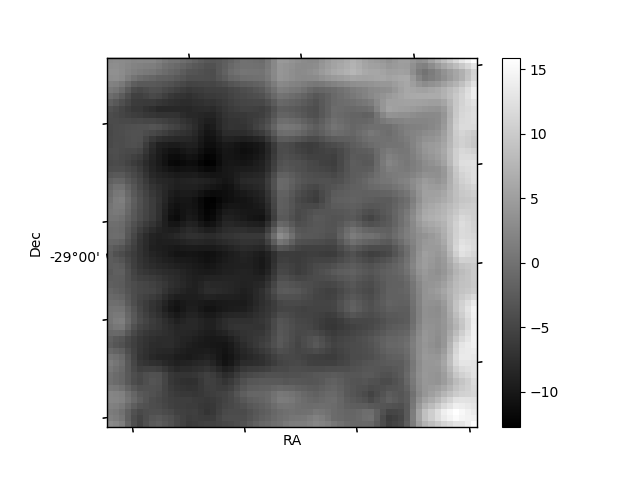
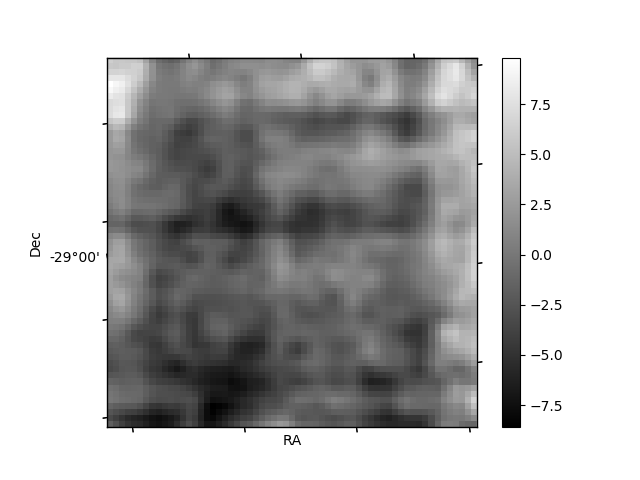
Histogram calculated using DETX and DETY for each event in the final _common_clean file
| Quadrant A | 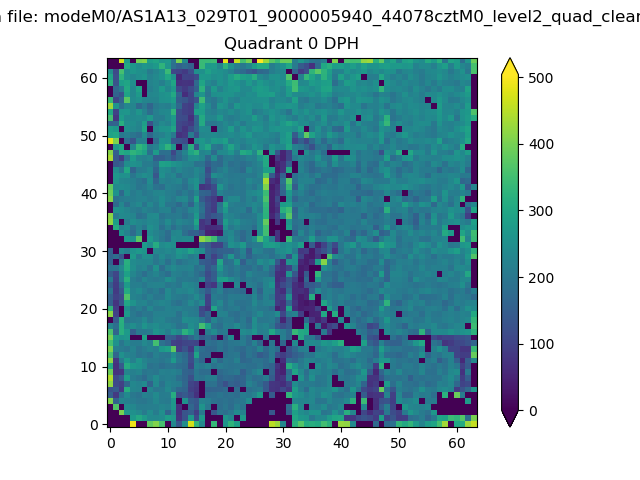 |
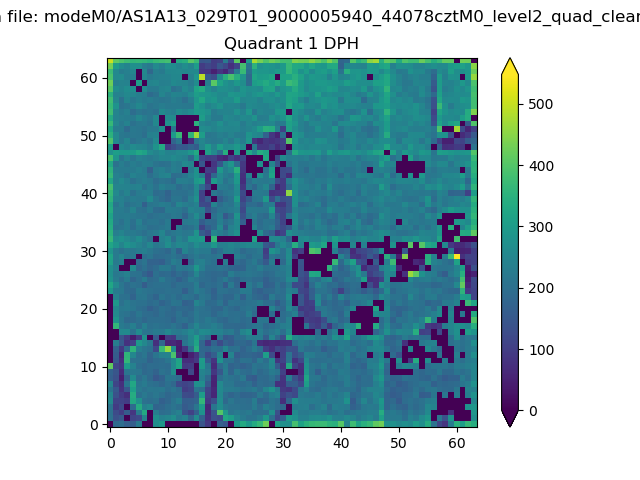 |
Quadrant B |
|---|---|---|---|
| Quadrant D | 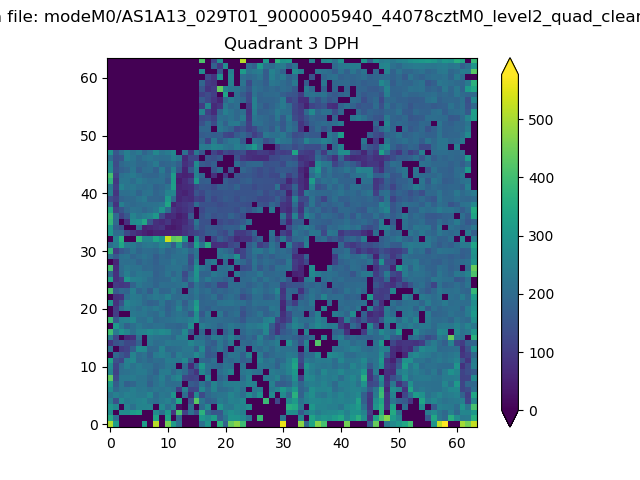 |
 |
Quadrant C |
| Plot type | Count rate plots | Images |
|---|---|---|
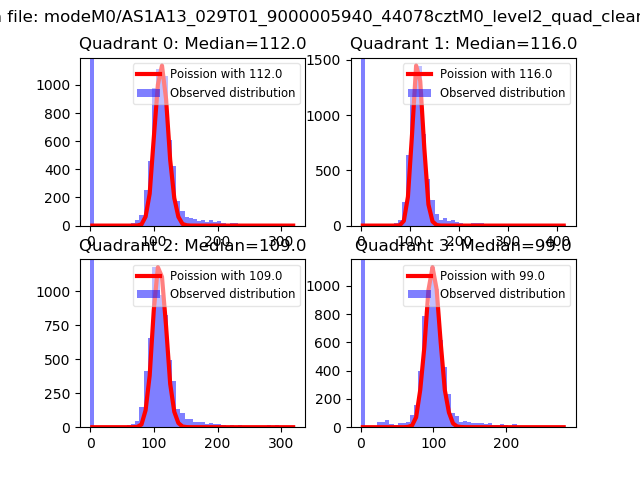
| Comparison with Poisson distribution Blue bars denote a histogram of data divided into 1 sec bins. Red curve is a Poisson curve with rate = median count rate of data. |
 |
 |
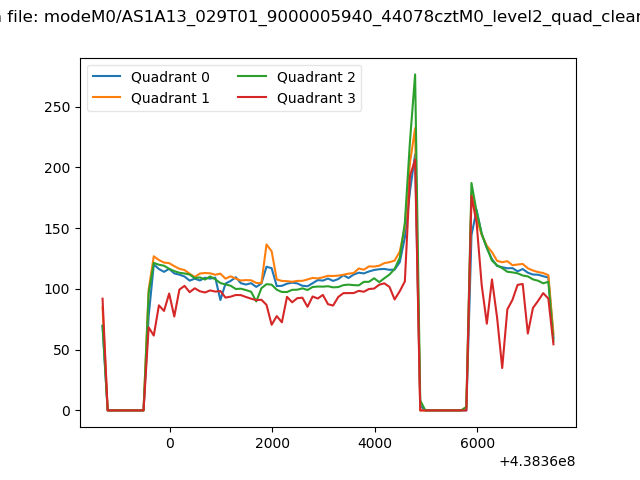
| Quadrant-wise count rates Data is divided into 100 sec bins |
 |
|
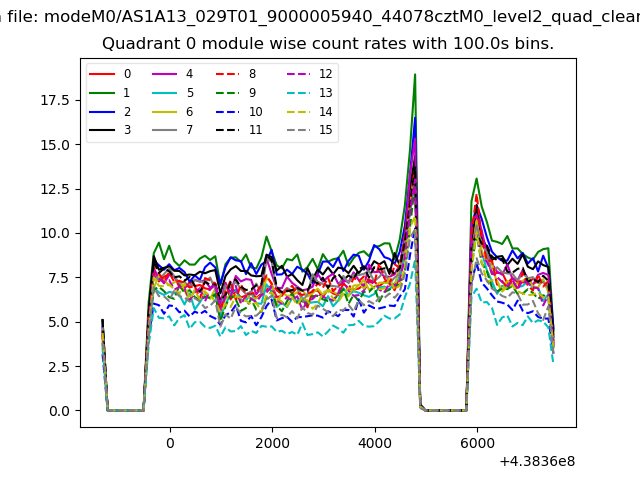
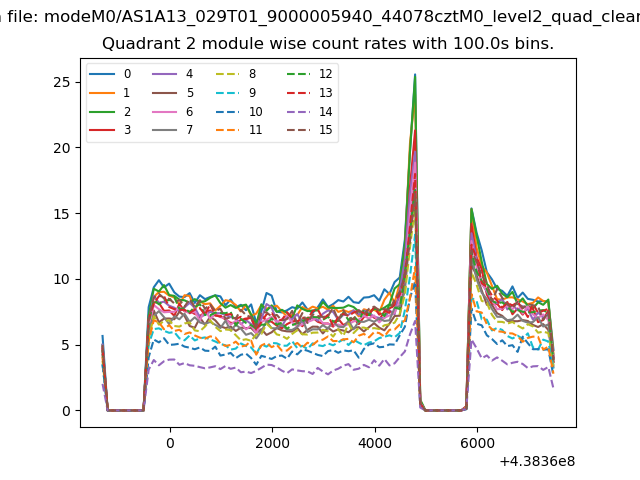
| Module-wise count rates for Quadrant A Data is divided into 100 sec bins |
 |
 |
| Module-wise count rates for Quadrant B Data is divided into 100 sec bins |
 |
 |
| Module-wise count rates for Quadrant C Data is divided into 100 sec bins |
 |
 |
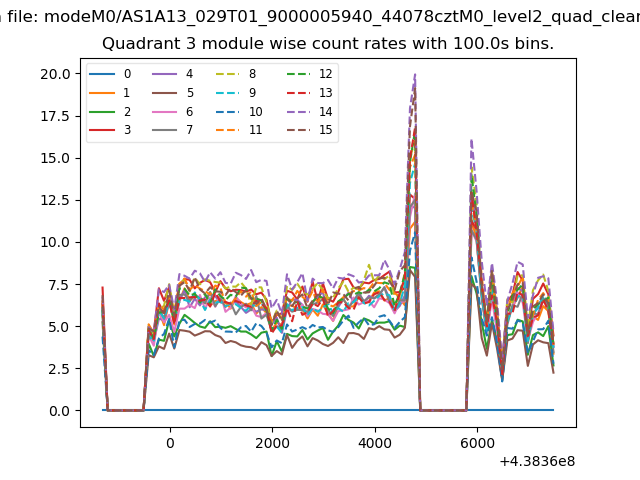
| Module-wise count rates for Quadrant D Data is divided into 100 sec bins |
 |
 |
| Parameter | Plot |
|---|---|
| CZT HV Monitor | 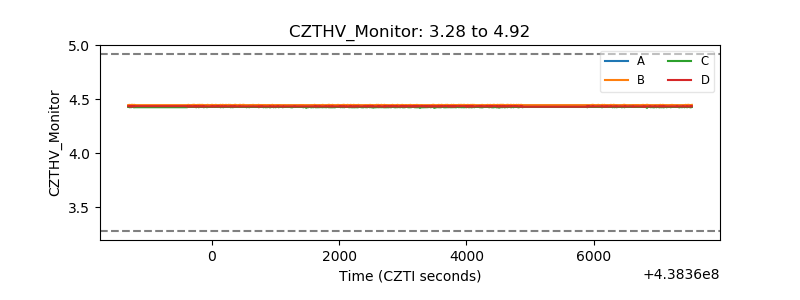 |
| D_VDD | 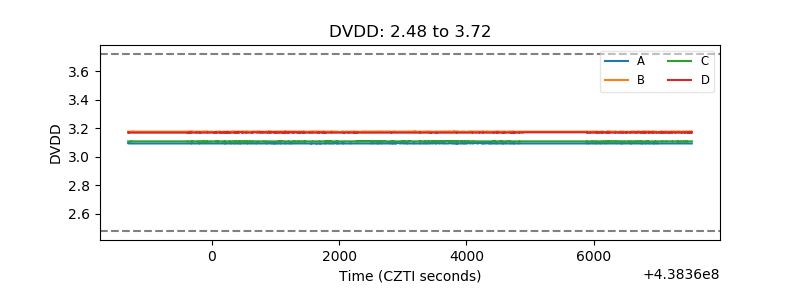 |
| Temperature 1 | 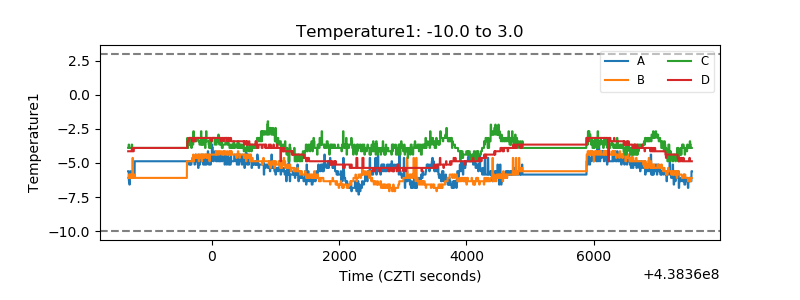 |
| Veto HV Monitor | 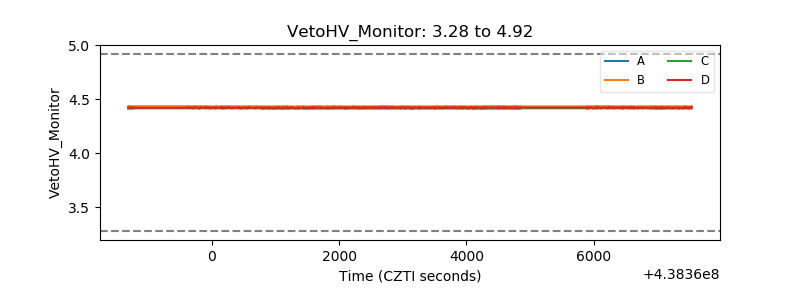 |
| Veto LLD | 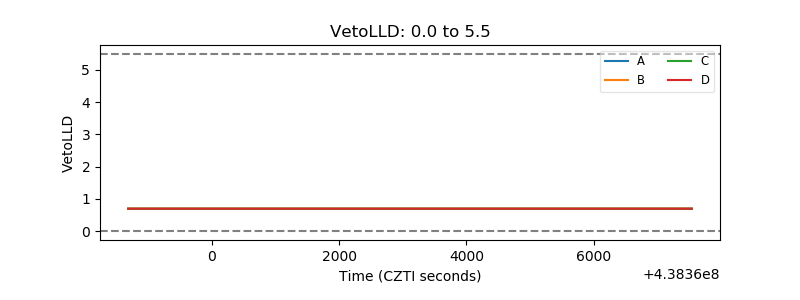 |
| Alpha Counter | 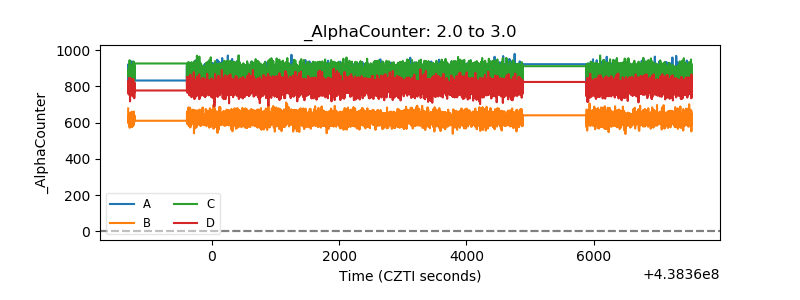 |
| _CPM_Rate | 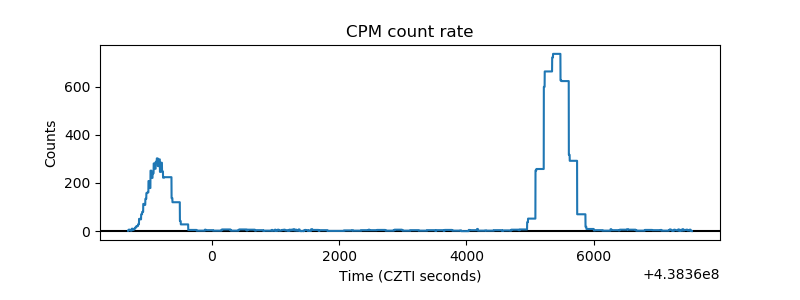 |
| CZT Counter | 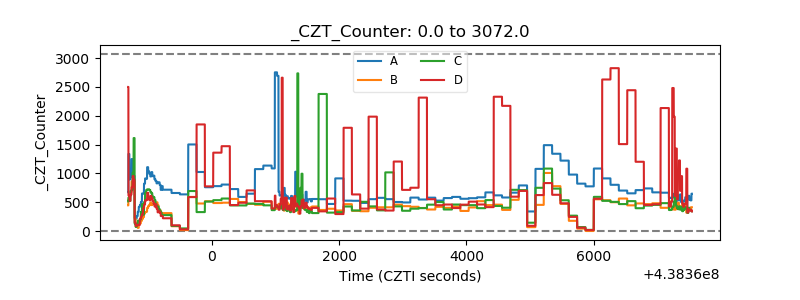 |
| +2.5 Volts monitor | 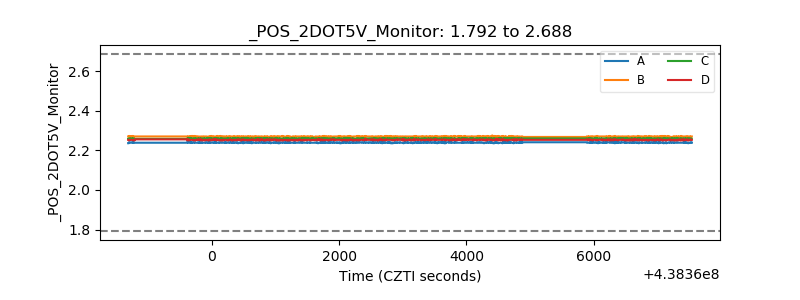 |
| +5 Volts monitor | 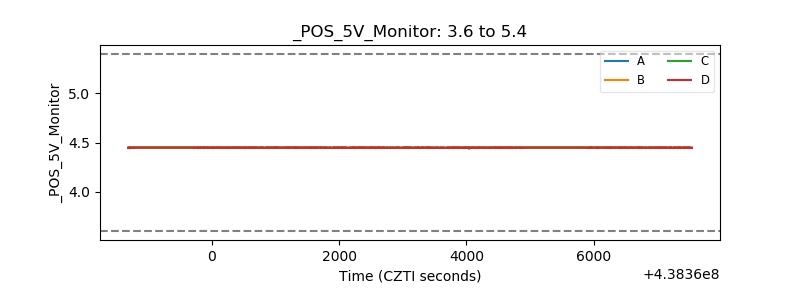 |
| _ROLL_ROT | 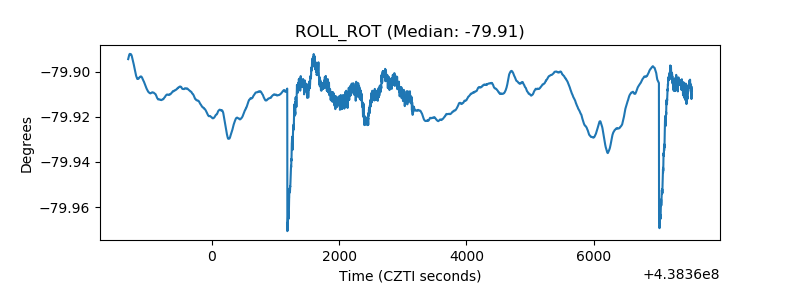 |
| _Roll_DEC | 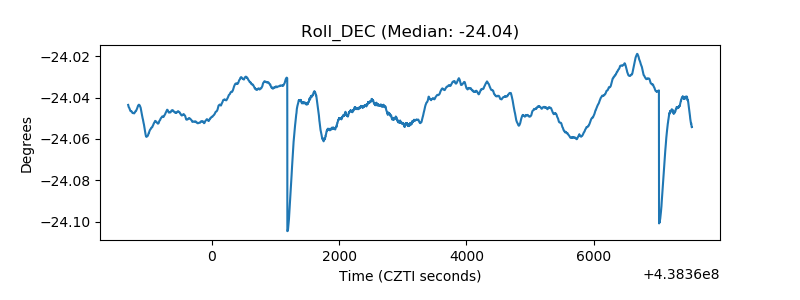 |
| _Roll_RA | 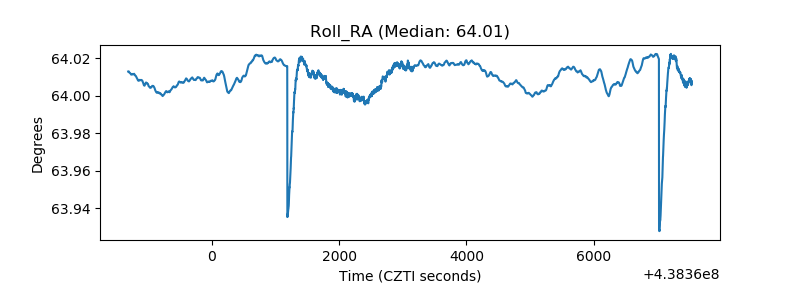 |
| Veto Counter | 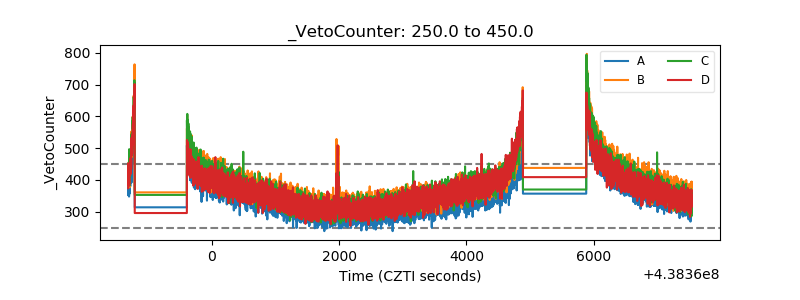 |