| Param | Original file | Final file |
|---|---|---|
| Filename | modeM0/AS1A13_029T01_9000005940_44080cztM0_level2.fits | modeM0/AS1A13_029T01_9000005940_44080cztM0_level2_quad_clean.evt |
| Size (bytes) | 411,252,480 | 106,634,880 |
| Size | 392.2 MB | 101.7 MB |
| Events in quadrant A | 4,038,278 | 724,855 |
| Events in quadrant B | 2,857,902 | 753,033 |
| Events in quadrant C | 2,858,296 | 700,875 |
| Events in quadrant D | 4,974,576 | 606,663 |
| Mode SS | |||
|---|---|---|---|
| Quadrant | BADHDUFLAG | Total packets | Discarded packets |
| A | 0 | 130 | 0 |
| B | 0 | 130 | 0 |
| C | 0 | 130 | 0 |
| D | 0 | 130 | 0 |
| Mode M0 | |||
|---|---|---|---|
| Quadrant | BADHDUFLAG | Total packets | Discarded packets |
| A | 0 | 16272 | 1 |
| B | 0 | 12928 | 1 |
| C | 0 | 13113 | 1 |
| D | 0 | 19342 | 1 |
| Mode M9 | |||
|---|---|---|---|
| Quadrant | BADHDUFLAG | Total packets | Discarded packets |
| A | 0 | 11 | 0 |
| B | 0 | 11 | 0 |
| C | 0 | 11 | 0 |
| D | 0 | 11 | 0 |
| Quadrant | Total seconds | Saturated seconds | Saturation percentage |
|---|---|---|---|
| A | 6353 | 69 | 1.086101% |
| B | 6354 | 46 | 0.723953% |
| C | 6354 | 25 | 0.393453% |
| D | 6354 | 522 | 8.215297% |
Noise dominated data is calculated using 1-second bins in cleaned event files. If a bin has >2000 counts, and if more than 50% of those come from <1% of pixels, then it is considered to be noise-dominated and hence unusable.
| Quadrant | # 1 sec bins | Bins with >0 counts | Bins with >2000 counts | High rate bins dominated by noise | Noise dominated (total time) | Noise dominated (detector-on time) | Marked lightcurve |
|---|---|---|---|---|---|---|---|
| A | 7458 | 6354 | 7 | 7 | 0.09% | 0.11% | 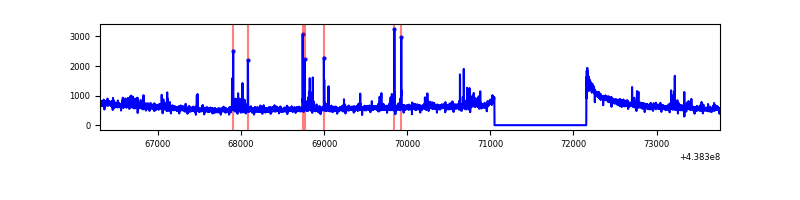 |
| B | 7459 | 6355 | 0 | 0 | 0.00% | 0.00% | 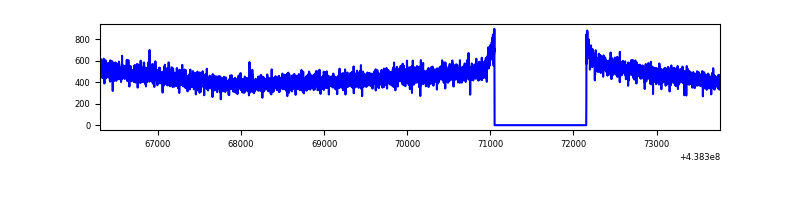 |
| C | 7459 | 6355 | 4 | 4 | 0.05% | 0.06% | 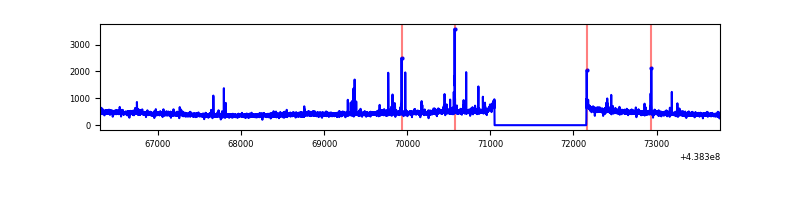 |
| D | 7459 | 6355 | 419 | 419 | 5.62% | 6.59% | 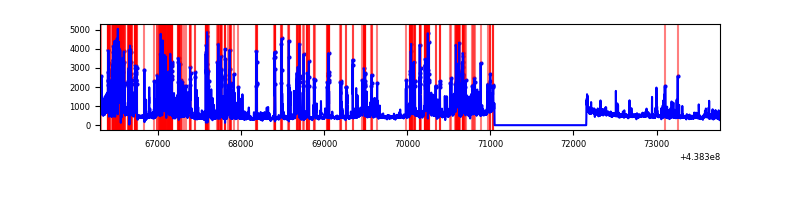 |
Top three noisy pixels from each quadrant. If the there are fewer than three noisy pixels in the level2.evt file, extra rows are filled as -1
| Pixel properties | Quadrant properties | ||||||
|---|---|---|---|---|---|---|---|
| Quadrant | DetID | PixID | Counts | Sigma | Mean | Median | Sigma |
| A | 10 | 83 | 1081407 | 7280.45 | 723 | 710 | 148.4 |
| A | 7 | 3 | 93183 | 622.97 | 723 | 710 | 148.4 |
| A | 2 | 79 | 20391 | 132.59 | 723 | 710 | 148.4 |
| B | 12 | 111 | 18876 | 127.36 | 725 | 703 | 142.7 |
| B | 14 | 111 | 17349 | 116.66 | 725 | 703 | 142.7 |
| B | 11 | 111 | 17042 | 114.51 | 725 | 703 | 142.7 |
| C | 14 | 254 | 78837 | 470.7 | 702 | 706 | 166.0 |
| C | 3 | 233 | 17090 | 98.71 | 702 | 706 | 166.0 |
| C | 2 | 14 | 9738 | 54.41 | 702 | 706 | 166.0 |
| D | 1 | 52 | 1205876 | 7136.47 | 672 | 652 | 168.9 |
| D | 13 | 249 | 749477 | 4434.0 | 672 | 652 | 168.9 |
| D | 5 | 235 | 290941 | 1718.88 | 672 | 652 | 168.9 |
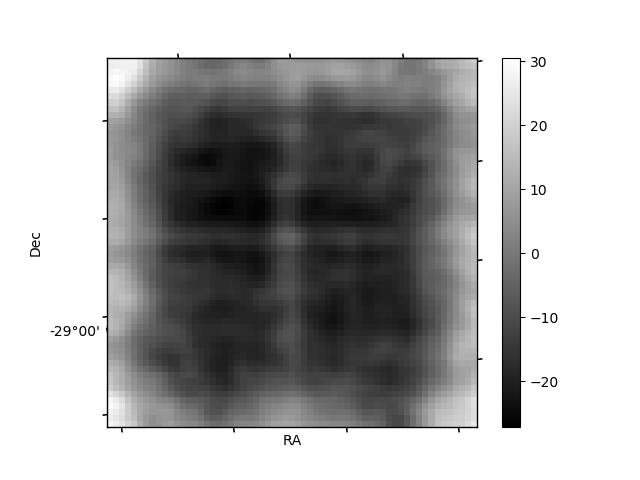
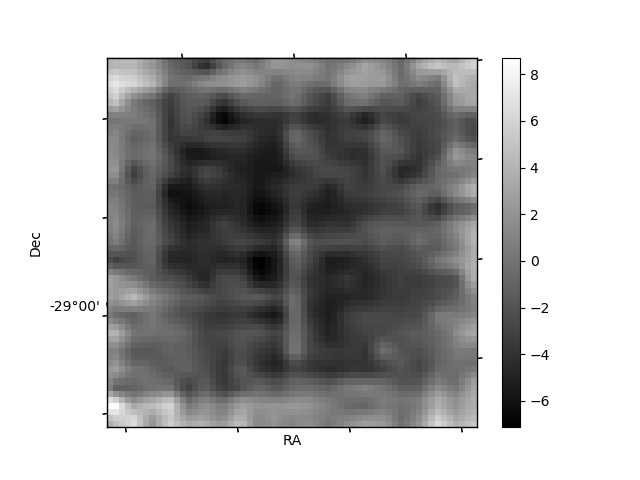
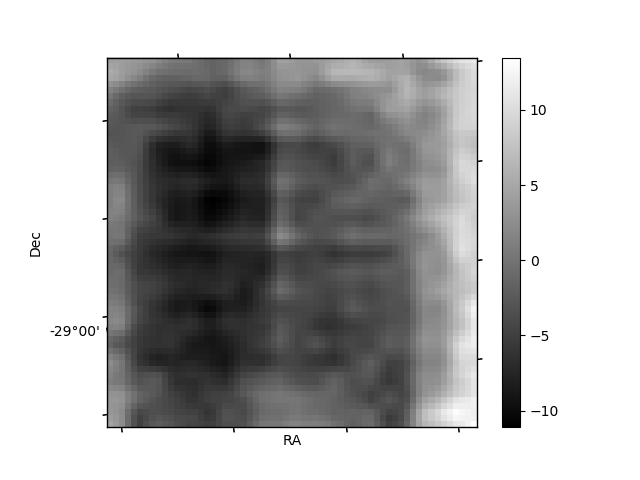
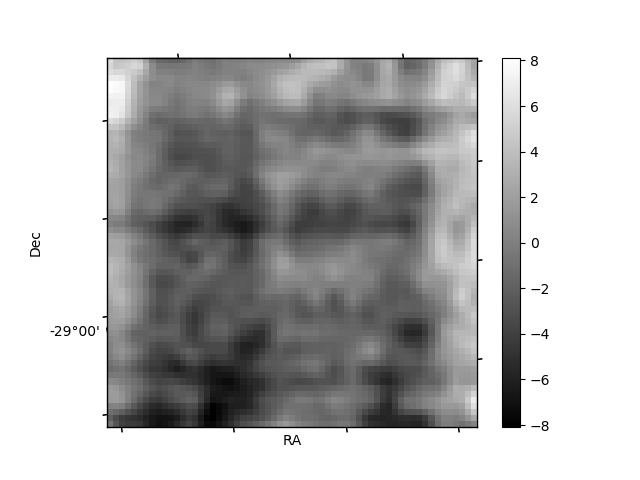
Histogram calculated using DETX and DETY for each event in the final _common_clean file
| Quadrant A | 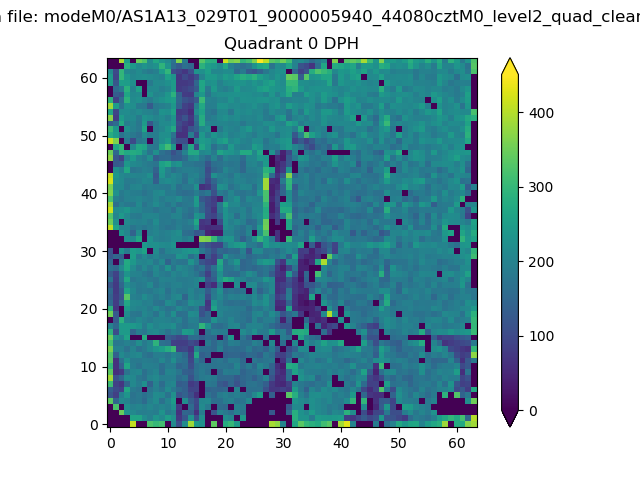 |
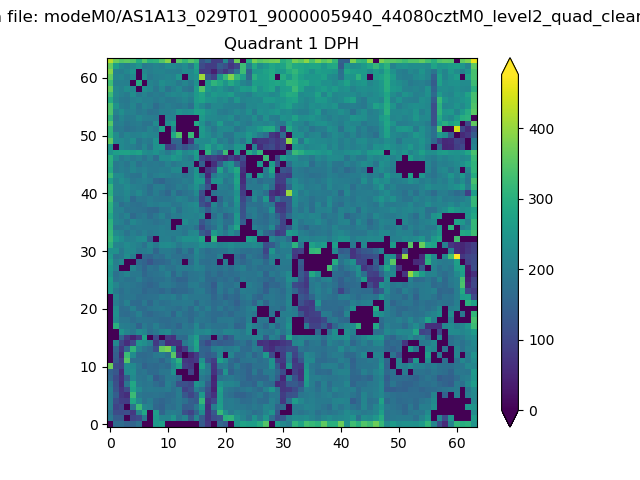 |
Quadrant B |
|---|---|---|---|
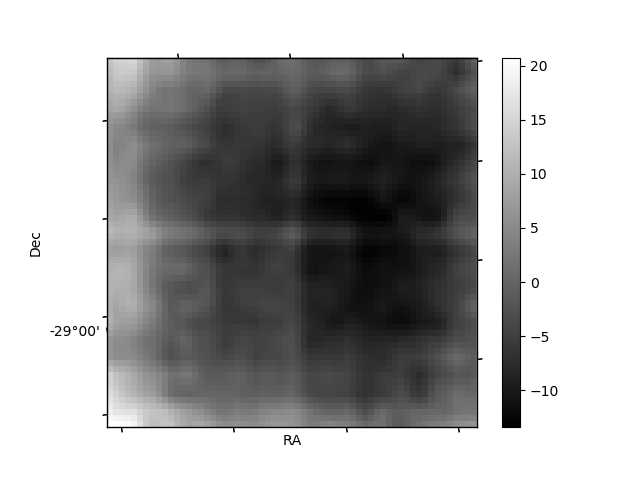
| Quadrant D | 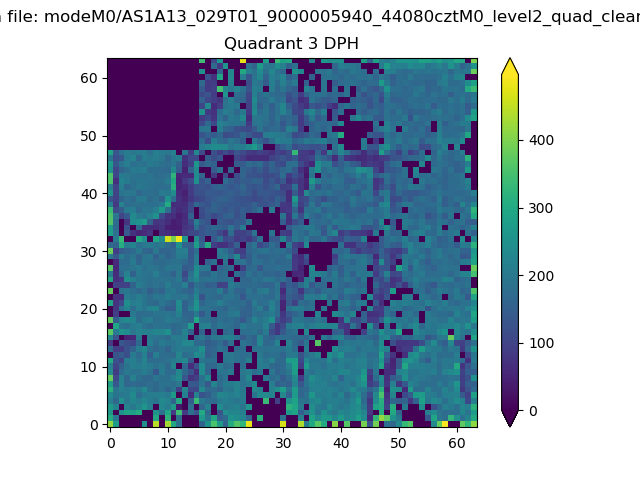 |
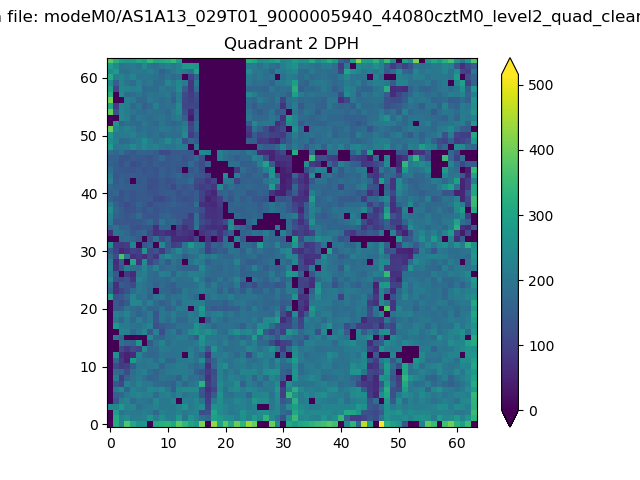 |
Quadrant C |
| Plot type | Count rate plots | Images |
|---|---|---|
| Comparison with Poisson distribution Blue bars denote a histogram of data divided into 1 sec bins. Red curve is a Poisson curve with rate = median count rate of data. |
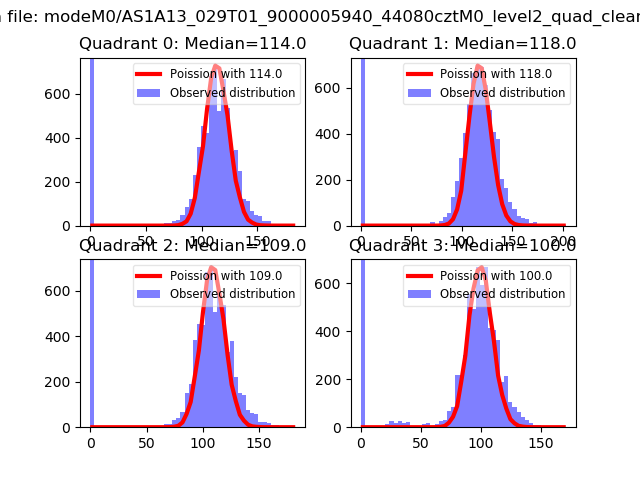 |
 |
| Quadrant-wise count rates Data is divided into 100 sec bins |
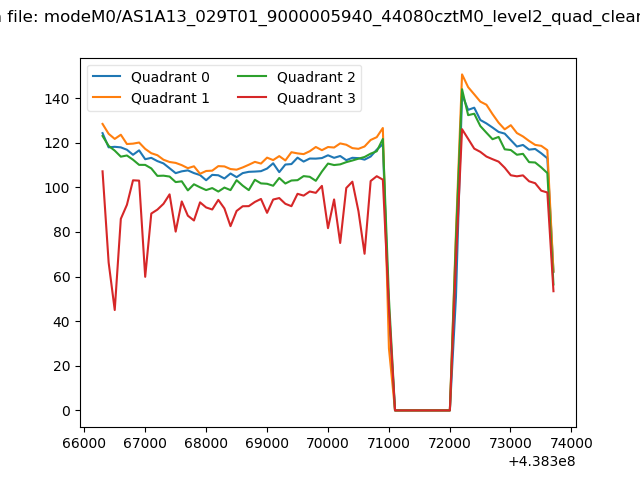 |
|
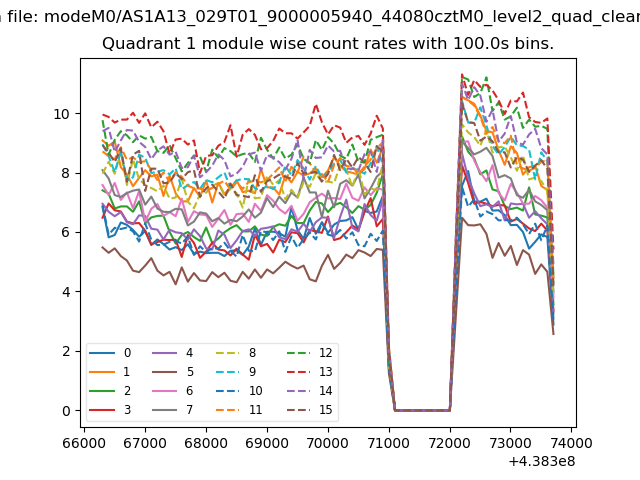
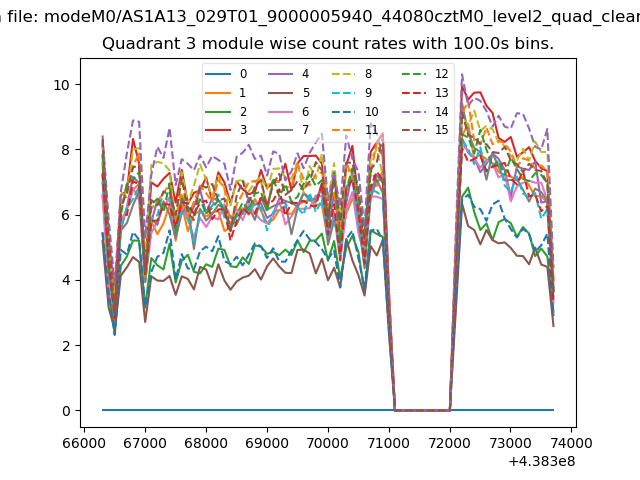
| Module-wise count rates for Quadrant A Data is divided into 100 sec bins |
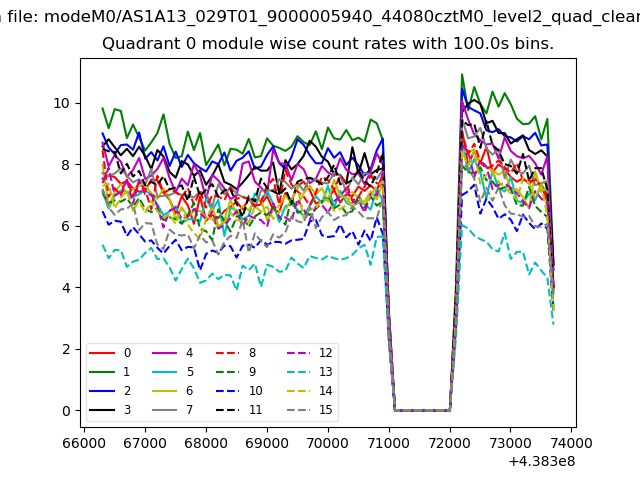 |
 |
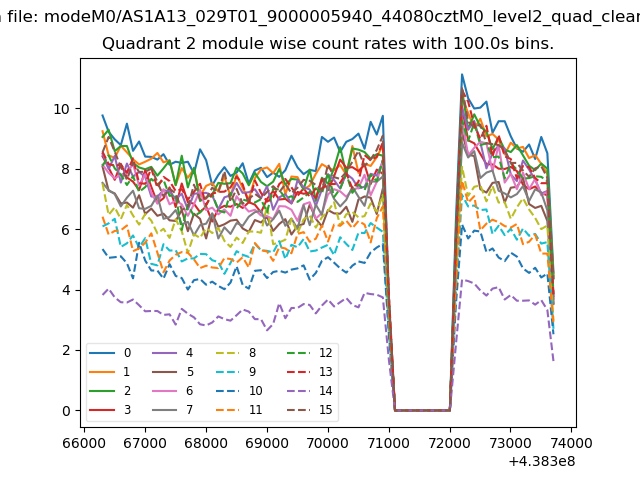
| Module-wise count rates for Quadrant B Data is divided into 100 sec bins |
 |
 |
| Module-wise count rates for Quadrant C Data is divided into 100 sec bins |
 |
 |
| Module-wise count rates for Quadrant D Data is divided into 100 sec bins |
 |
 |
| Parameter | Plot |
|---|---|
| CZT HV Monitor | 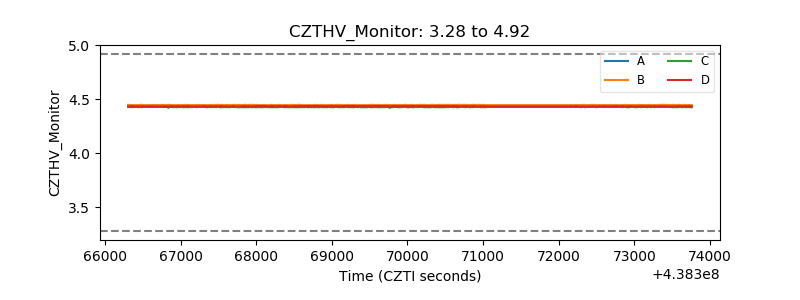 |
| D_VDD | 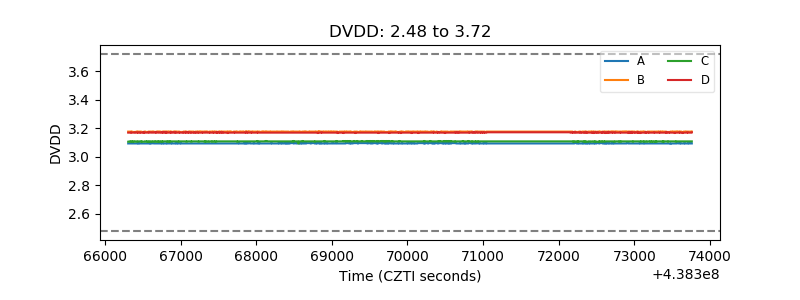 |
| Temperature 1 | 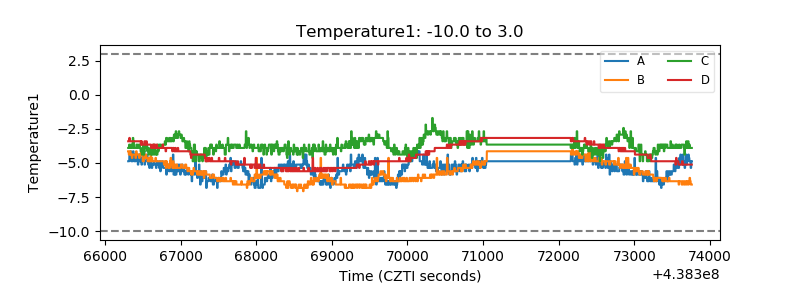 |
| Veto HV Monitor | 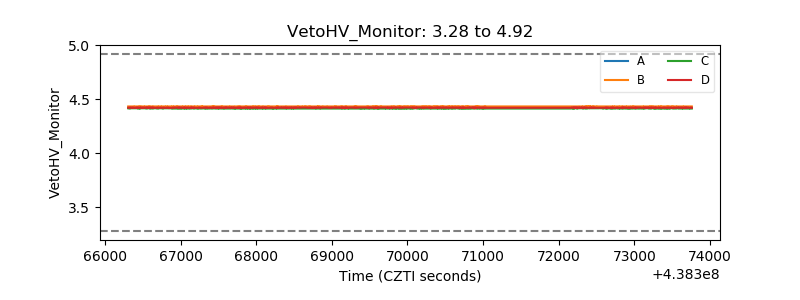 |
| Veto LLD | 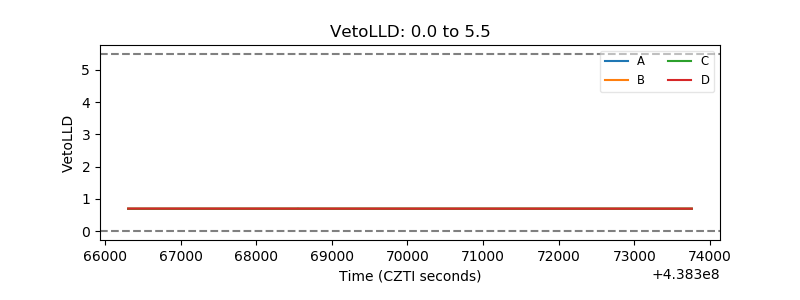 |
| Alpha Counter | 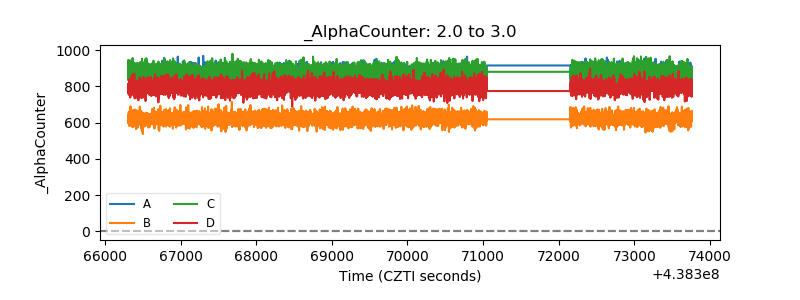 |
| _CPM_Rate | 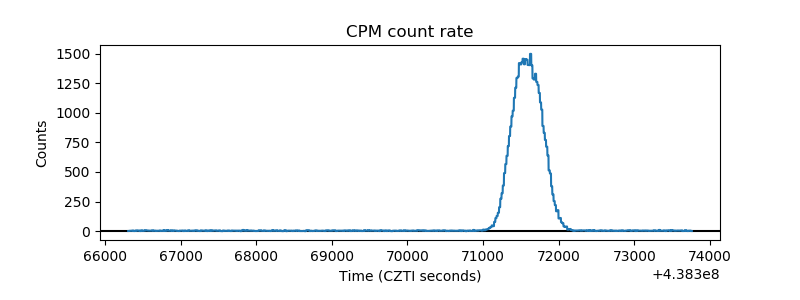 |
| CZT Counter | 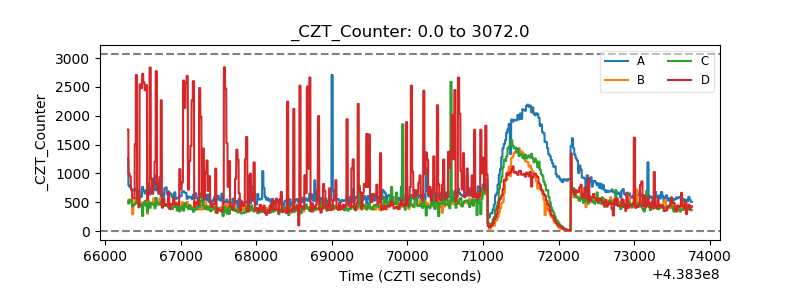 |
| +2.5 Volts monitor | 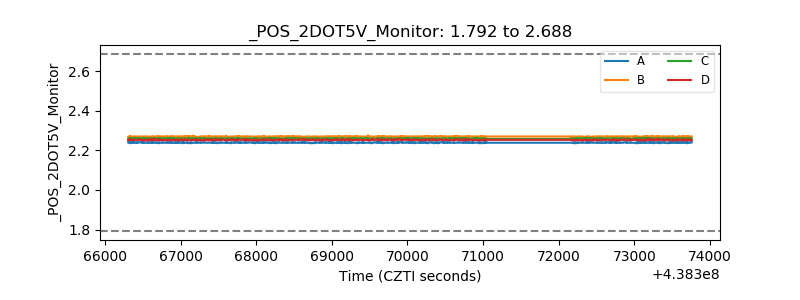 |
| +5 Volts monitor | 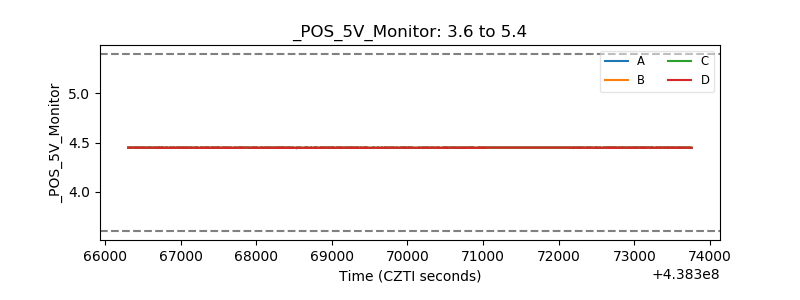 |
| _ROLL_ROT | 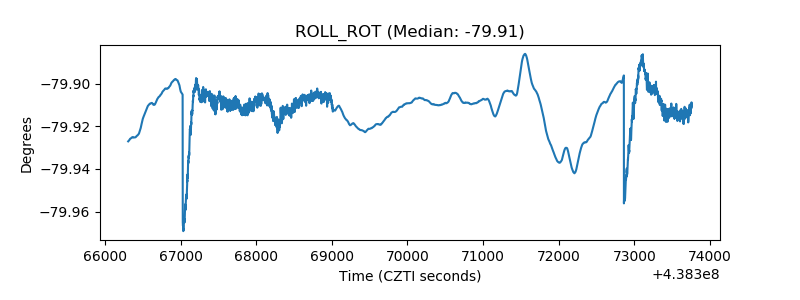 |
| _Roll_DEC | 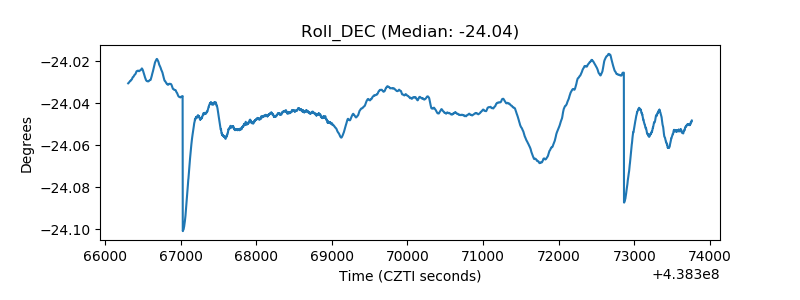 |
| _Roll_RA | 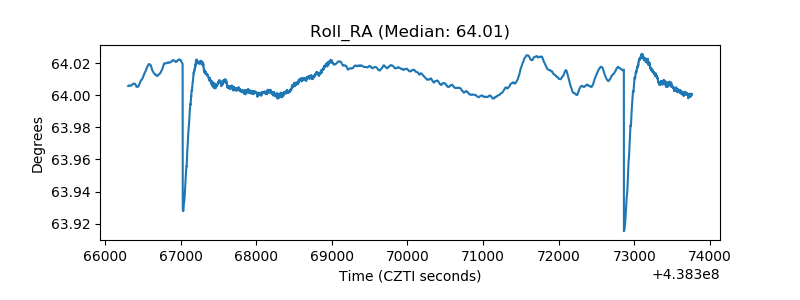 |
| Veto Counter | 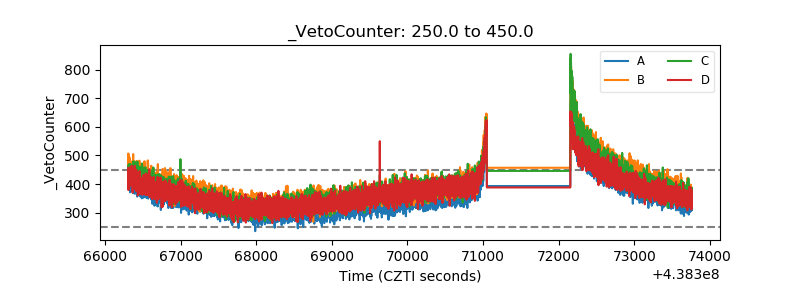 |