| Param | Original file | Final file |
|---|---|---|
| Filename | modeM0/AS1A13_029T01_9000005940_44081cztM0_level2.fits | modeM0/AS1A13_029T01_9000005940_44081cztM0_level2_quad_clean.evt |
| Size (bytes) | 451,385,280 | 116,559,360 |
| Size | 430.5 MB | 111.2 MB |
| Events in quadrant A | 4,960,848 | 786,450 |
| Events in quadrant B | 3,119,436 | 826,174 |
| Events in quadrant C | 3,087,534 | 766,991 |
| Events in quadrant D | 5,021,908 | 684,103 |
| Mode SS | |||
|---|---|---|---|
| Quadrant | BADHDUFLAG | Total packets | Discarded packets |
| A | 0 | 136 | 0 |
| B | 0 | 136 | 0 |
| C | 0 | 136 | 0 |
| D | 0 | 136 | 0 |
| Mode M0 | |||
|---|---|---|---|
| Quadrant | BADHDUFLAG | Total packets | Discarded packets |
| A | 0 | 19556 | 2 |
| B | 0 | 13795 | 2 |
| C | 0 | 13892 | 2 |
| D | 0 | 19594 | 2 |
| Mode M9 | |||
|---|---|---|---|
| Quadrant | BADHDUFLAG | Total packets | Discarded packets |
| A | 0 | 12 | 0 |
| B | 0 | 12 | 0 |
| C | 0 | 12 | 0 |
| D | 0 | 12 | 0 |
| Quadrant | Total seconds | Saturated seconds | Saturation percentage |
|---|---|---|---|
| A | 6683 | 164 | 2.453988% |
| B | 6684 | 71 | 1.062238% |
| C | 6684 | 41 | 0.613405% |
| D | 6684 | 303 | 4.533214% |
Noise dominated data is calculated using 1-second bins in cleaned event files. If a bin has >2000 counts, and if more than 50% of those come from <1% of pixels, then it is considered to be noise-dominated and hence unusable.
| Quadrant | # 1 sec bins | Bins with >0 counts | Bins with >2000 counts | High rate bins dominated by noise | Noise dominated (total time) | Noise dominated (detector-on time) | Marked lightcurve |
|---|---|---|---|---|---|---|---|
| A | 7868 | 6684 | 55 | 55 | 0.70% | 0.82% | 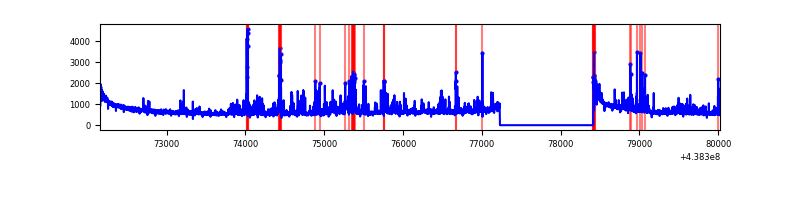 |
| B | 7869 | 6685 | 0 | 0 | 0.00% | 0.00% | 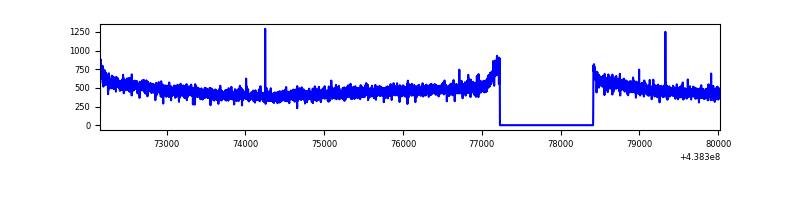 |
| C | 7869 | 6685 | 5 | 5 | 0.06% | 0.07% | 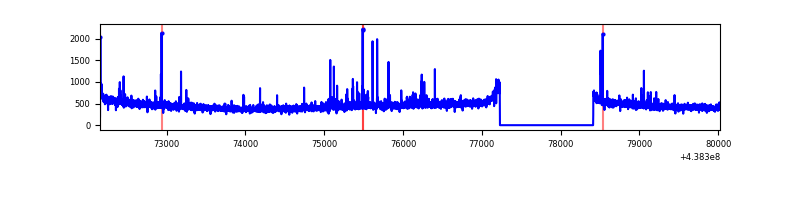 |
| D | 7869 | 6684 | 254 | 254 | 3.23% | 3.80% | 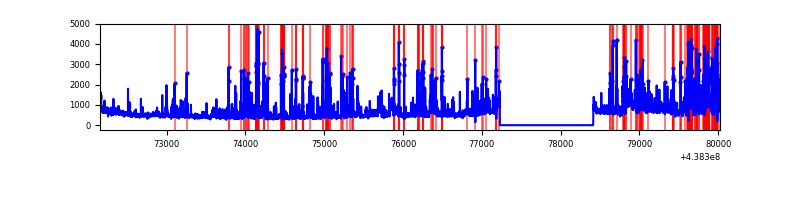 |
Top three noisy pixels from each quadrant. If the there are fewer than three noisy pixels in the level2.evt file, extra rows are filled as -1
| Pixel properties | Quadrant properties | ||||||
|---|---|---|---|---|---|---|---|
| Quadrant | DetID | PixID | Counts | Sigma | Mean | Median | Sigma |
| A | 10 | 83 | 1251177 | 7813.58 | 783 | 772 | 160.0 |
| A | 12 | 227 | 537256 | 3352.4 | 783 | 772 | 160.0 |
| A | 7 | 3 | 123276 | 765.51 | 783 | 772 | 160.0 |
| B | 12 | 111 | 20112 | 125.8 | 789 | 765 | 153.8 |
| B | 14 | 111 | 18536 | 115.56 | 789 | 765 | 153.8 |
| B | 11 | 111 | 18182 | 113.25 | 789 | 765 | 153.8 |
| C | 14 | 254 | 67475 | 367.23 | 765 | 771 | 181.6 |
| C | 3 | 233 | 9930 | 50.42 | 765 | 771 | 181.6 |
| C | 2 | 14 | 9604 | 48.63 | 765 | 771 | 181.6 |
| D | 13 | 249 | 801986 | 4307.36 | 743 | 722 | 186.0 |
| D | 1 | 52 | 720735 | 3870.58 | 743 | 722 | 186.0 |
| D | 13 | 174 | 209541 | 1122.55 | 743 | 722 | 186.0 |
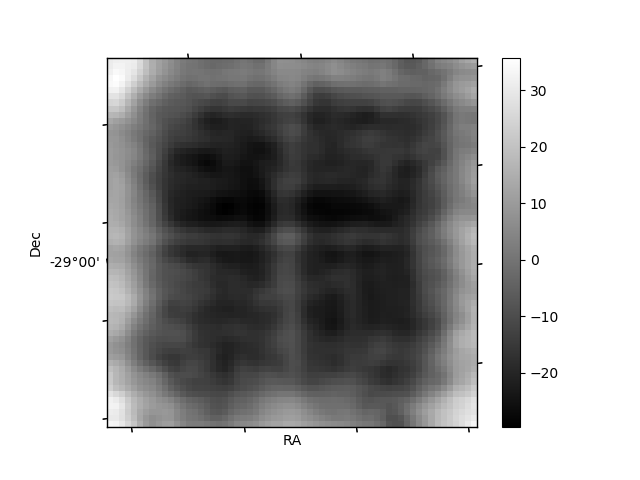
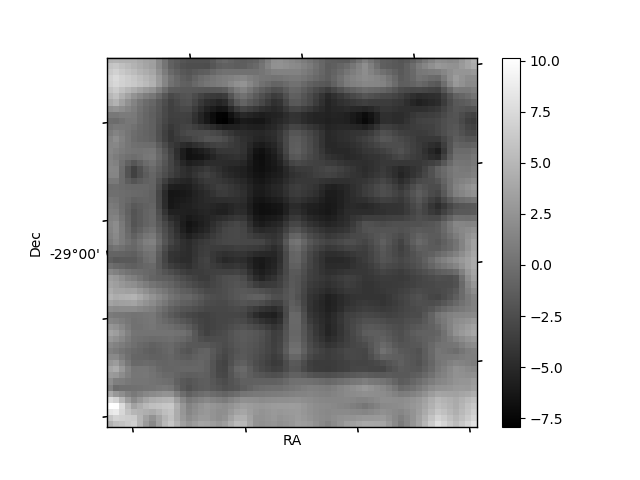
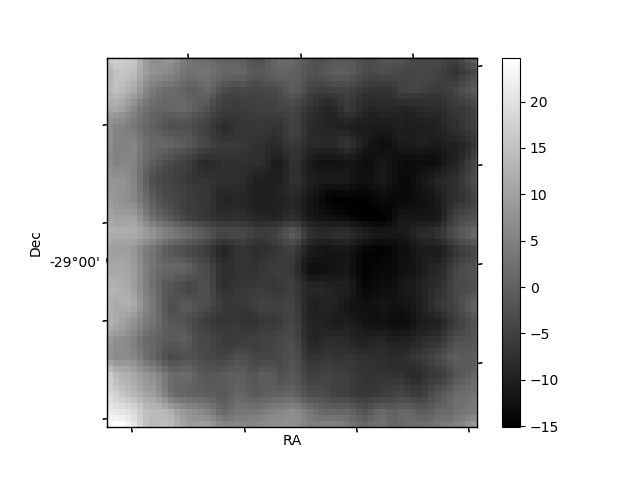
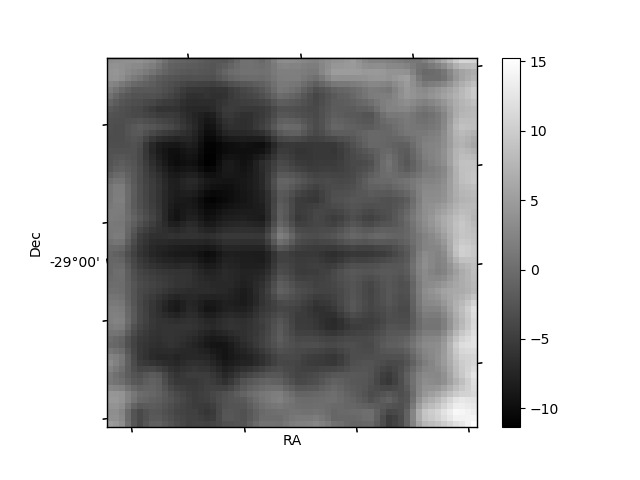
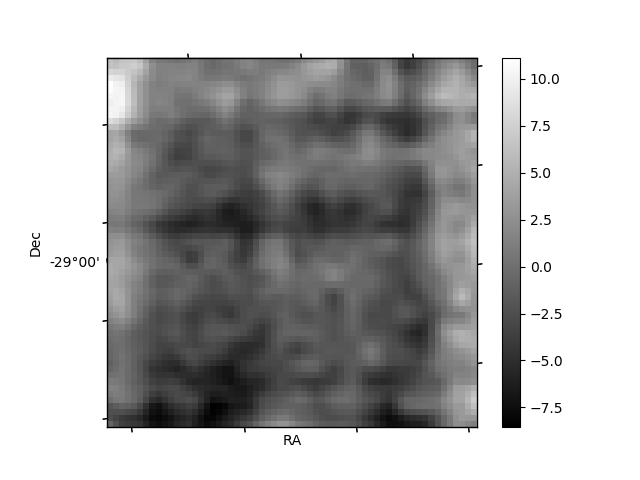
Histogram calculated using DETX and DETY for each event in the final _common_clean file
| Quadrant A | 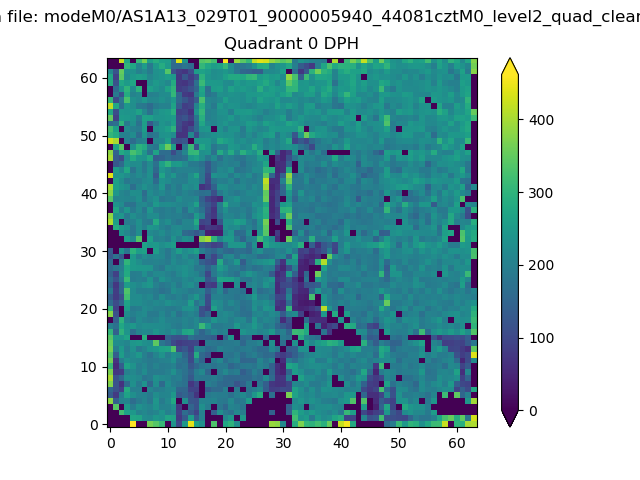 |
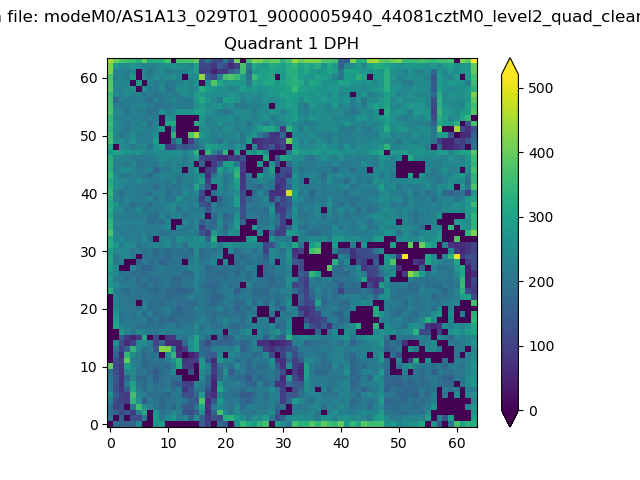 |
Quadrant B |
|---|---|---|---|
| Quadrant D | 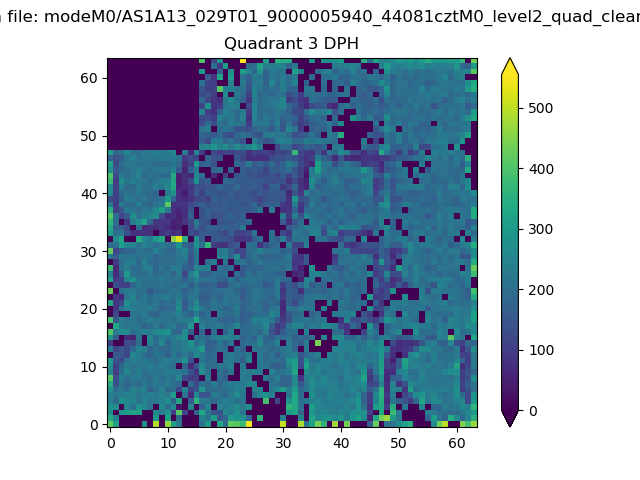 |
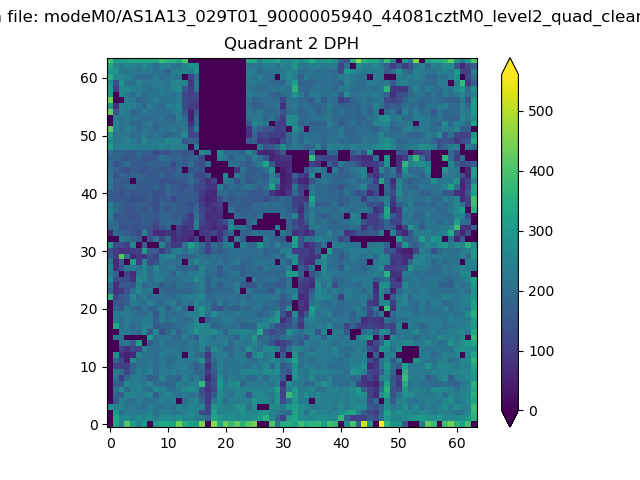 |
Quadrant C |
| Plot type | Count rate plots | Images |
|---|---|---|
| Comparison with Poisson distribution Blue bars denote a histogram of data divided into 1 sec bins. Red curve is a Poisson curve with rate = median count rate of data. |
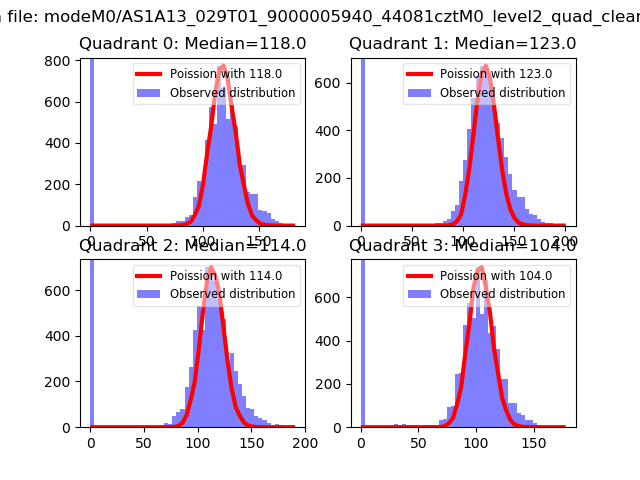 |
 |
| Quadrant-wise count rates Data is divided into 100 sec bins |
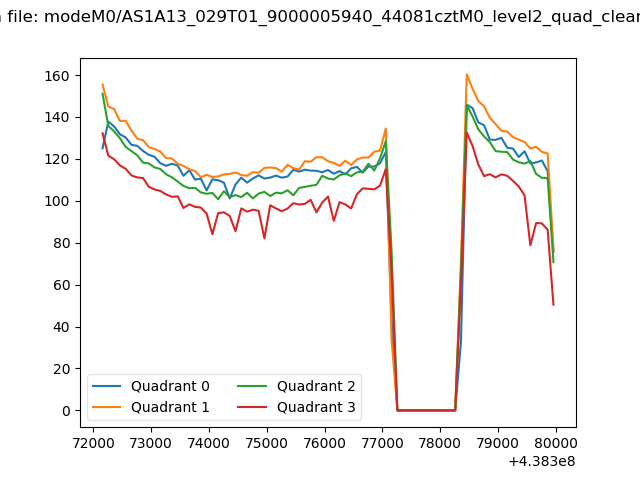 |
|
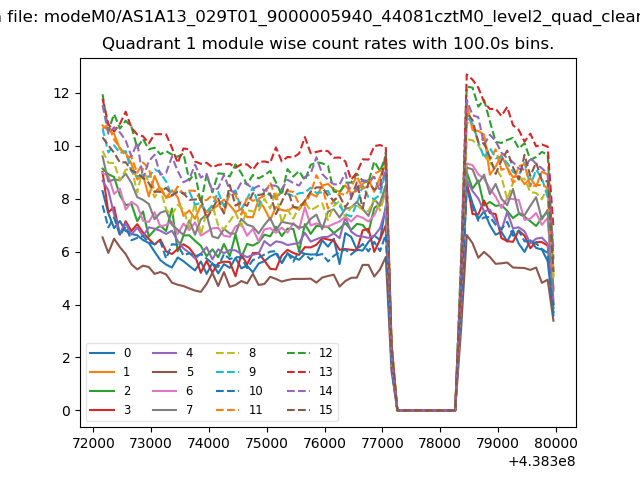
| Module-wise count rates for Quadrant A Data is divided into 100 sec bins |
 |
 |
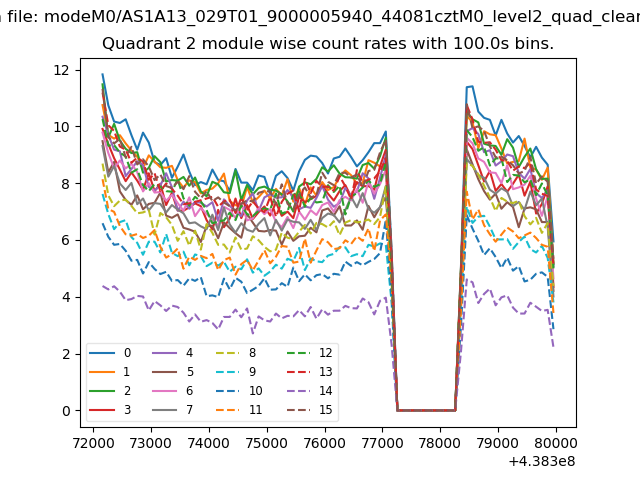
| Module-wise count rates for Quadrant B Data is divided into 100 sec bins |
 |
 |
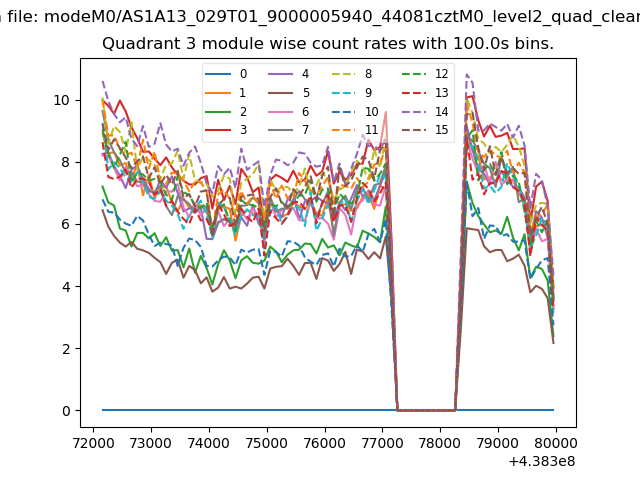
| Module-wise count rates for Quadrant C Data is divided into 100 sec bins |
 |
 |
| Module-wise count rates for Quadrant D Data is divided into 100 sec bins |
 |
 |
| Parameter | Plot |
|---|---|
| CZT HV Monitor | 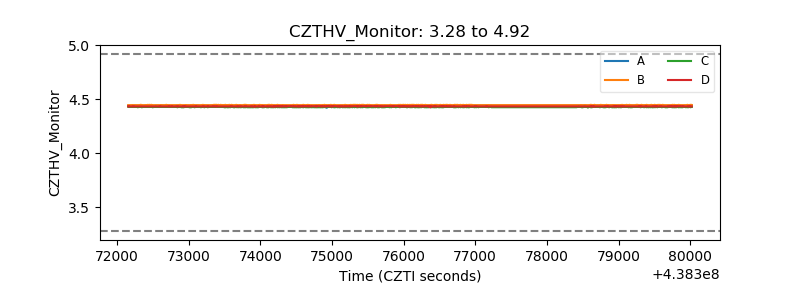 |
| D_VDD | 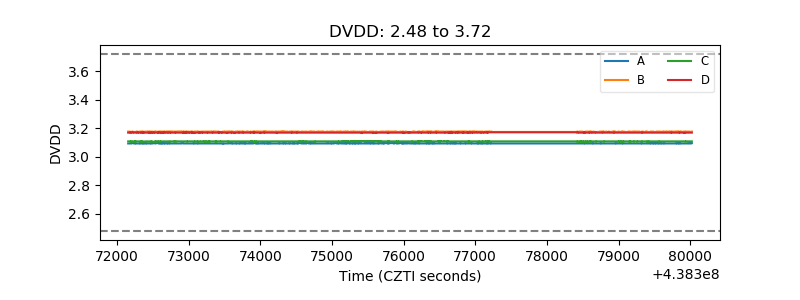 |
| Temperature 1 | 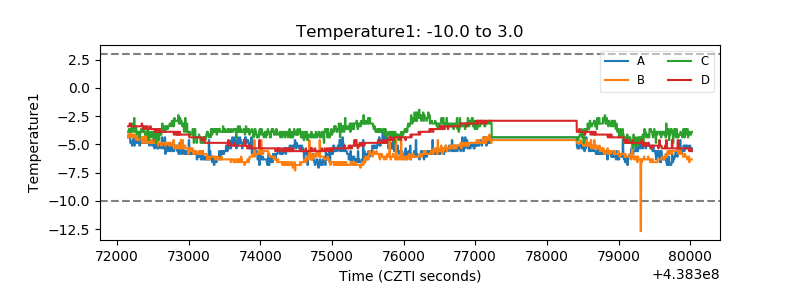 |
| Veto HV Monitor | 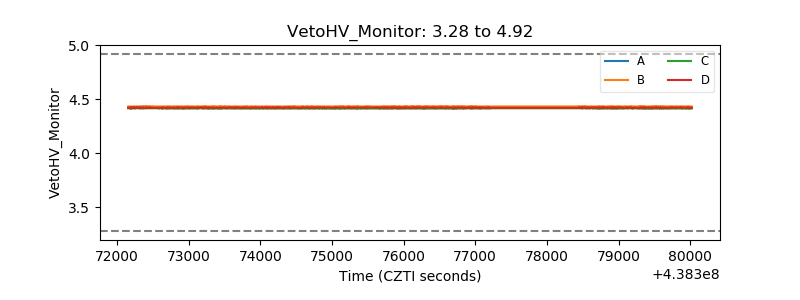 |
| Veto LLD | 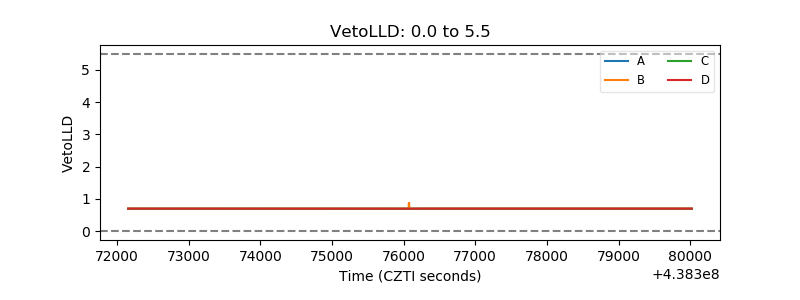 |
| Alpha Counter | 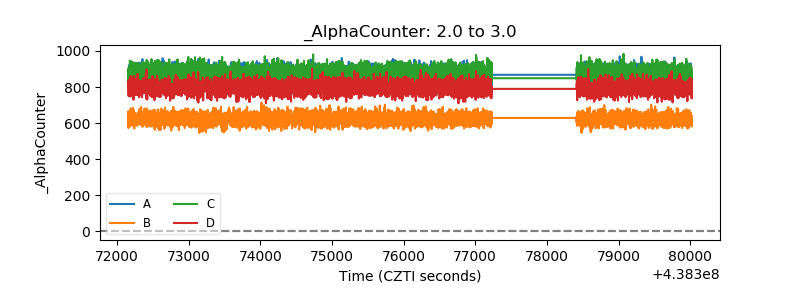 |
| _CPM_Rate | 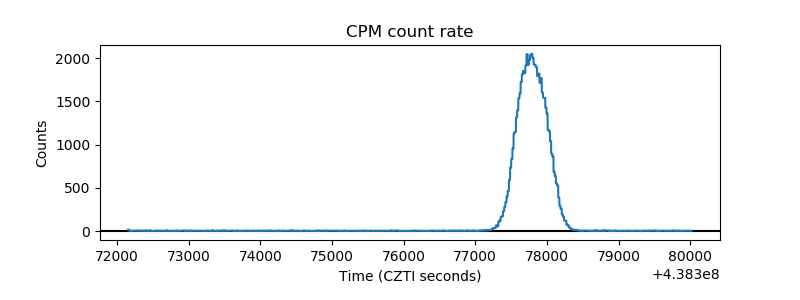 |
| CZT Counter | 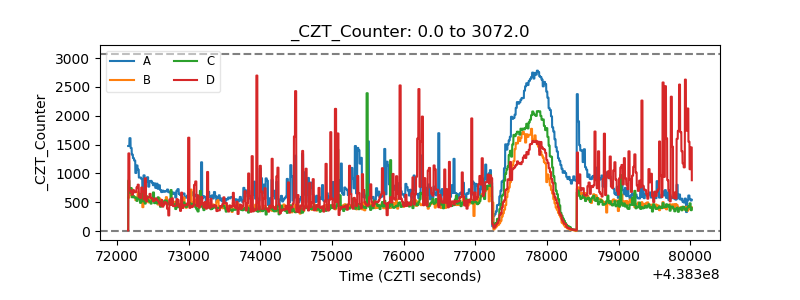 |
| +2.5 Volts monitor | 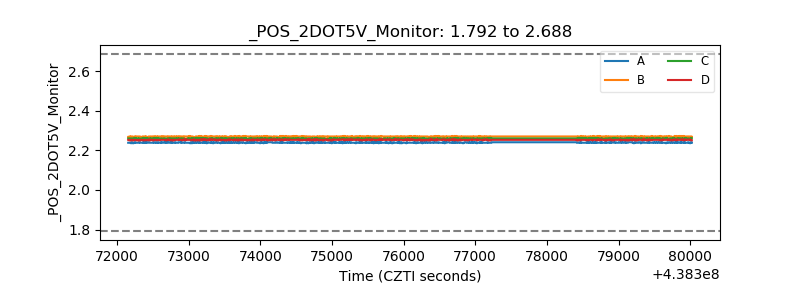 |
| +5 Volts monitor | 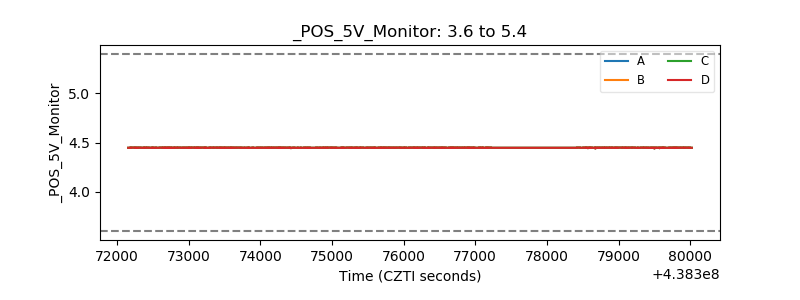 |
| _ROLL_ROT | 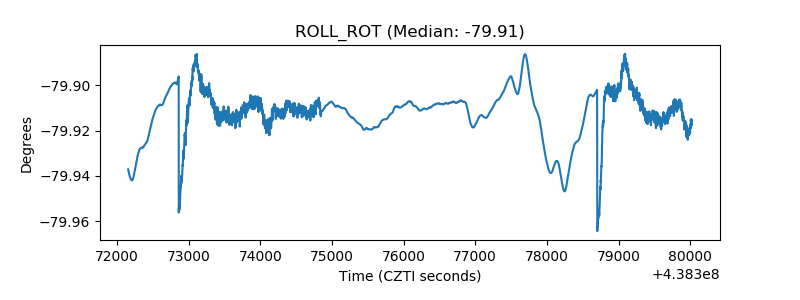 |
| _Roll_DEC | 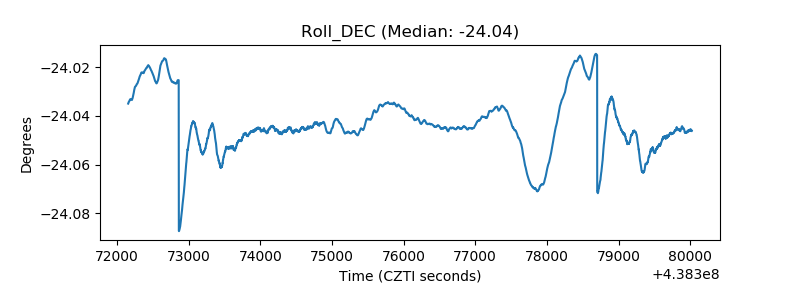 |
| _Roll_RA | 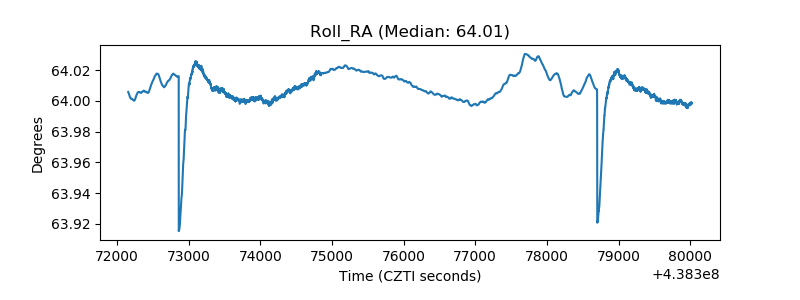 |
| Veto Counter | 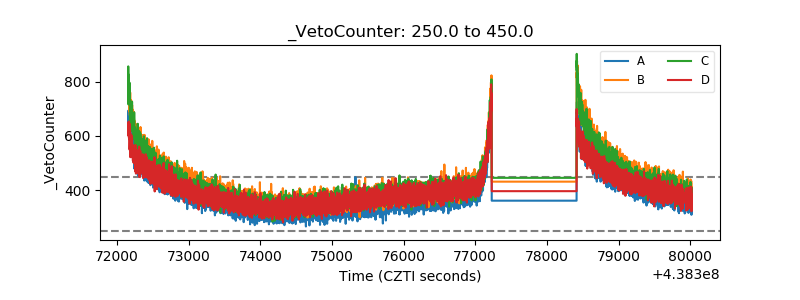 |