| Param | Original file | Final file |
|---|---|---|
| Filename | modeM0/AS1A13_029T01_9000005940_44082cztM0_level2.fits | modeM0/AS1A13_029T01_9000005940_44082cztM0_level2_quad_clean.evt |
| Size (bytes) | 462,061,440 | 117,129,600 |
| Size | 440.7 MB | 111.7 MB |
| Events in quadrant A | 4,617,144 | 794,177 |
| Events in quadrant B | 3,126,556 | 841,765 |
| Events in quadrant C | 3,083,630 | 779,699 |
| Events in quadrant D | 5,763,657 | 670,792 |
| Mode SS | |||
|---|---|---|---|
| Quadrant | BADHDUFLAG | Total packets | Discarded packets |
| A | 0 | 134 | 0 |
| B | 0 | 134 | 0 |
| C | 0 | 134 | 0 |
| D | 0 | 134 | 0 |
| Mode M0 | |||
|---|---|---|---|
| Quadrant | BADHDUFLAG | Total packets | Discarded packets |
| A | 0 | 18402 | 2 |
| B | 0 | 13658 | 2 |
| C | 0 | 13724 | 2 |
| D | 0 | 21563 | 2 |
| Mode M9 | |||
|---|---|---|---|
| Quadrant | BADHDUFLAG | Total packets | Discarded packets |
| A | 0 | 19 | 0 |
| B | 0 | 20 | 0 |
| C | 0 | 20 | 0 |
| D | 0 | 20 | 0 |
| Quadrant | Total seconds | Saturated seconds | Saturation percentage |
|---|---|---|---|
| A | 6603 | 142 | 2.150538% |
| B | 6603 | 61 | 0.923823% |
| C | 6602 | 25 | 0.378673% |
| D | 6602 | 511 | 7.740079% |
Noise dominated data is calculated using 1-second bins in cleaned event files. If a bin has >2000 counts, and if more than 50% of those come from <1% of pixels, then it is considered to be noise-dominated and hence unusable.
| Quadrant | # 1 sec bins | Bins with >0 counts | Bins with >2000 counts | High rate bins dominated by noise | Noise dominated (total time) | Noise dominated (detector-on time) | Marked lightcurve |
|---|---|---|---|---|---|---|---|
| A | 7808 | 6604 | 46 | 46 | 0.59% | 0.70% | 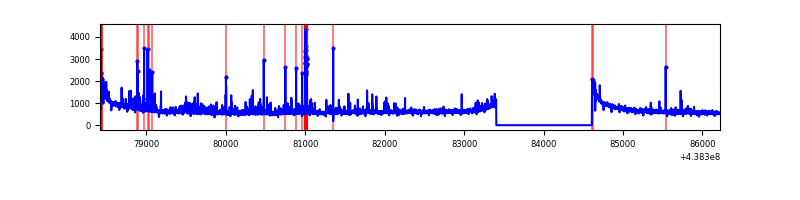 |
| B | 7808 | 6604 | 1 | 1 | 0.01% | 0.02% | 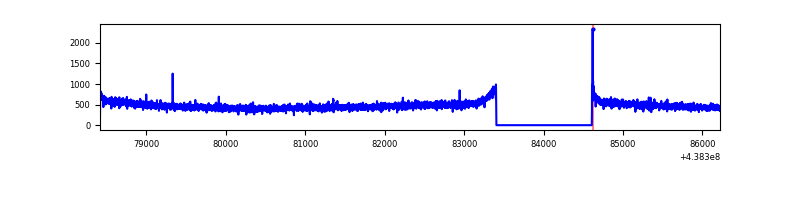 |
| C | 7807 | 6603 | 8 | 8 | 0.10% | 0.12% | 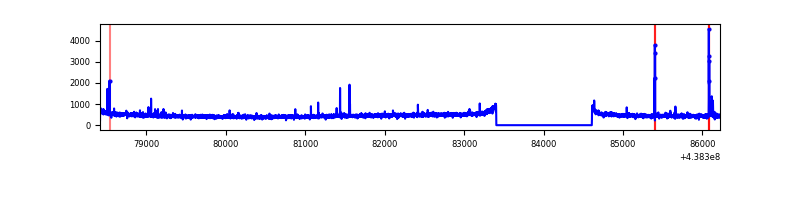 |
| D | 7807 | 6603 | 433 | 433 | 5.55% | 6.56% | 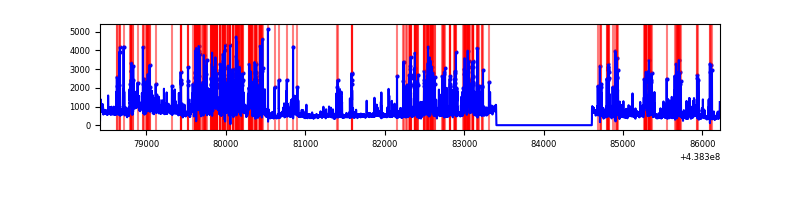 |
Top three noisy pixels from each quadrant. If the there are fewer than three noisy pixels in the level2.evt file, extra rows are filled as -1
| Pixel properties | Quadrant properties | ||||||
|---|---|---|---|---|---|---|---|
| Quadrant | DetID | PixID | Counts | Sigma | Mean | Median | Sigma |
| A | 10 | 83 | 1243565 | 7820.67 | 779 | 765 | 158.9 |
| A | 12 | 227 | 211185 | 1324.13 | 779 | 765 | 158.9 |
| A | 7 | 3 | 108435 | 677.54 | 779 | 765 | 158.9 |
| B | 12 | 111 | 19623 | 122.56 | 790 | 768 | 153.8 |
| B | 11 | 111 | 18136 | 112.89 | 790 | 768 | 153.8 |
| B | 14 | 111 | 17926 | 111.53 | 790 | 768 | 153.8 |
| C | 14 | 254 | 64429 | 352.5 | 766 | 772 | 180.6 |
| C | 11 | 16 | 10405 | 53.34 | 766 | 772 | 180.6 |
| C | 8 | 222 | 7498 | 37.24 | 766 | 772 | 180.6 |
| D | 13 | 249 | 1184852 | 6553.7 | 731 | 712 | 180.7 |
| D | 5 | 235 | 605054 | 3344.77 | 731 | 712 | 180.7 |
| D | 1 | 52 | 594767 | 3287.83 | 731 | 712 | 180.7 |
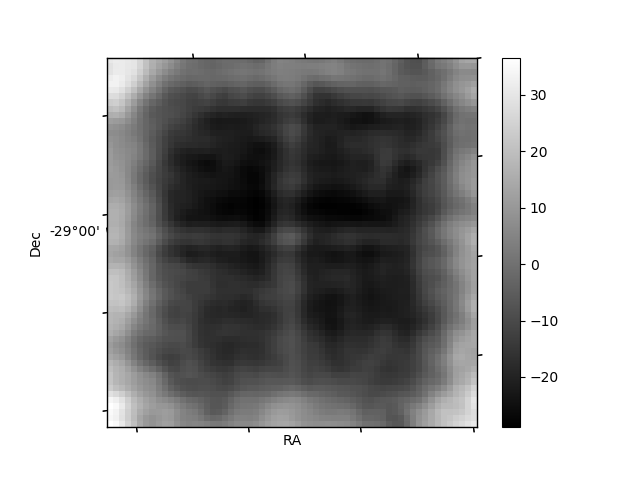
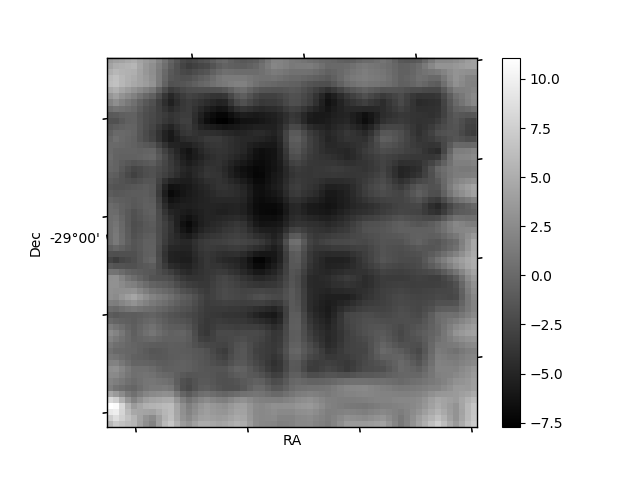
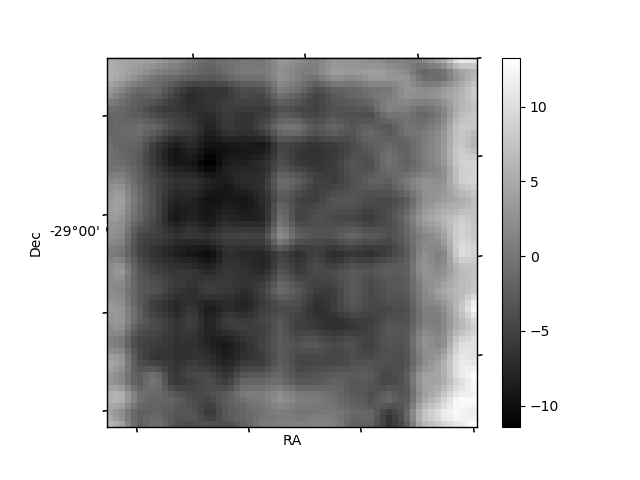
Histogram calculated using DETX and DETY for each event in the final _common_clean file
| Quadrant A | 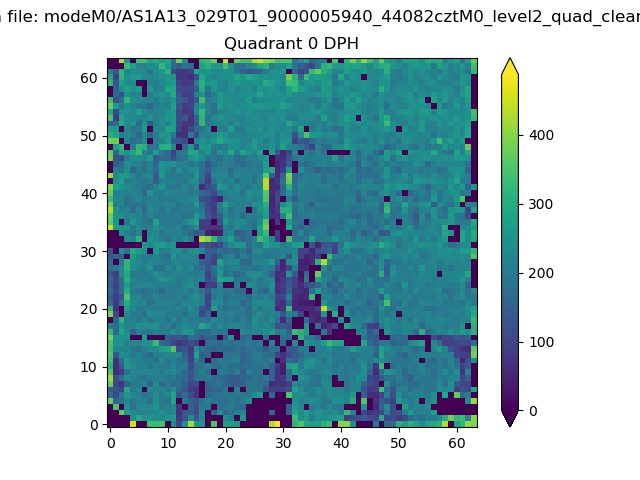 |
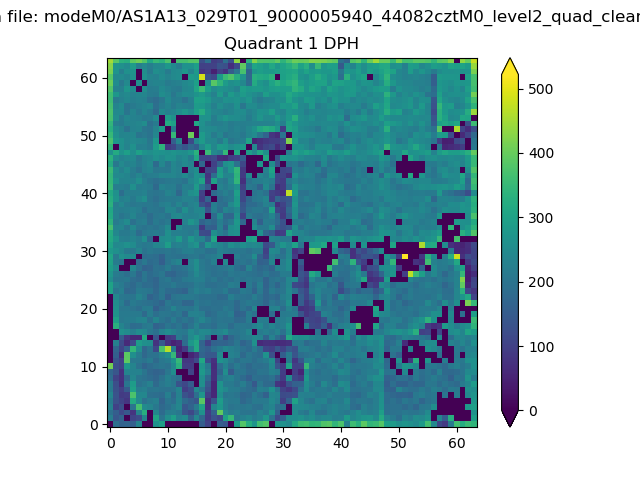 |
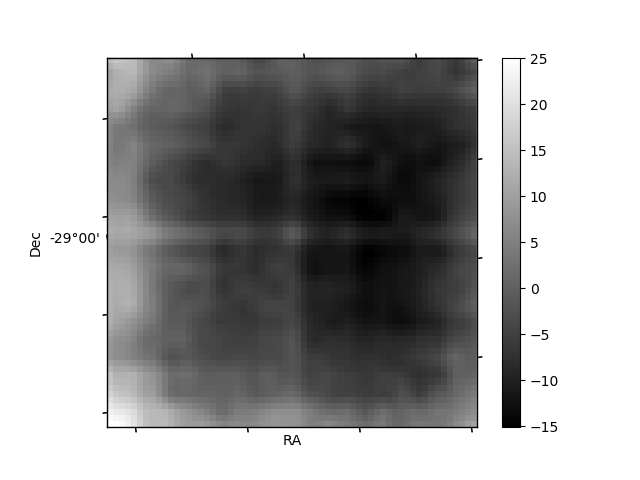
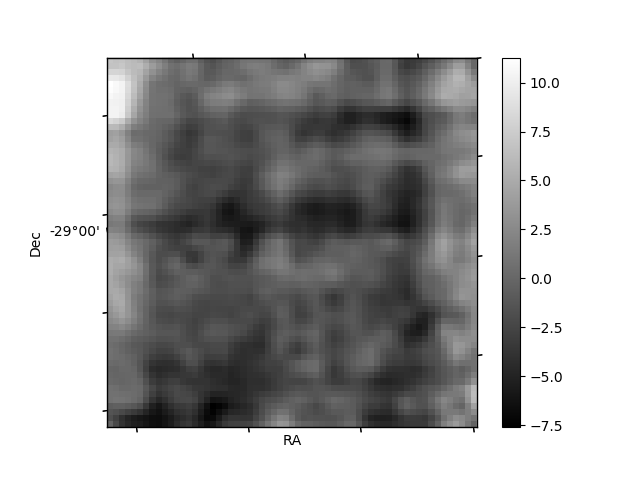
Quadrant B |
|---|---|---|---|
| Quadrant D | 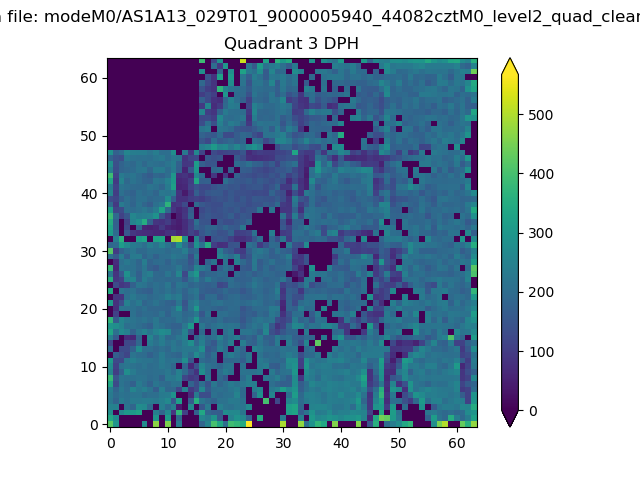 |
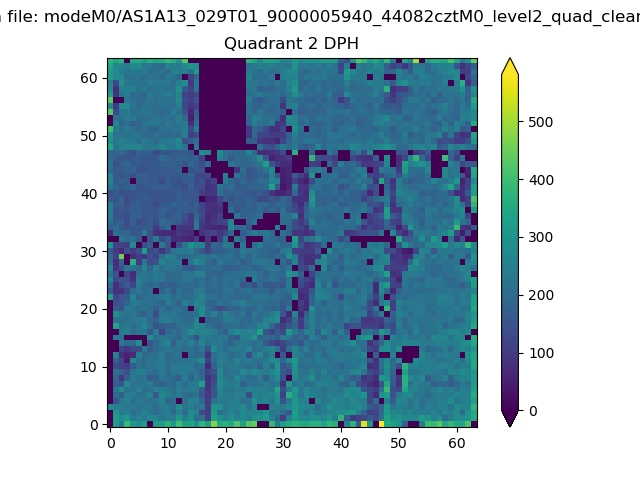 |
Quadrant C |
| Plot type | Count rate plots | Images |
|---|---|---|
| Comparison with Poisson distribution Blue bars denote a histogram of data divided into 1 sec bins. Red curve is a Poisson curve with rate = median count rate of data. |
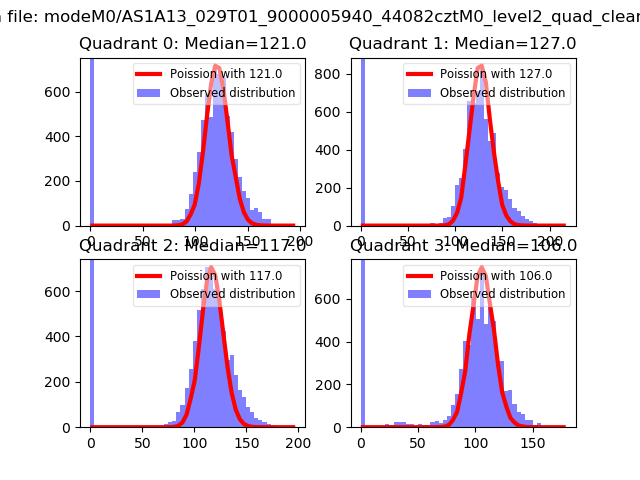 |
 |
| Quadrant-wise count rates Data is divided into 100 sec bins |
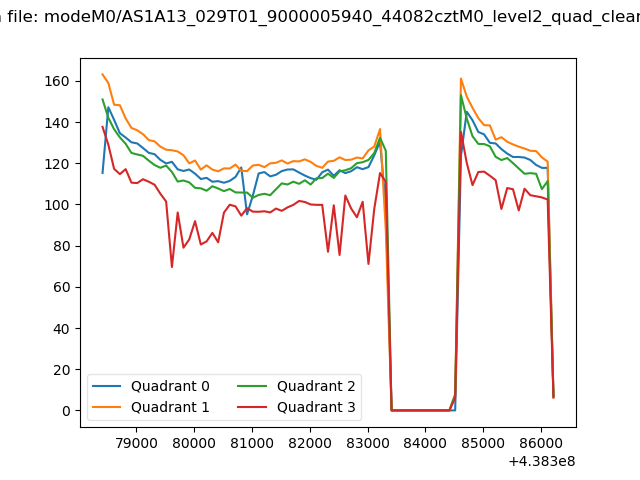 |
|
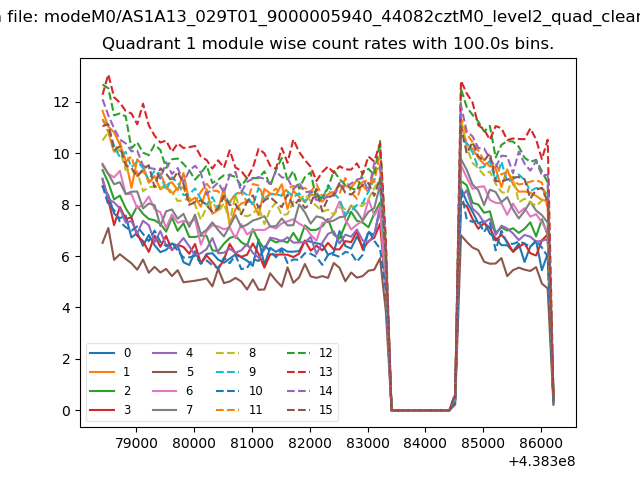
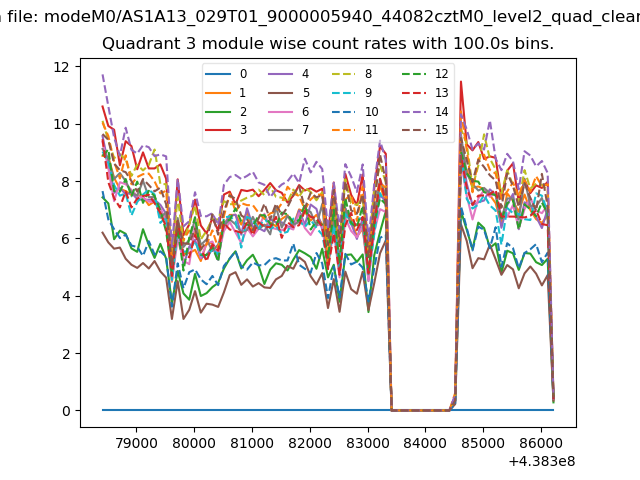
| Module-wise count rates for Quadrant A Data is divided into 100 sec bins |
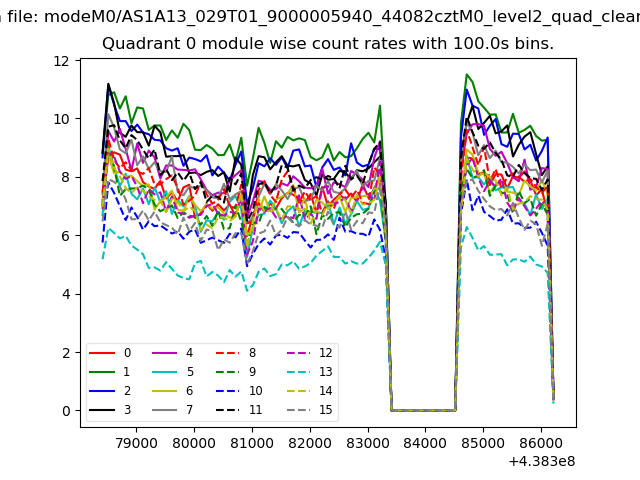 |
 |
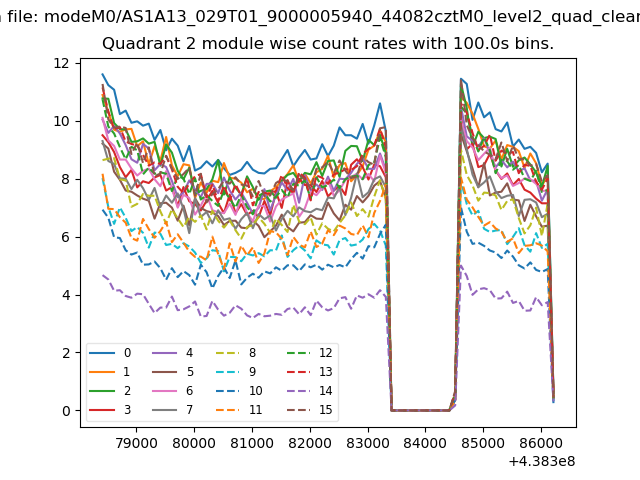
| Module-wise count rates for Quadrant B Data is divided into 100 sec bins |
 |
 |
| Module-wise count rates for Quadrant C Data is divided into 100 sec bins |
 |
 |
| Module-wise count rates for Quadrant D Data is divided into 100 sec bins |
 |
 |
| Parameter | Plot |
|---|---|
| CZT HV Monitor | 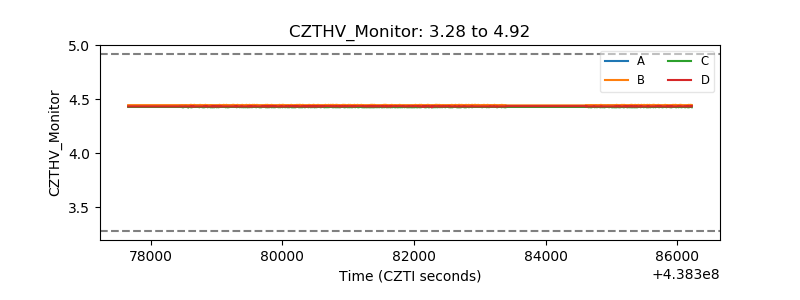 |
| D_VDD | 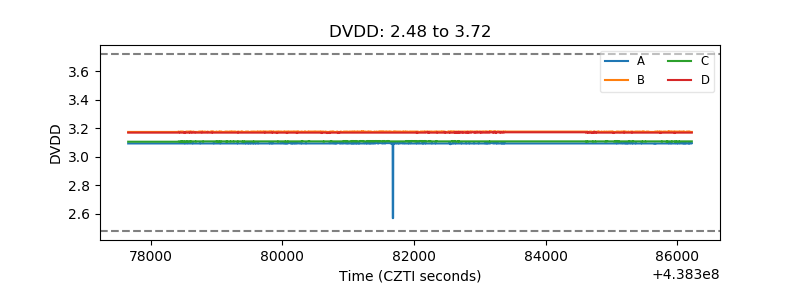 |
| Temperature 1 | 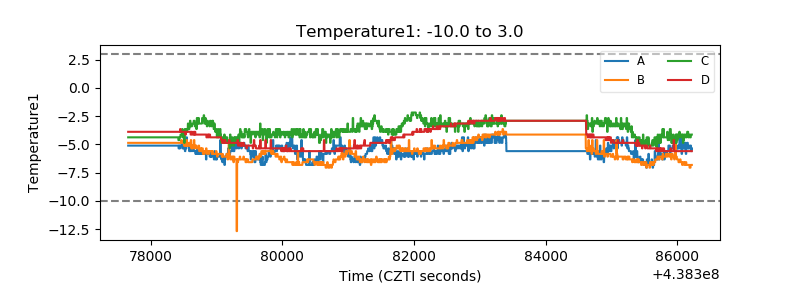 |
| Veto HV Monitor | 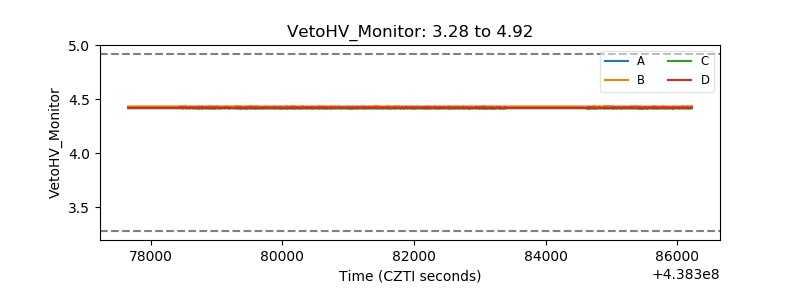 |
| Veto LLD | 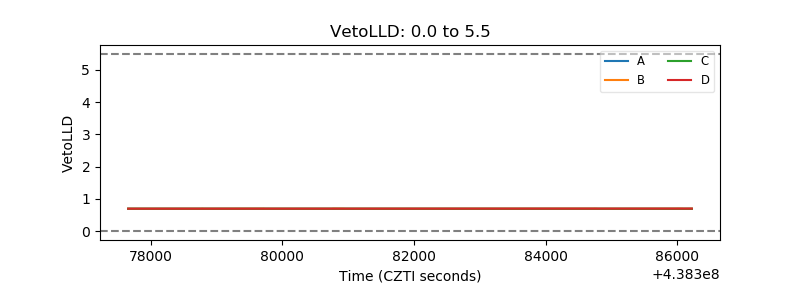 |
| Alpha Counter | 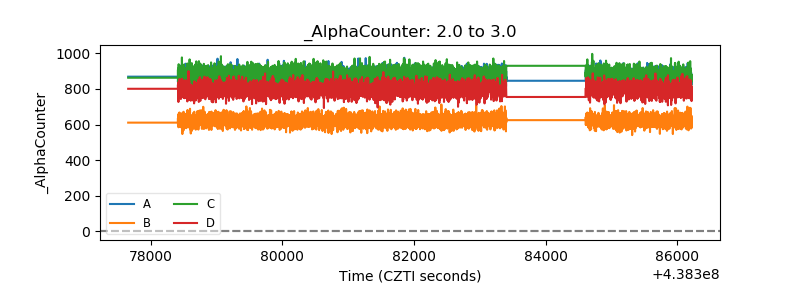 |
| _CPM_Rate | 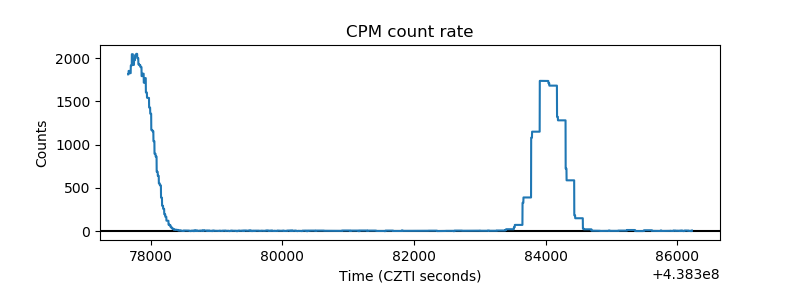 |
| CZT Counter | 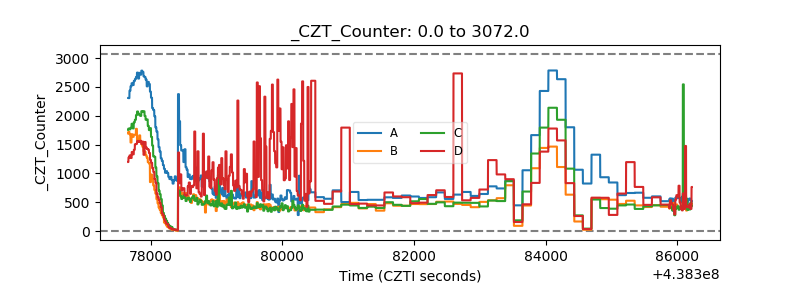 |
| +2.5 Volts monitor | 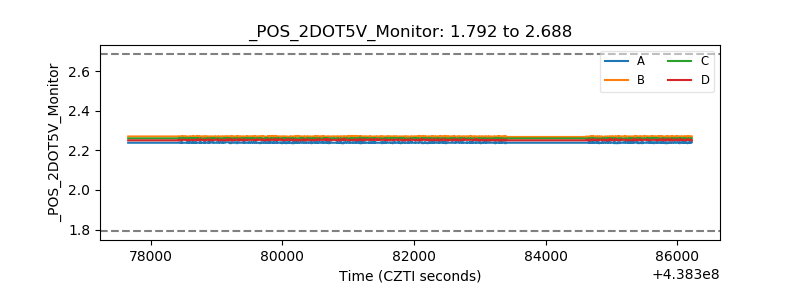 |
| +5 Volts monitor | 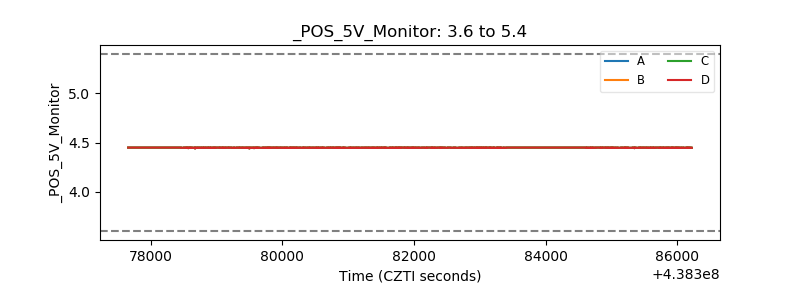 |
| _ROLL_ROT | 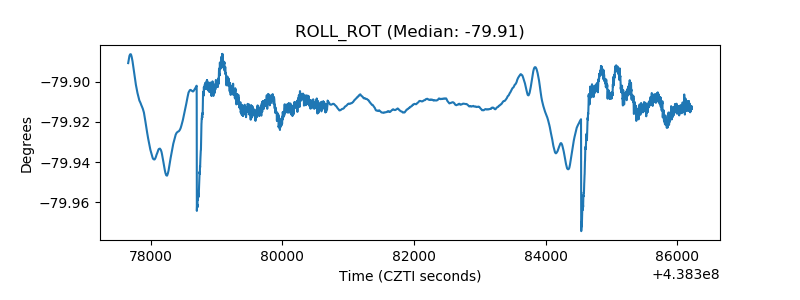 |
| _Roll_DEC | 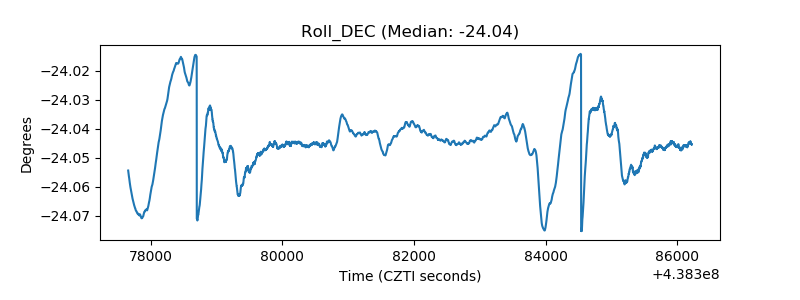 |
| _Roll_RA | 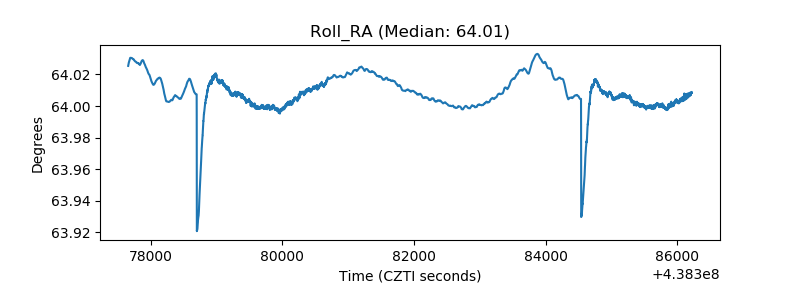 |
| Veto Counter | 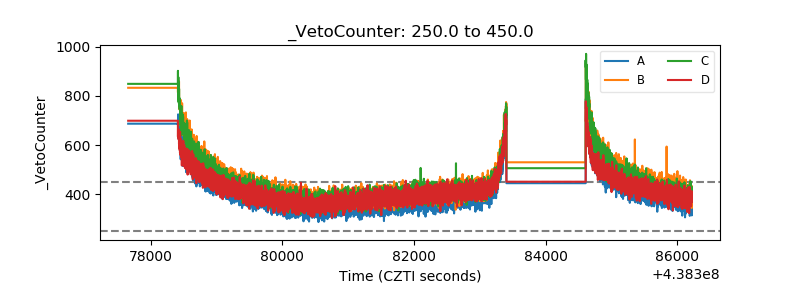 |