| Param | Original file | Final file |
|---|---|---|
| Filename | modeM0/AS1A13_029T01_9000005940_44083cztM0_level2.fits | modeM0/AS1A13_029T01_9000005940_44083cztM0_level2_quad_clean.evt |
| Size (bytes) | 395,585,280 | 99,855,360 |
| Size | 377.3 MB | 95.2 MB |
| Events in quadrant A | 3,876,172 | 678,788 |
| Events in quadrant B | 2,723,458 | 719,134 |
| Events in quadrant C | 2,734,228 | 669,109 |
| Events in quadrant D | 4,866,688 | 558,886 |
| Mode SS | |||
|---|---|---|---|
| Quadrant | BADHDUFLAG | Total packets | Discarded packets |
| A | 0 | 116 | 0 |
| B | 0 | 116 | 0 |
| C | 0 | 116 | 0 |
| D | 0 | 116 | 0 |
| Mode M0 | |||
|---|---|---|---|
| Quadrant | BADHDUFLAG | Total packets | Discarded packets |
| A | 0 | 15576 | 2 |
| B | 0 | 11854 | 2 |
| C | 0 | 11932 | 2 |
| D | 0 | 18406 | 2 |
| Mode M9 | |||
|---|---|---|---|
| Quadrant | BADHDUFLAG | Total packets | Discarded packets |
| A | 0 | 12 | 0 |
| B | 0 | 13 | 0 |
| C | 0 | 13 | 0 |
| D | 0 | 13 | 0 |
| Quadrant | Total seconds | Saturated seconds | Saturation percentage |
|---|---|---|---|
| A | 5690 | 119 | 2.091388% |
| B | 5690 | 54 | 0.949033% |
| C | 5690 | 31 | 0.544815% |
| D | 5690 | 608 | 10.685413% |
Noise dominated data is calculated using 1-second bins in cleaned event files. If a bin has >2000 counts, and if more than 50% of those come from <1% of pixels, then it is considered to be noise-dominated and hence unusable.
| Quadrant | # 1 sec bins | Bins with >0 counts | Bins with >2000 counts | High rate bins dominated by noise | Noise dominated (total time) | Noise dominated (detector-on time) | Marked lightcurve |
|---|---|---|---|---|---|---|---|
| A | 6890 | 5691 | 13 | 13 | 0.19% | 0.23% | 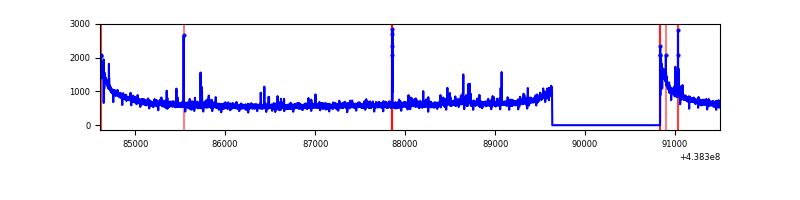 |
| B | 6890 | 5691 | 1 | 1 | 0.01% | 0.02% | 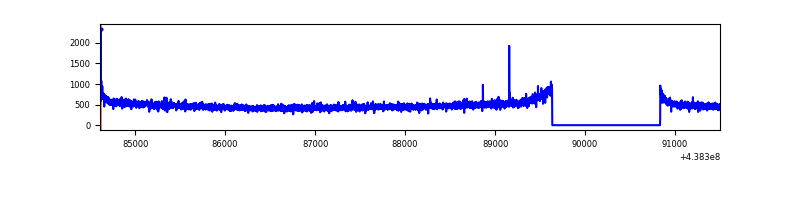 |
| C | 6890 | 5691 | 8 | 8 | 0.12% | 0.14% | 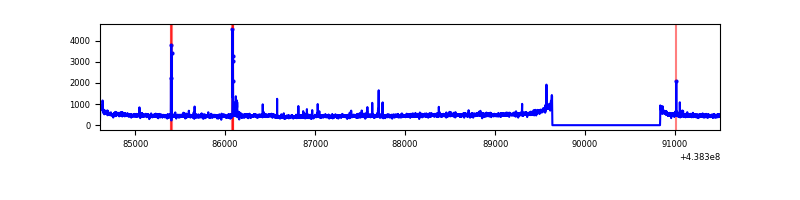 |
| D | 6890 | 5691 | 468 | 468 | 6.79% | 8.22% | 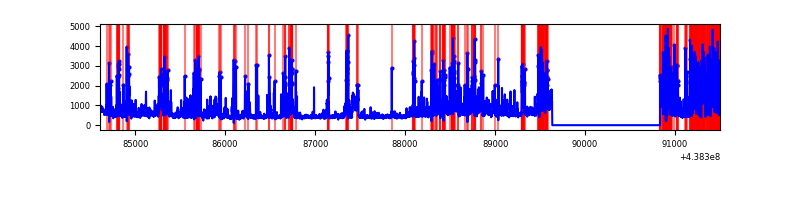 |
Top three noisy pixels from each quadrant. If the there are fewer than three noisy pixels in the level2.evt file, extra rows are filled as -1
| Pixel properties | Quadrant properties | ||||||
|---|---|---|---|---|---|---|---|
| Quadrant | DetID | PixID | Counts | Sigma | Mean | Median | Sigma |
| A | 10 | 83 | 1129333 | 8050.81 | 682 | 670 | 140.2 |
| A | 15 | 222 | 42000 | 294.81 | 682 | 670 | 140.2 |
| A | 12 | 227 | 22895 | 158.53 | 682 | 670 | 140.2 |
| B | 12 | 111 | 17176 | 123.17 | 686 | 666 | 134.0 |
| B | 11 | 111 | 15722 | 112.32 | 686 | 666 | 134.0 |
| B | 14 | 111 | 15685 | 112.04 | 686 | 666 | 134.0 |
| C | 14 | 254 | 70267 | 437.57 | 670 | 674 | 159.0 |
| C | 8 | 222 | 26022 | 159.38 | 670 | 674 | 159.0 |
| C | 11 | 16 | 10040 | 58.89 | 670 | 674 | 159.0 |
| D | 1 | 52 | 977902 | 6151.5 | 633 | 614 | 158.9 |
| D | 13 | 249 | 595794 | 3746.33 | 633 | 614 | 158.9 |
| D | 5 | 235 | 340005 | 2136.28 | 633 | 614 | 158.9 |
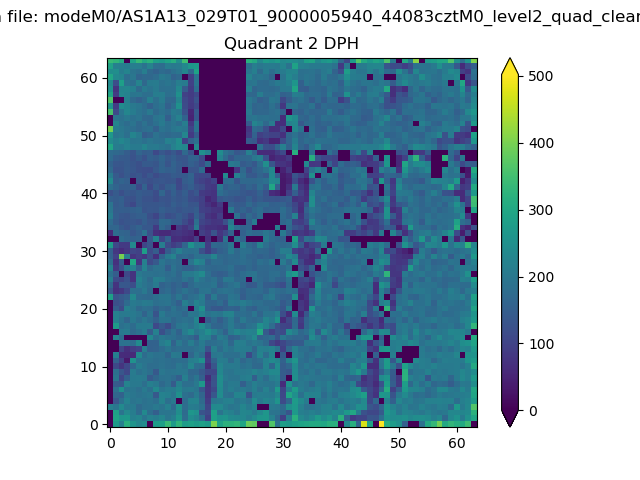
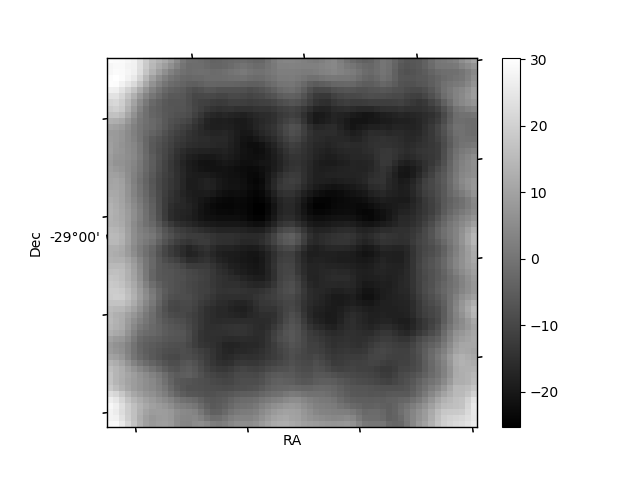
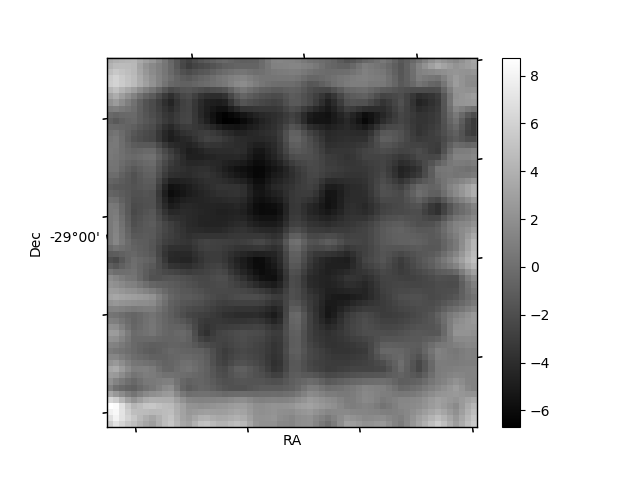
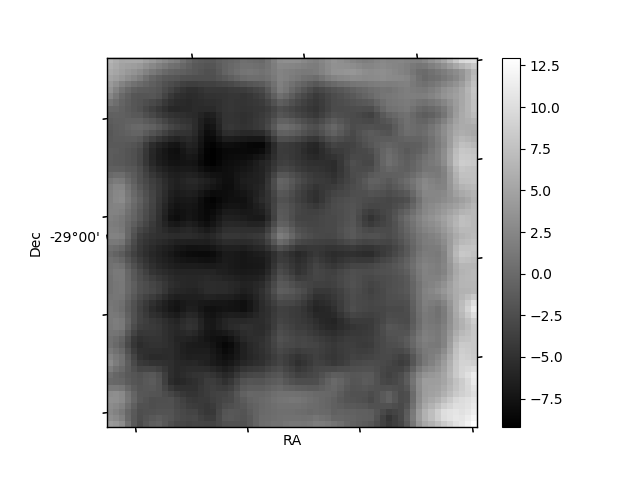
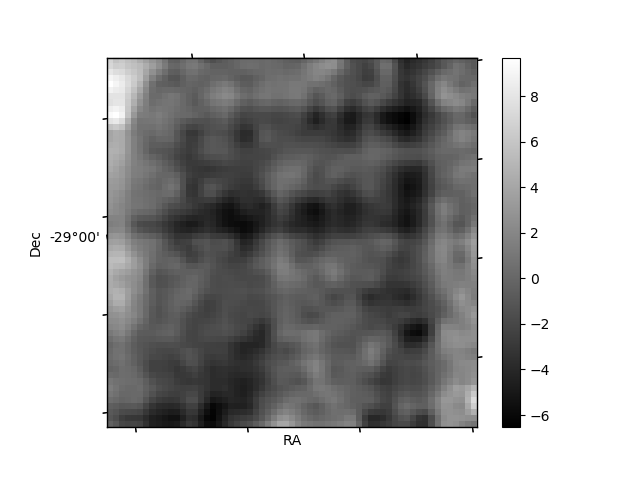
Histogram calculated using DETX and DETY for each event in the final _common_clean file
| Quadrant A | 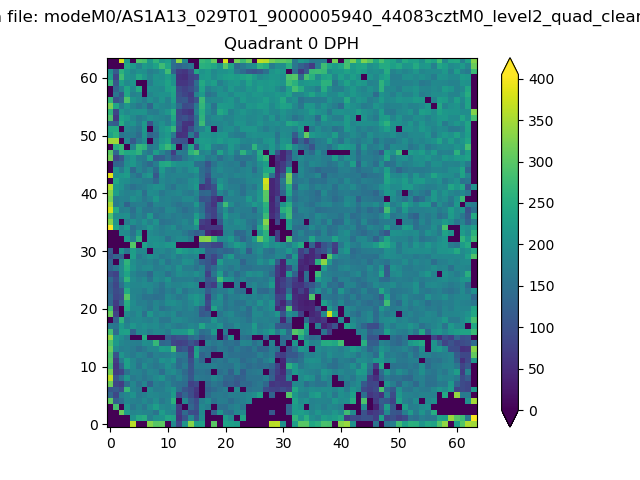 |
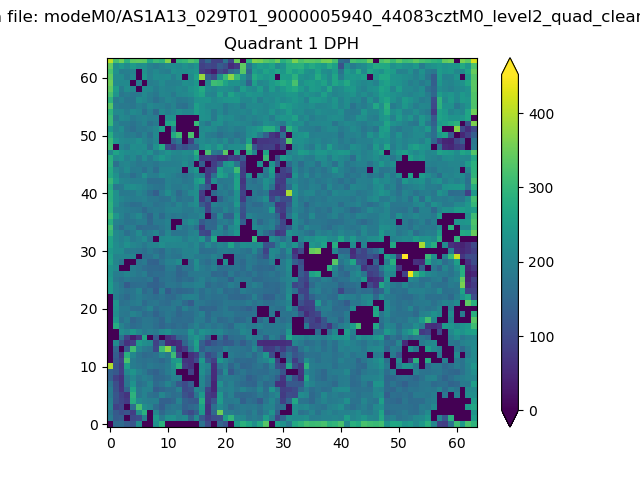 |
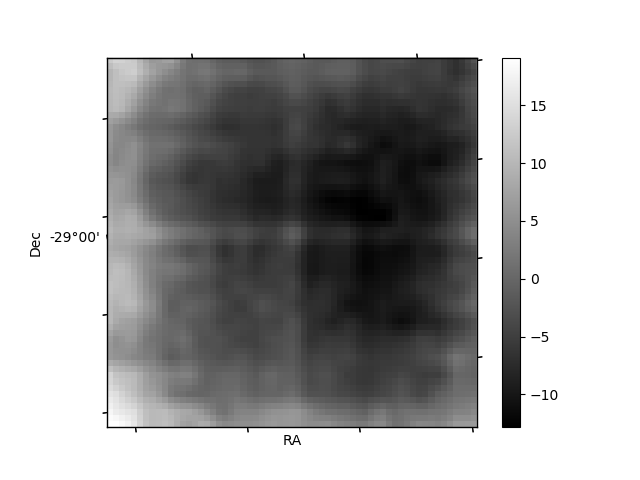
Quadrant B |
|---|---|---|---|
| Quadrant D | 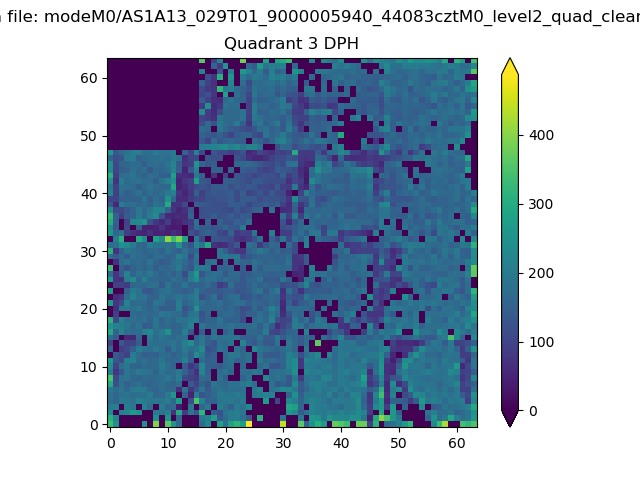 |
 |
Quadrant C |
| Plot type | Count rate plots | Images |
|---|---|---|
| Comparison with Poisson distribution Blue bars denote a histogram of data divided into 1 sec bins. Red curve is a Poisson curve with rate = median count rate of data. |
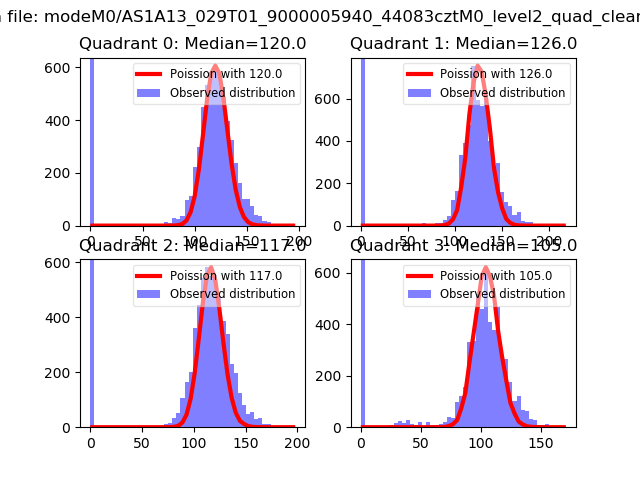 |
 |
| Quadrant-wise count rates Data is divided into 100 sec bins |
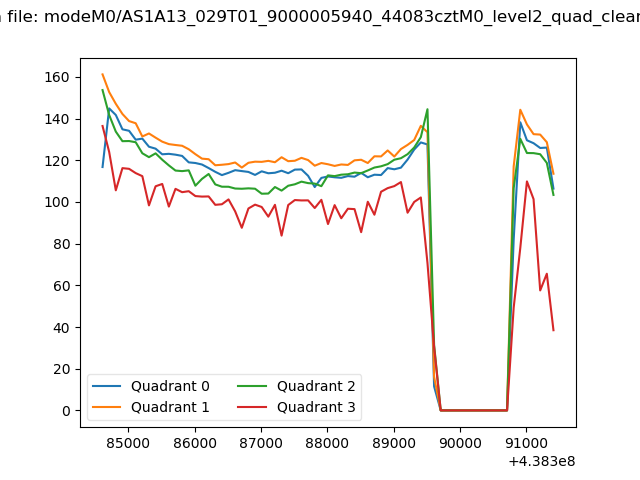 |
|
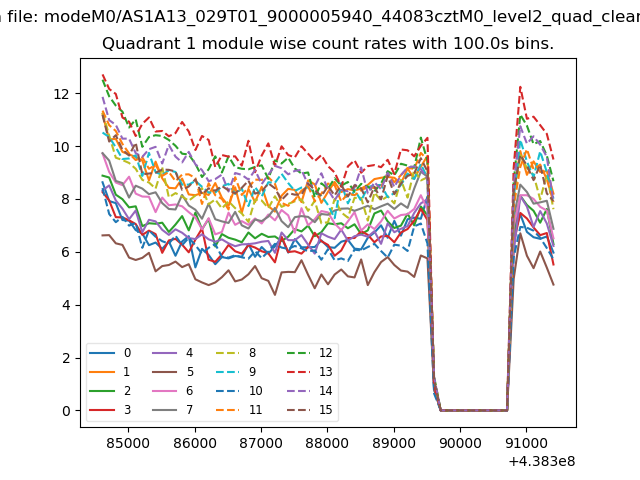
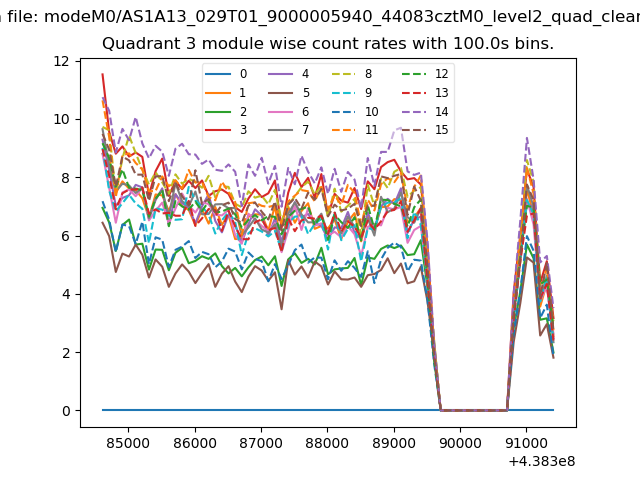
| Module-wise count rates for Quadrant A Data is divided into 100 sec bins |
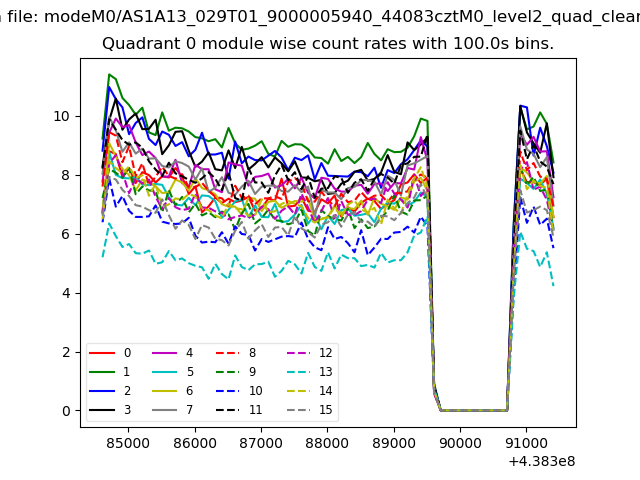 |
 |
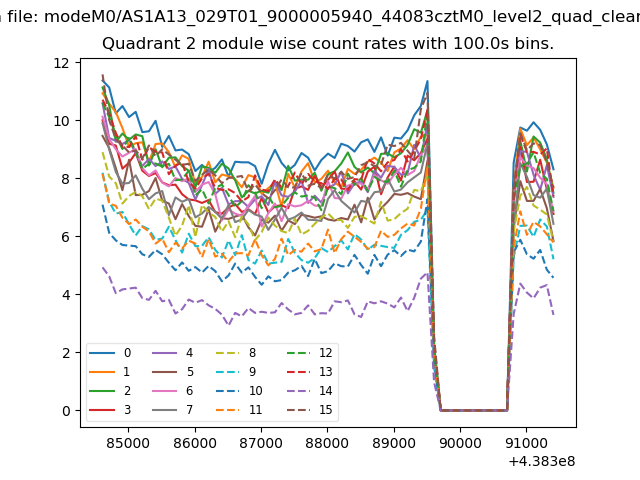
| Module-wise count rates for Quadrant B Data is divided into 100 sec bins |
 |
 |
| Module-wise count rates for Quadrant C Data is divided into 100 sec bins |
 |
 |
| Module-wise count rates for Quadrant D Data is divided into 100 sec bins |
 |
 |
| Parameter | Plot |
|---|---|
| CZT HV Monitor | 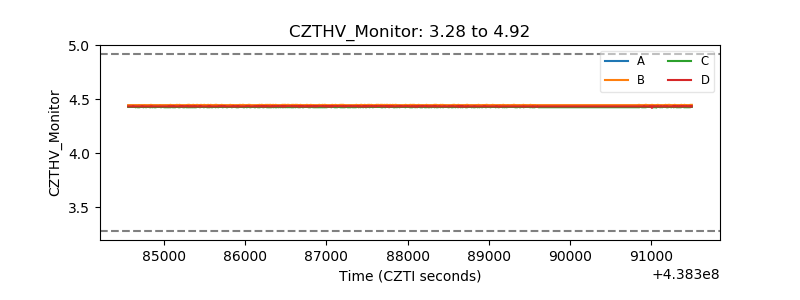 |
| D_VDD | 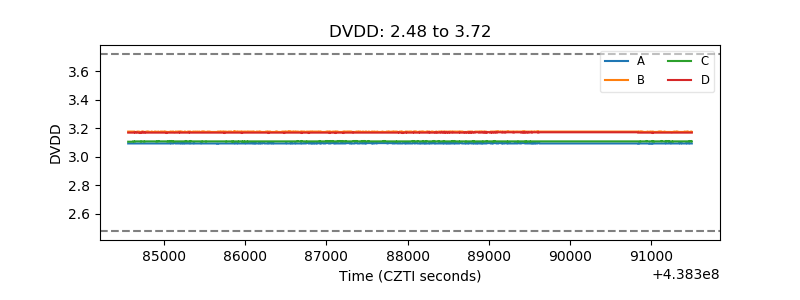 |
| Temperature 1 | 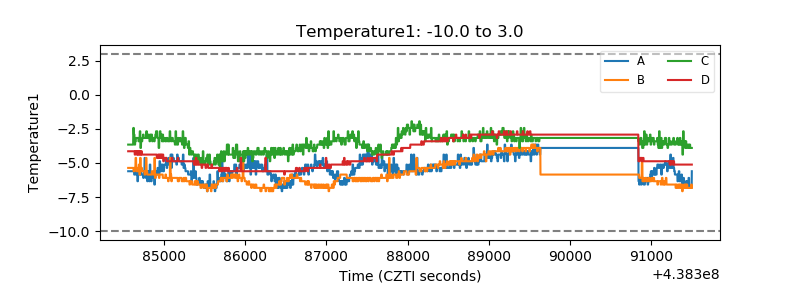 |
| Veto HV Monitor | 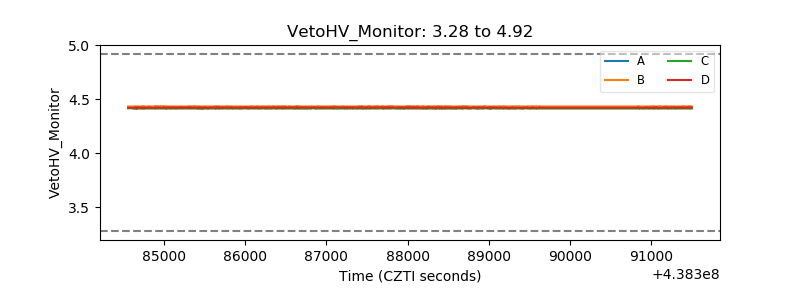 |
| Veto LLD | 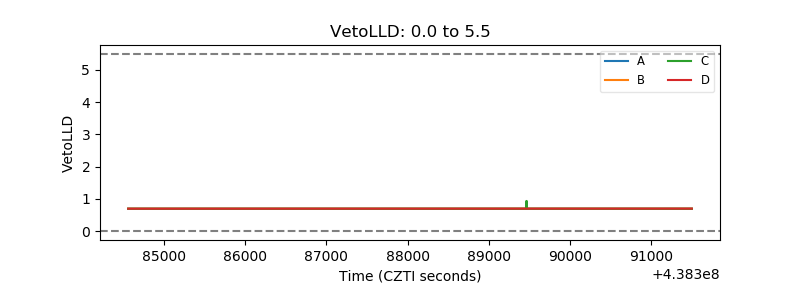 |
| Alpha Counter | 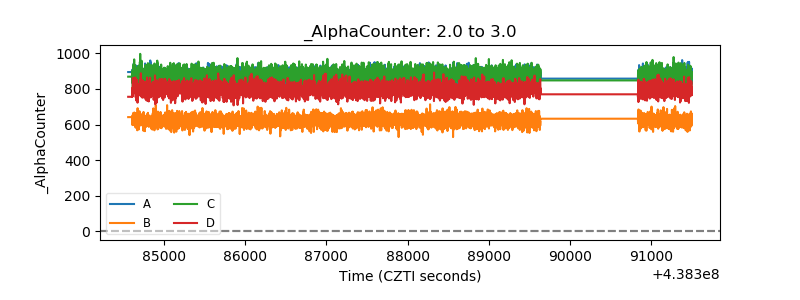 |
| _CPM_Rate | 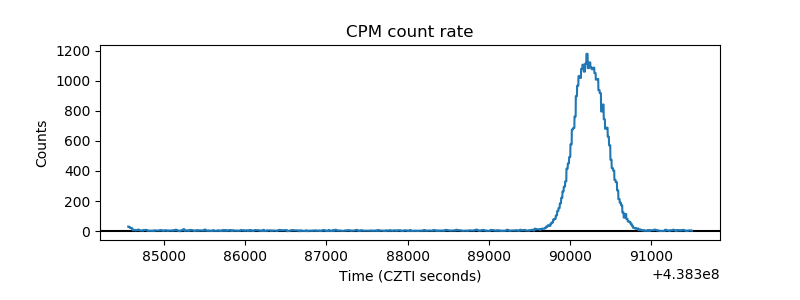 |
| CZT Counter | 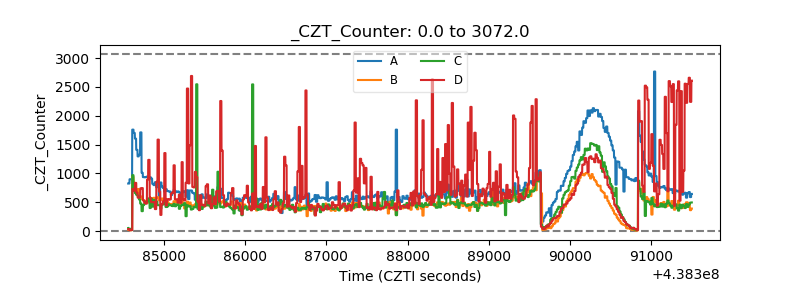 |
| +2.5 Volts monitor | 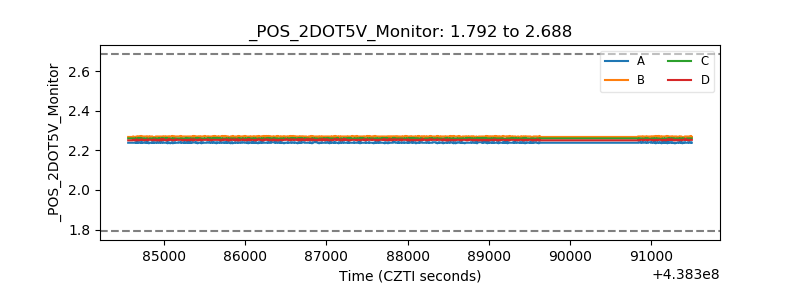 |
| +5 Volts monitor | 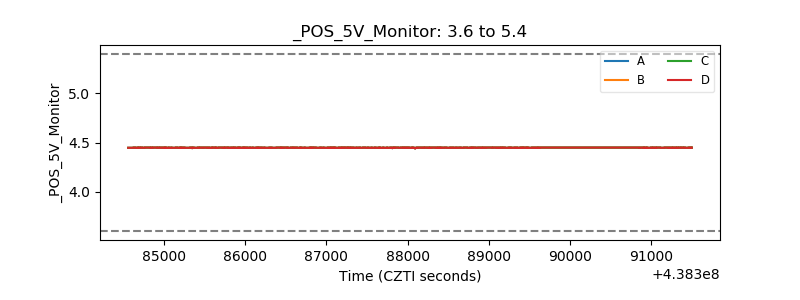 |
| _ROLL_ROT | 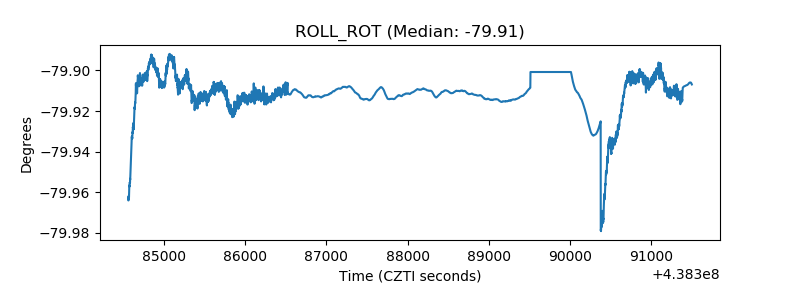 |
| _Roll_DEC | 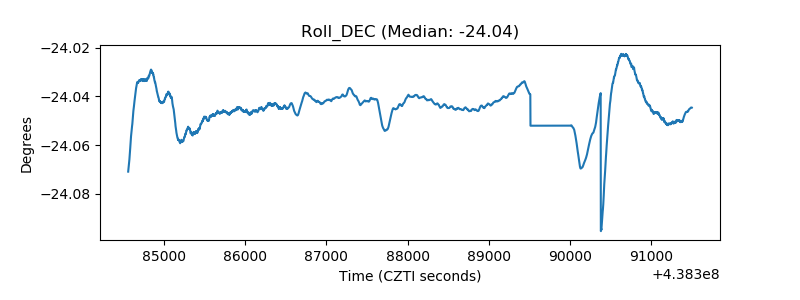 |
| _Roll_RA | 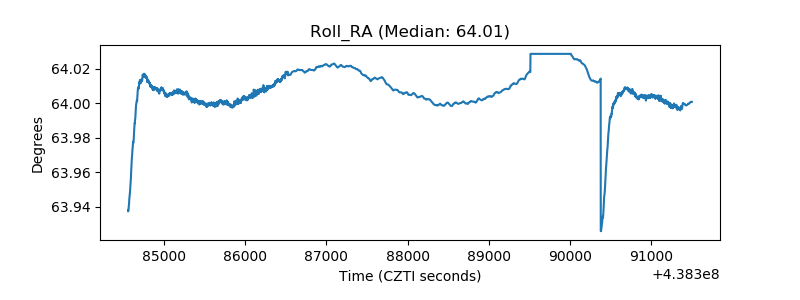 |
| Veto Counter | 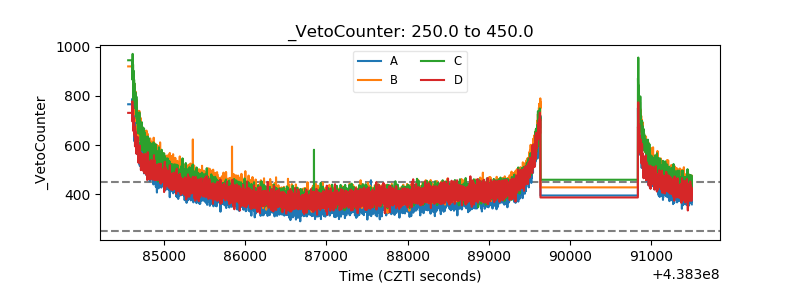 |