| Param | Original file | Final file |
|---|---|---|
| Filename | modeM0/AS1A13_012T01_9000005942_44085cztM0_level2.fits | modeM0/AS1A13_012T01_9000005942_44085cztM0_level2_quad_clean.evt |
| Size (bytes) | 420,091,200 | 114,209,280 |
| Size | 400.6 MB | 108.9 MB |
| Events in quadrant A | 4,608,703 | 756,499 |
| Events in quadrant B | 3,112,528 | 797,295 |
| Events in quadrant C | 3,108,821 | 747,695 |
| Events in quadrant D | 4,186,025 | 677,679 |
| Mode M9 | |||
|---|---|---|---|
| Quadrant | BADHDUFLAG | Total packets | Discarded packets |
| A | 0 | 10 | 0 |
| B | 0 | 11 | 0 |
| C | 0 | 11 | 0 |
| D | 0 | 11 | 0 |
| Mode M0 | |||
|---|---|---|---|
| Quadrant | BADHDUFLAG | Total packets | Discarded packets |
| A | 0 | 18506 | 2 |
| B | 0 | 14010 | 2 |
| C | 0 | 14168 | 2 |
| D | 0 | 17189 | 2 |
| Mode SS | |||
|---|---|---|---|
| Quadrant | BADHDUFLAG | Total packets | Discarded packets |
| A | 0 | 140 | 0 |
| B | 0 | 140 | 0 |
| C | 0 | 140 | 0 |
| D | 0 | 140 | 0 |
| Quadrant | Total seconds | Saturated seconds | Saturation percentage |
|---|---|---|---|
| A | 6874 | 109 | 1.585685% |
| B | 6874 | 36 | 0.523713% |
| C | 6873 | 24 | 0.349192% |
| D | 6873 | 157 | 2.284301% |
Noise dominated data is calculated using 1-second bins in cleaned event files. If a bin has >2000 counts, and if more than 50% of those come from <1% of pixels, then it is considered to be noise-dominated and hence unusable.
| Quadrant | # 1 sec bins | Bins with >0 counts | Bins with >2000 counts | High rate bins dominated by noise | Noise dominated (total time) | Noise dominated (detector-on time) | Marked lightcurve |
|---|---|---|---|---|---|---|---|
| A | 7714 | 6875 | 17 | 17 | 0.22% | 0.25% | 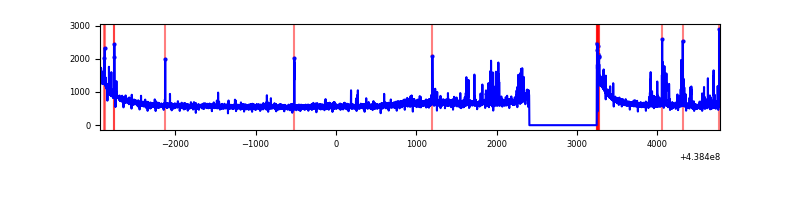 |
| B | 7714 | 6875 | 0 | 0 | 0.00% | 0.00% | 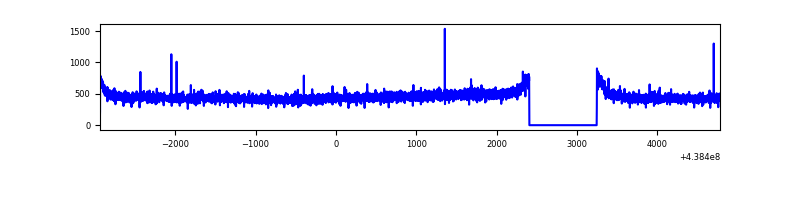 |
| C | 7713 | 6874 | 1 | 1 | 0.01% | 0.01% | 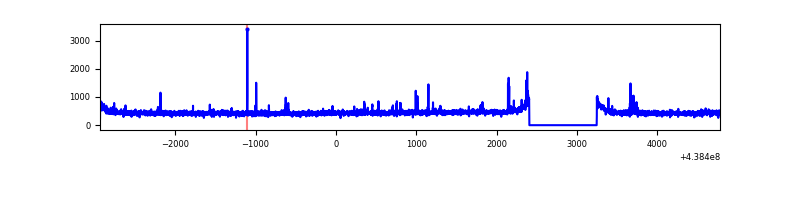 |
| D | 7713 | 6874 | 122 | 122 | 1.58% | 1.77% | 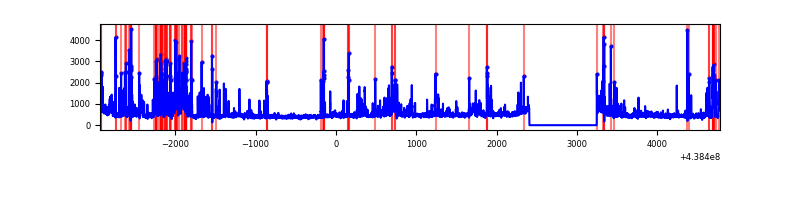 |
Top three noisy pixels from each quadrant. If the there are fewer than three noisy pixels in the level2.evt file, extra rows are filled as -1
| Pixel properties | Quadrant properties | ||||||
|---|---|---|---|---|---|---|---|
| Quadrant | DetID | PixID | Counts | Sigma | Mean | Median | Sigma |
| A | 10 | 83 | 1302733 | 8101.4 | 778 | 764 | 160.7 |
| A | 15 | 222 | 196910 | 1220.5 | 778 | 764 | 160.7 |
| A | 7 | 3 | 92279 | 569.44 | 778 | 764 | 160.7 |
| B | 12 | 111 | 20203 | 125.9 | 785 | 760 | 154.4 |
| B | 11 | 111 | 18614 | 115.61 | 785 | 760 | 154.4 |
| B | 14 | 111 | 18531 | 115.08 | 785 | 760 | 154.4 |
| C | 14 | 96 | 42340 | 225.24 | 773 | 777 | 184.5 |
| C | 14 | 254 | 37343 | 198.16 | 773 | 777 | 184.5 |
| C | 9 | 237 | 8459 | 41.63 | 773 | 777 | 184.5 |
| D | 13 | 249 | 501624 | 2654.56 | 759 | 739 | 188.7 |
| D | 1 | 52 | 467470 | 2473.55 | 759 | 739 | 188.7 |
| D | 2 | 249 | 155907 | 822.35 | 759 | 739 | 188.7 |
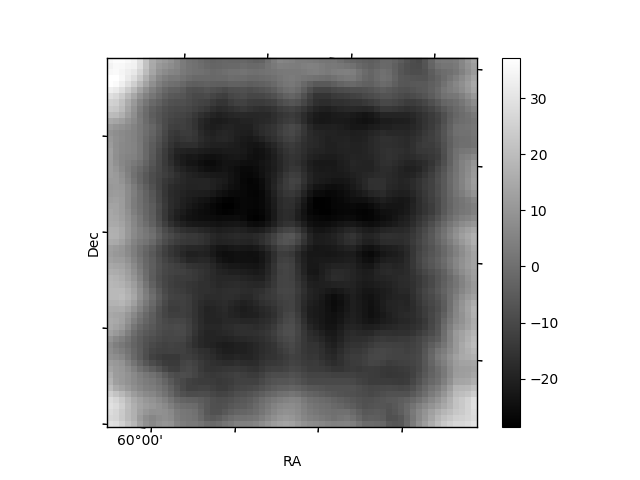
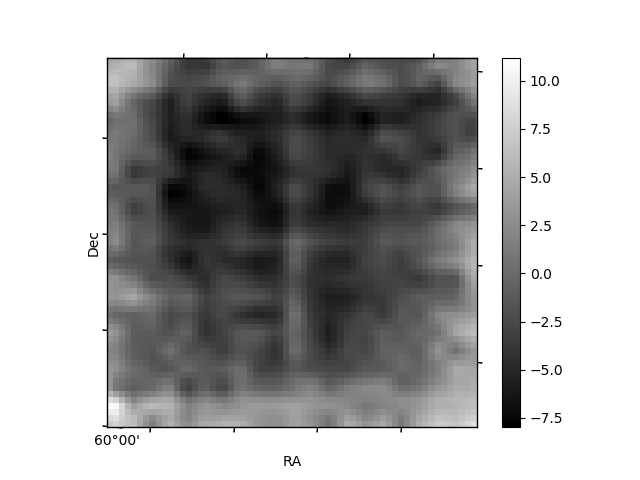
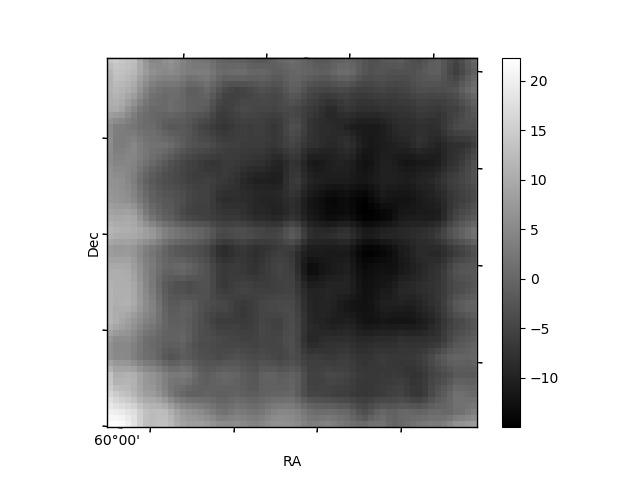
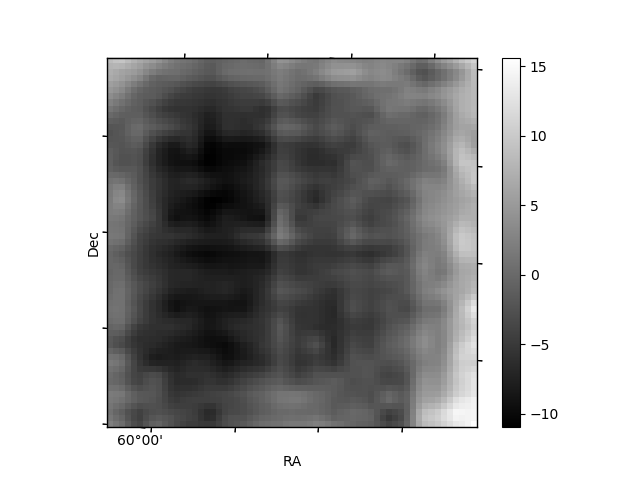
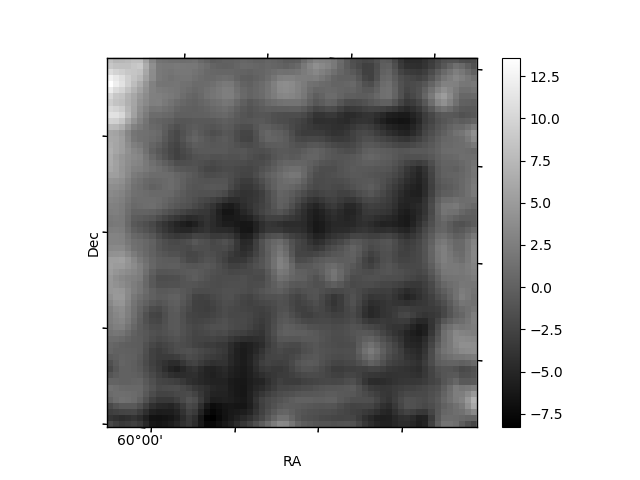
Histogram calculated using DETX and DETY for each event in the final _common_clean file
| Quadrant A | 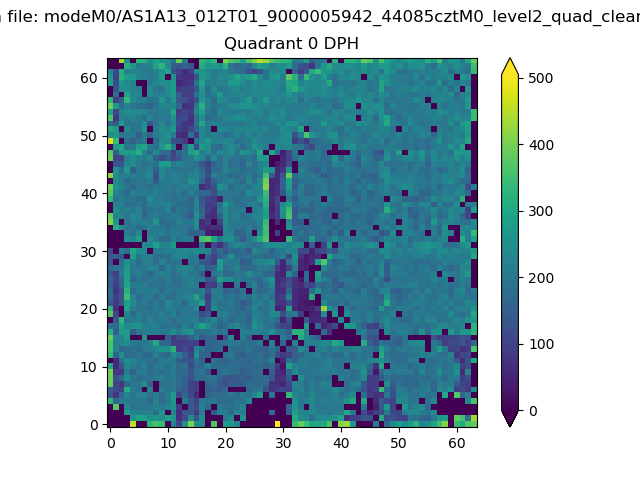 |
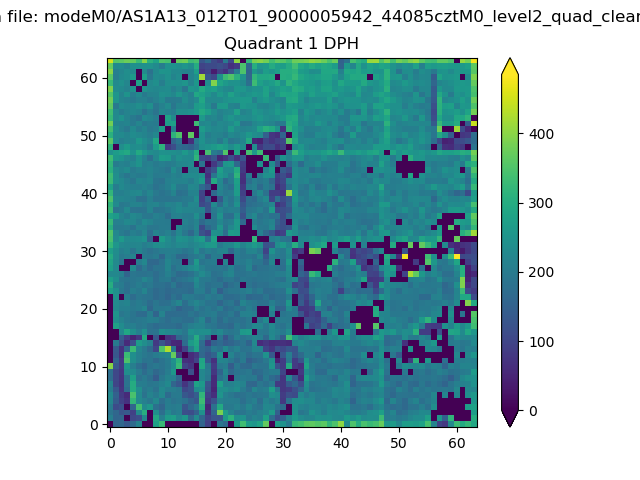 |
Quadrant B |
|---|---|---|---|
| Quadrant D | 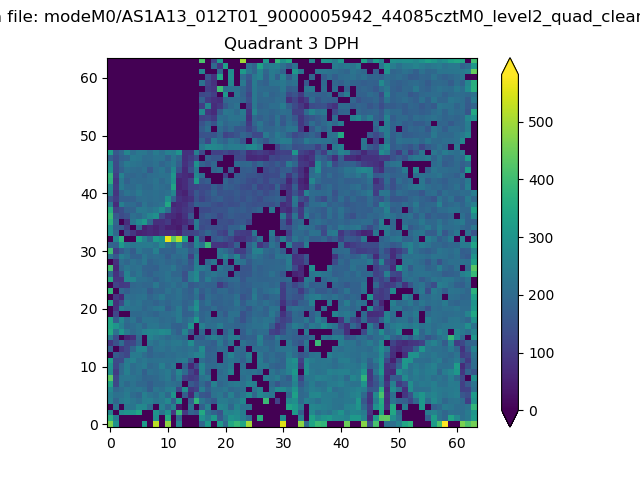 |
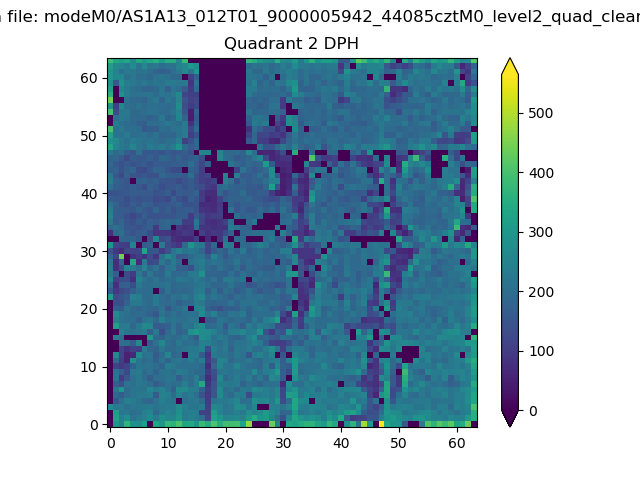 |
Quadrant C |
| Plot type | Count rate plots | Images |
|---|---|---|
| Comparison with Poisson distribution Blue bars denote a histogram of data divided into 1 sec bins. Red curve is a Poisson curve with rate = median count rate of data. |
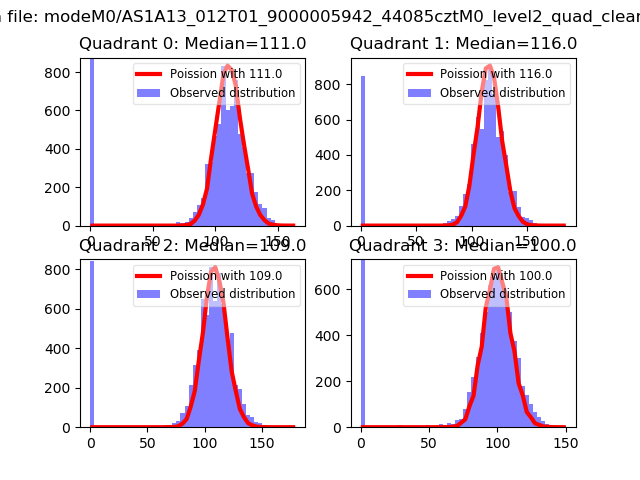 |
 |
| Quadrant-wise count rates Data is divided into 100 sec bins |
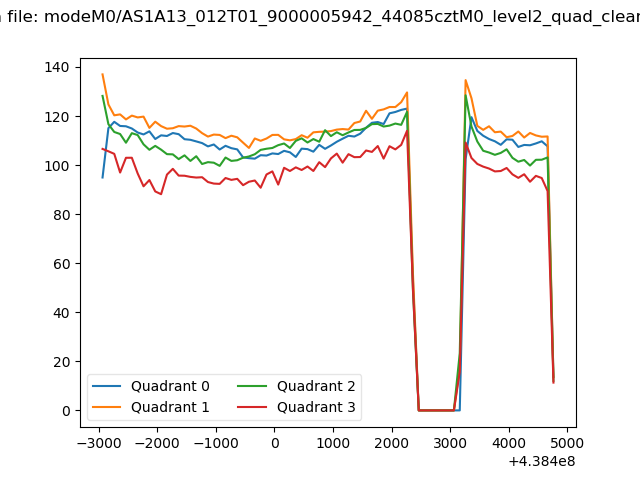 |
|
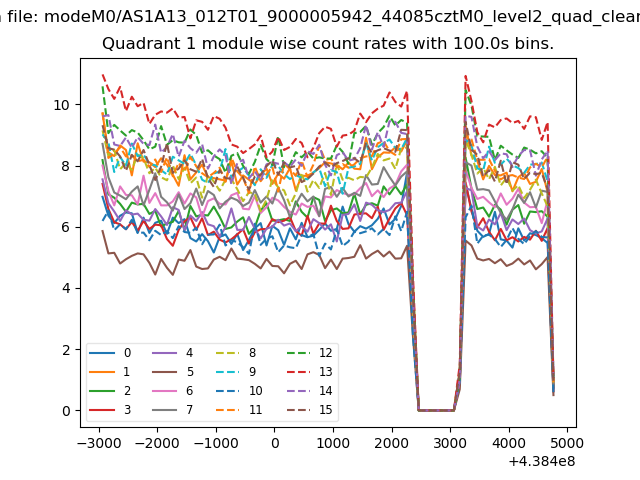
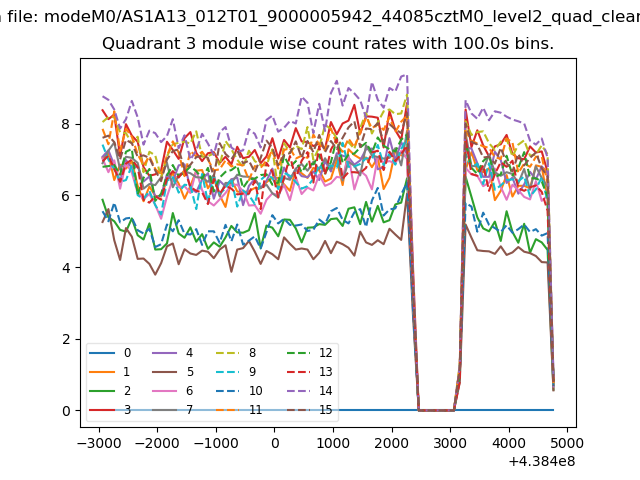
| Module-wise count rates for Quadrant A Data is divided into 100 sec bins |
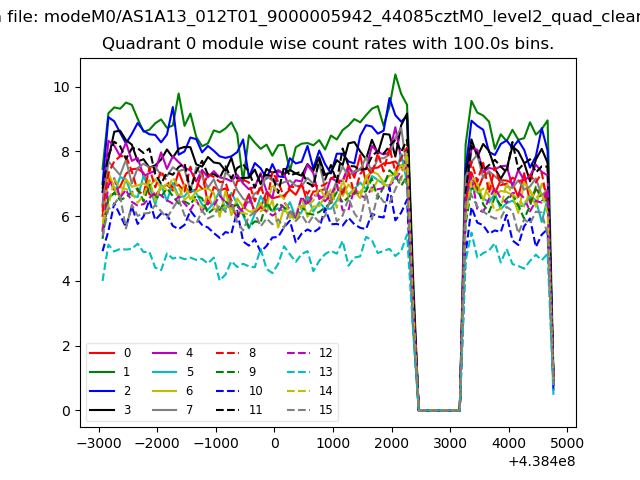 |
 |
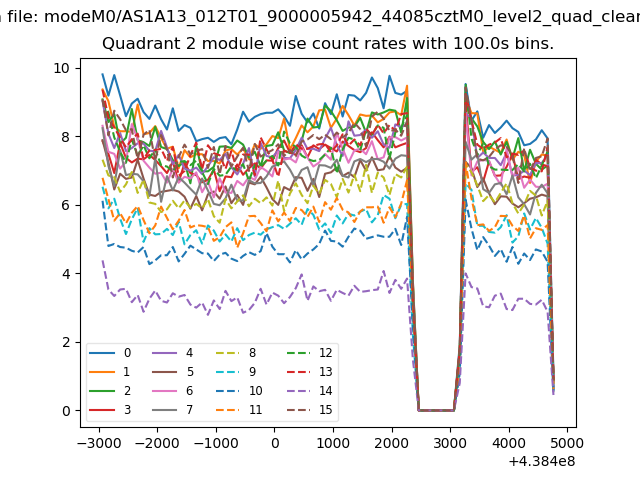
| Module-wise count rates for Quadrant B Data is divided into 100 sec bins |
 |
 |
| Module-wise count rates for Quadrant C Data is divided into 100 sec bins |
 |
 |
| Module-wise count rates for Quadrant D Data is divided into 100 sec bins |
 |
 |
| Parameter | Plot |
|---|---|
| CZT HV Monitor | 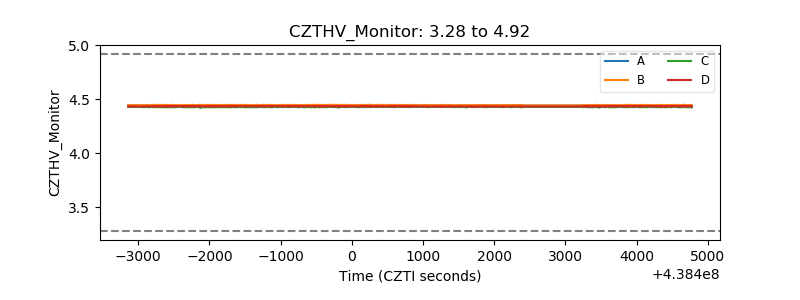 |
| D_VDD | 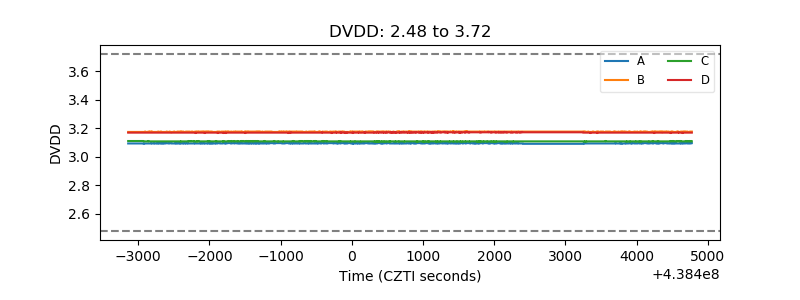 |
| Temperature 1 | 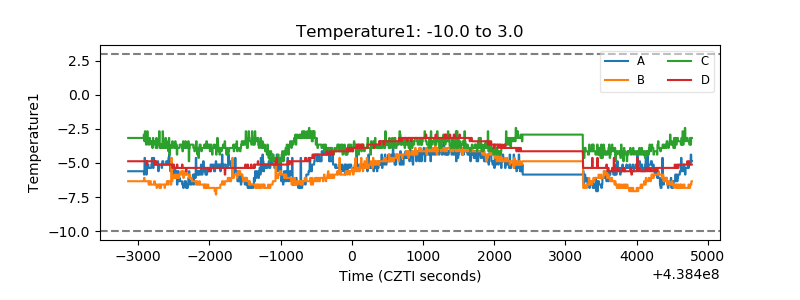 |
| Veto HV Monitor | 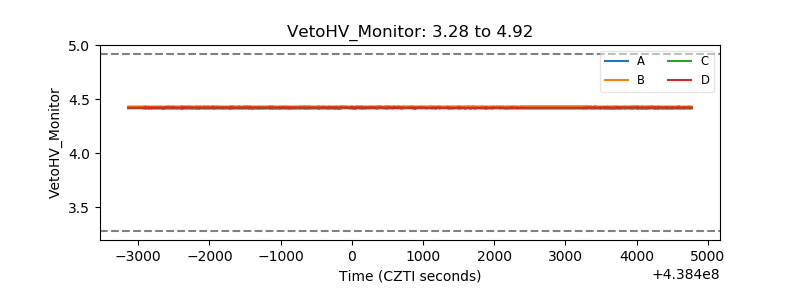 |
| Veto LLD | 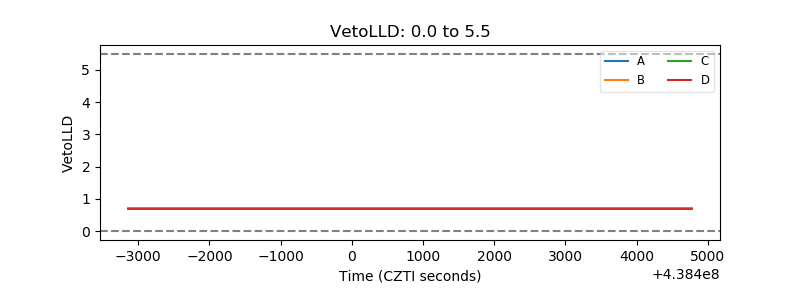 |
| Alpha Counter | 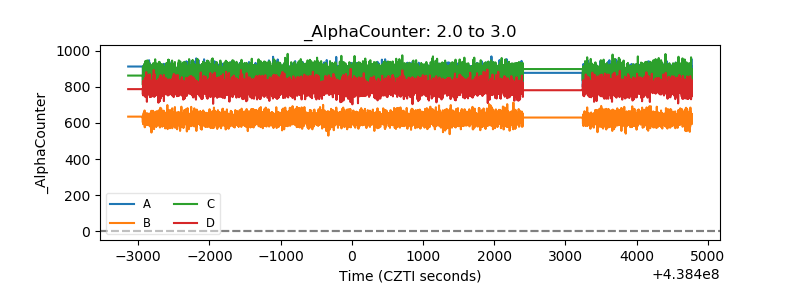 |
| _CPM_Rate | 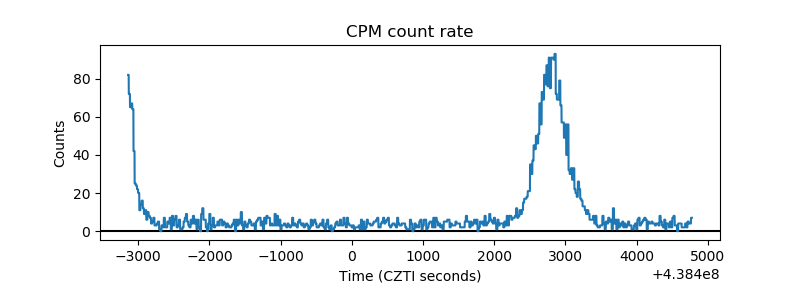 |
| CZT Counter | 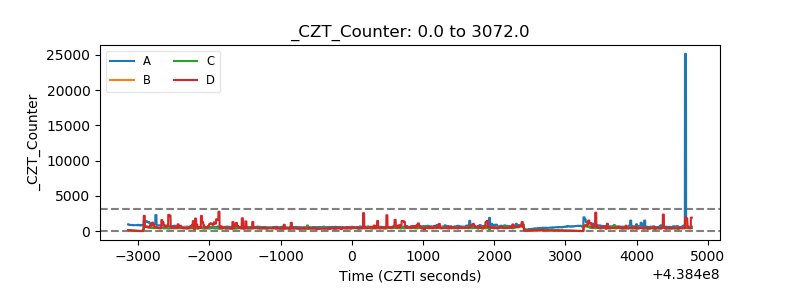 |
| +2.5 Volts monitor | 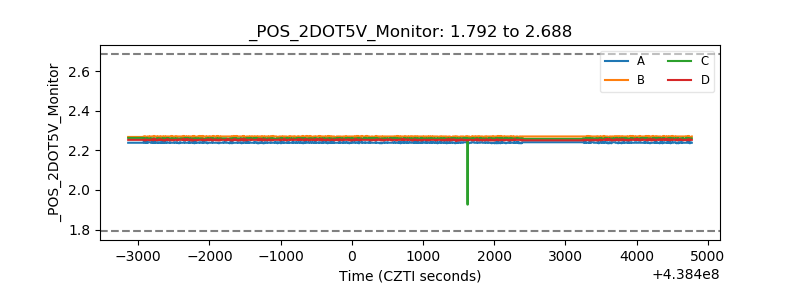 |
| +5 Volts monitor | 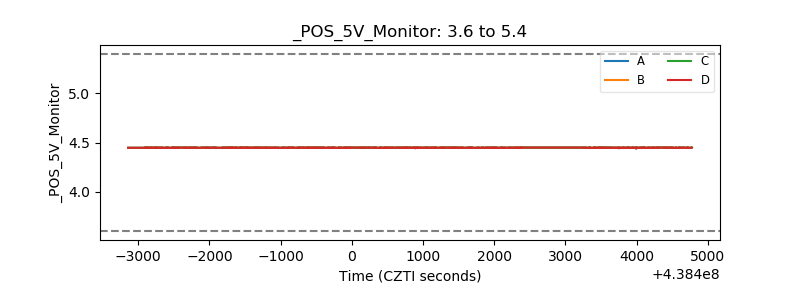 |
| _ROLL_ROT | 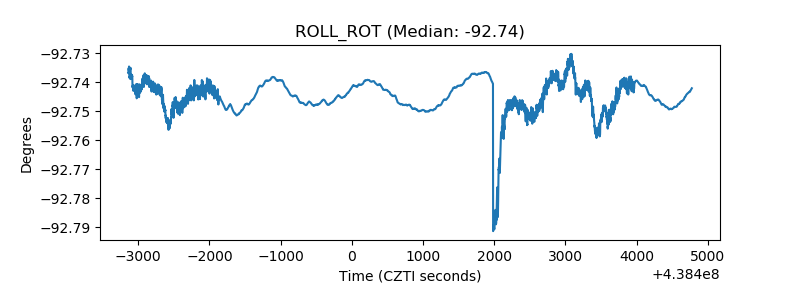 |
| _Roll_DEC | 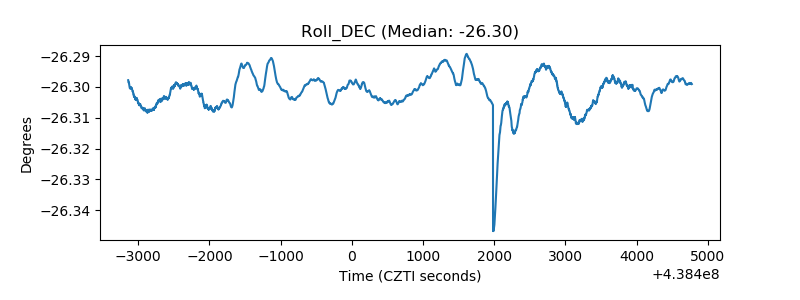 |
| _Roll_RA | 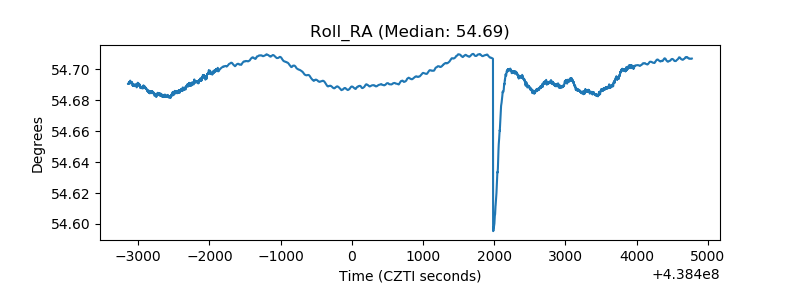 |
| Veto Counter | 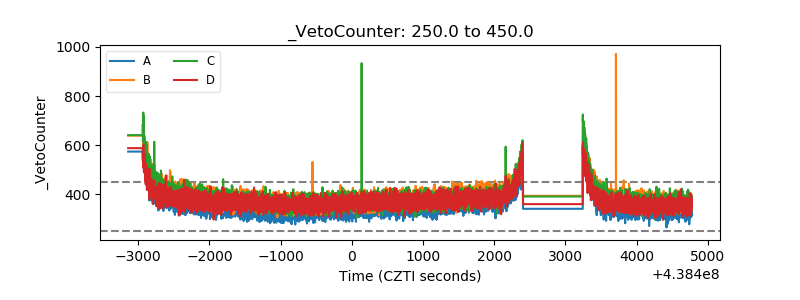 |