| Param | Original file | Final file |
|---|---|---|
| Filename | modeM0/AS1A13_012T01_9000005942_44086cztM0_level2.fits | modeM0/AS1A13_012T01_9000005942_44086cztM0_level2_quad_clean.evt |
| Size (bytes) | 485,305,920 | 121,452,480 |
| Size | 462.8 MB | 115.8 MB |
| Events in quadrant A | 5,077,673 | 811,852 |
| Events in quadrant B | 3,535,413 | 843,341 |
| Events in quadrant C | 3,580,193 | 793,677 |
| Events in quadrant D | 5,180,589 | 699,589 |
| Mode M9 | |||
|---|---|---|---|
| Quadrant | BADHDUFLAG | Total packets | Discarded packets |
| A | 0 | 9 | 0 |
| B | 0 | 9 | 0 |
| C | 0 | 9 | 0 |
| D | 0 | 9 | 0 |
| Mode M0 | |||
|---|---|---|---|
| Quadrant | BADHDUFLAG | Total packets | Discarded packets |
| A | 0 | 20318 | 3 |
| B | 0 | 15870 | 3 |
| C | 0 | 16104 | 3 |
| D | 0 | 20694 | 3 |
| Mode SS | |||
|---|---|---|---|
| Quadrant | BADHDUFLAG | Total packets | Discarded packets |
| A | 0 | 158 | 0 |
| B | 0 | 158 | 0 |
| C | 0 | 158 | 0 |
| D | 0 | 158 | 0 |
| Quadrant | Total seconds | Saturated seconds | Saturation percentage |
|---|---|---|---|
| A | 7596 | 280 | 3.686151% |
| B | 7596 | 270 | 3.554502% |
| C | 7596 | 228 | 3.001580% |
| D | 7596 | 574 | 7.556609% |
Noise dominated data is calculated using 1-second bins in cleaned event files. If a bin has >2000 counts, and if more than 50% of those come from <1% of pixels, then it is considered to be noise-dominated and hence unusable.
| Quadrant | # 1 sec bins | Bins with >0 counts | Bins with >2000 counts | High rate bins dominated by noise | Noise dominated (total time) | Noise dominated (detector-on time) | Marked lightcurve |
|---|---|---|---|---|---|---|---|
| A | 8626 | 7599 | 20 | 20 | 0.23% | 0.26% | 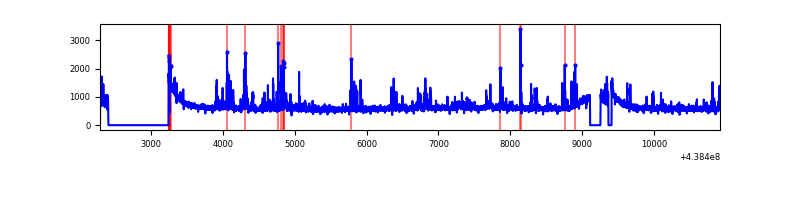 |
| B | 8626 | 7599 | 1 | 1 | 0.01% | 0.01% | 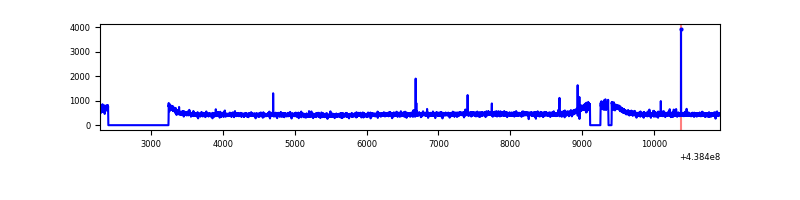 |
| C | 8626 | 7599 | 3 | 3 | 0.03% | 0.04% | 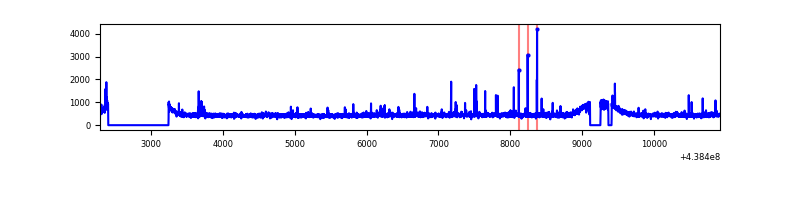 |
| D | 8626 | 7599 | 268 | 268 | 3.11% | 3.53% | 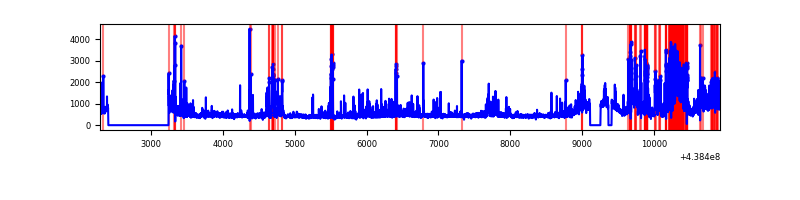 |
Top three noisy pixels from each quadrant. If the there are fewer than three noisy pixels in the level2.evt file, extra rows are filled as -1
| Pixel properties | Quadrant properties | ||||||
|---|---|---|---|---|---|---|---|
| Quadrant | DetID | PixID | Counts | Sigma | Mean | Median | Sigma |
| A | 10 | 83 | 1269151 | 6954.06 | 885 | 866 | 182.4 |
| A | 7 | 3 | 237618 | 1298.12 | 885 | 866 | 182.4 |
| A | 15 | 222 | 143604 | 782.64 | 885 | 866 | 182.4 |
| B | 12 | 111 | 23533 | 127.41 | 889 | 861 | 177.9 |
| B | 11 | 111 | 21675 | 116.97 | 889 | 861 | 177.9 |
| B | 14 | 111 | 21412 | 115.49 | 889 | 861 | 177.9 |
| C | 14 | 254 | 61891 | 292.54 | 882 | 883 | 208.5 |
| C | 14 | 96 | 44111 | 207.29 | 882 | 883 | 208.5 |
| C | 3 | 233 | 11585 | 51.32 | 882 | 883 | 208.5 |
| D | 13 | 249 | 981799 | 4583.57 | 858 | 831 | 214.0 |
| D | 1 | 47 | 465864 | 2172.86 | 858 | 831 | 214.0 |
| D | 1 | 52 | 220561 | 1026.69 | 858 | 831 | 214.0 |
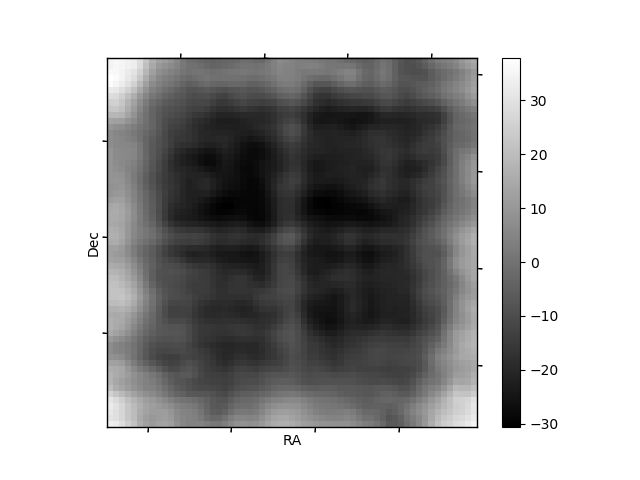
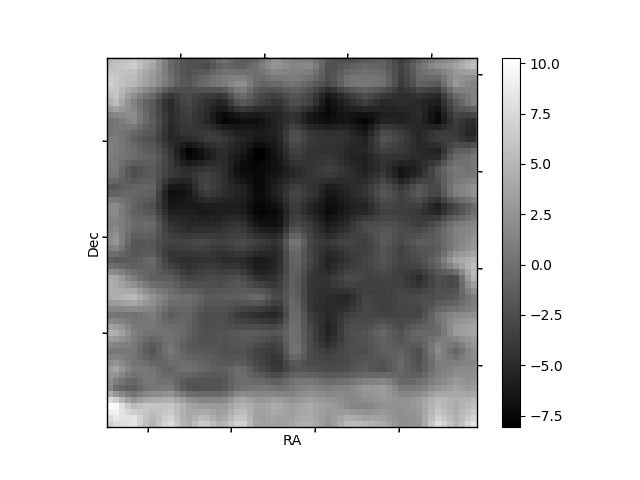
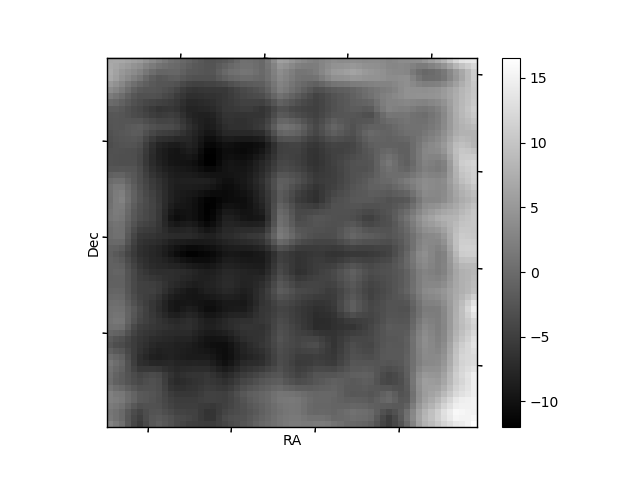
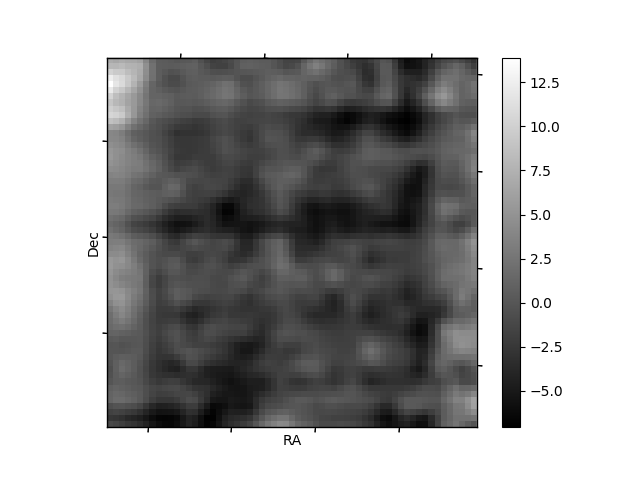
Histogram calculated using DETX and DETY for each event in the final _common_clean file
| Quadrant A | 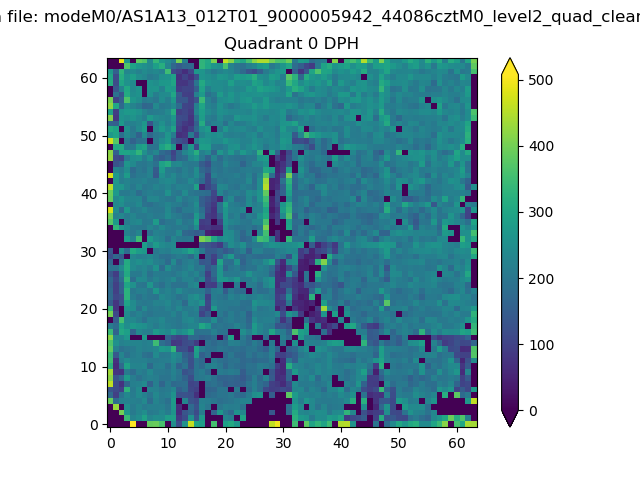 |
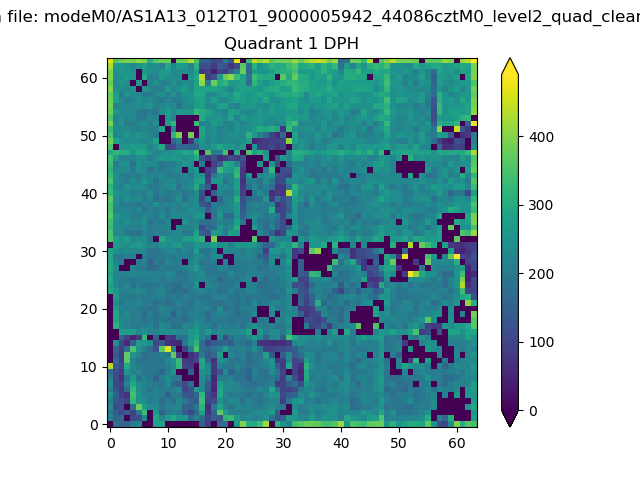 |
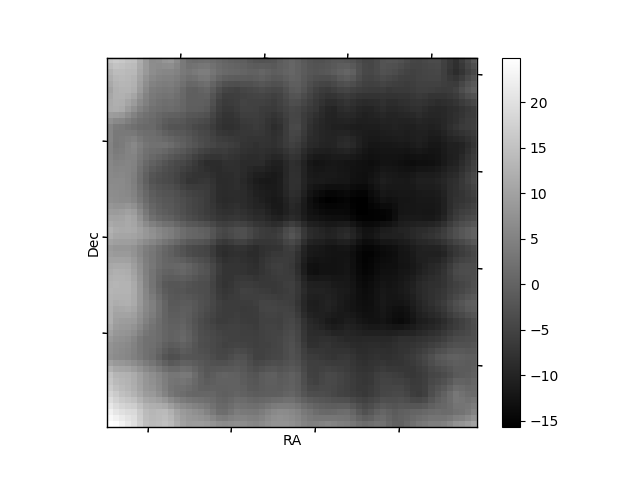
Quadrant B |
|---|---|---|---|
| Quadrant D | 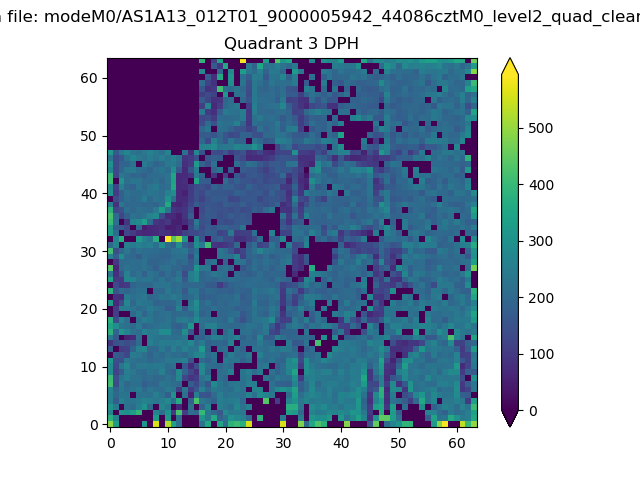 |
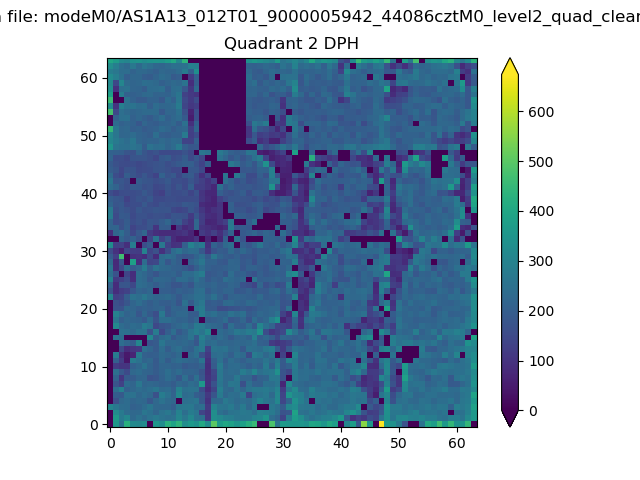 |
Quadrant C |
| Plot type | Count rate plots | Images |
|---|---|---|
| Comparison with Poisson distribution Blue bars denote a histogram of data divided into 1 sec bins. Red curve is a Poisson curve with rate = median count rate of data. |
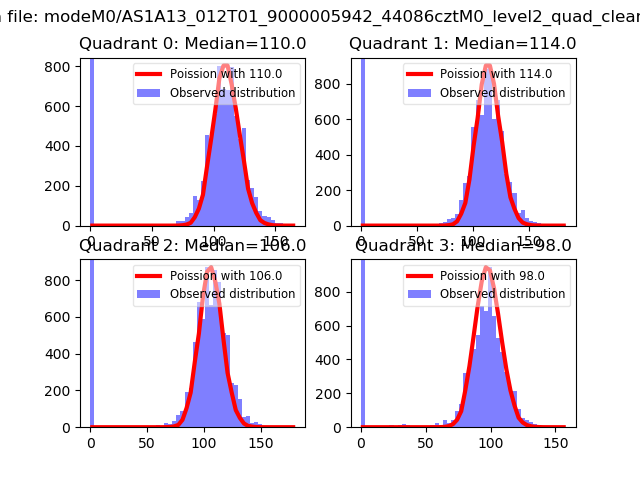 |
 |
| Quadrant-wise count rates Data is divided into 100 sec bins |
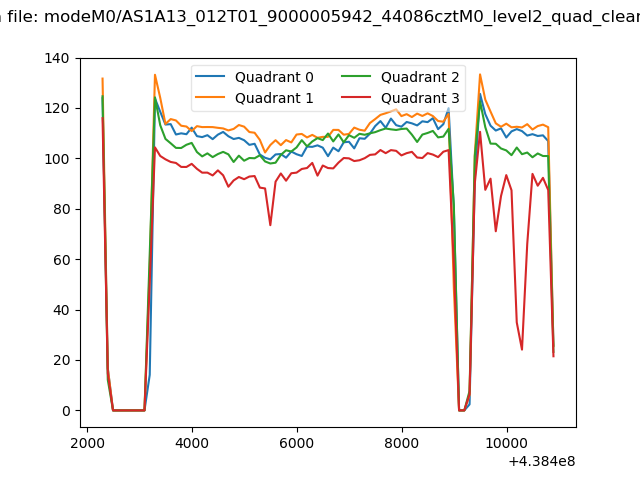 |
|
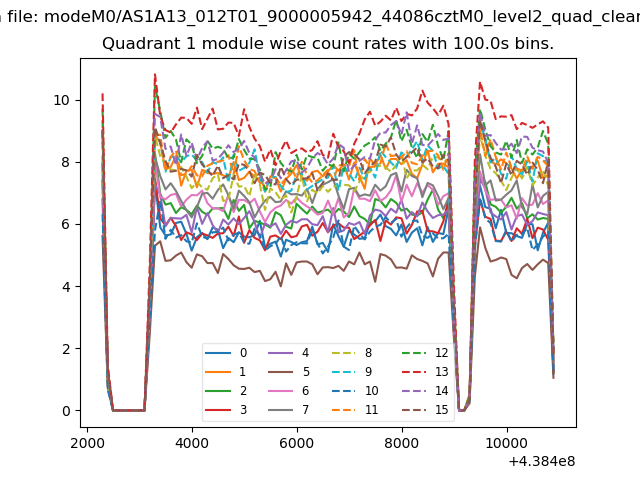
| Module-wise count rates for Quadrant A Data is divided into 100 sec bins |
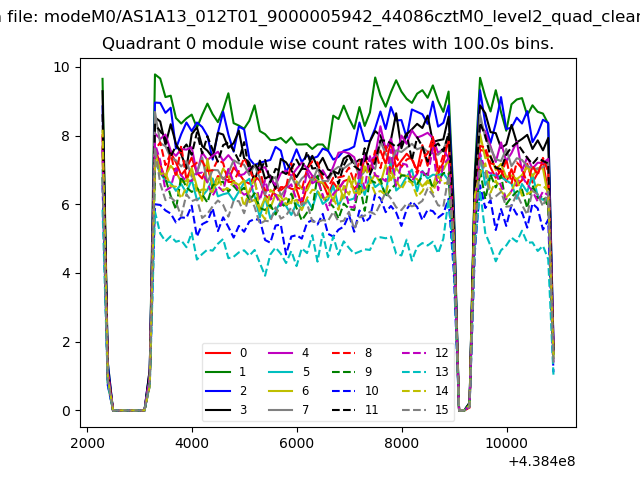 |
 |
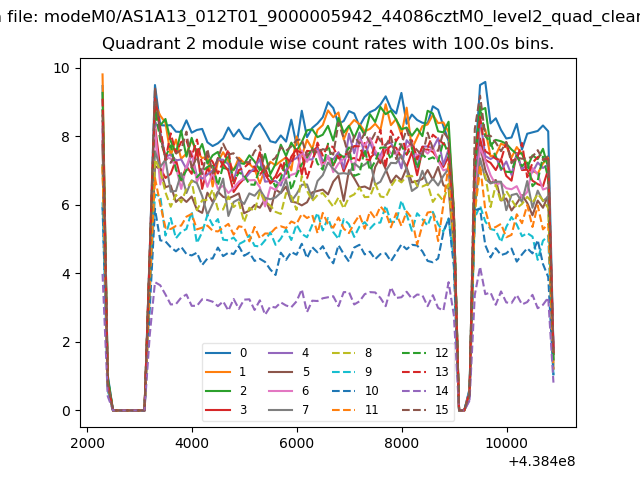
| Module-wise count rates for Quadrant B Data is divided into 100 sec bins |
 |
 |
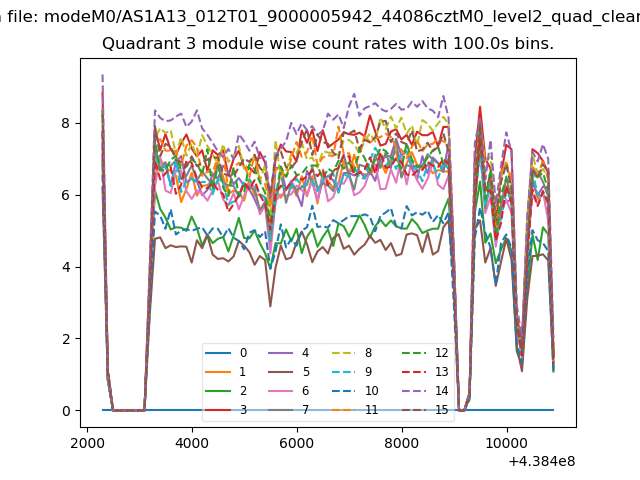
| Module-wise count rates for Quadrant C Data is divided into 100 sec bins |
 |
 |
| Module-wise count rates for Quadrant D Data is divided into 100 sec bins |
 |
 |
| Parameter | Plot |
|---|---|
| CZT HV Monitor | 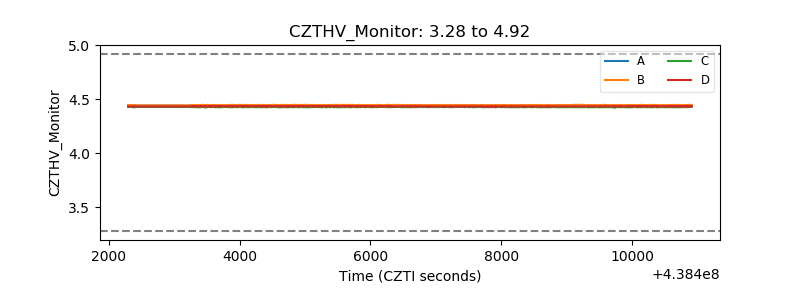 |
| D_VDD | 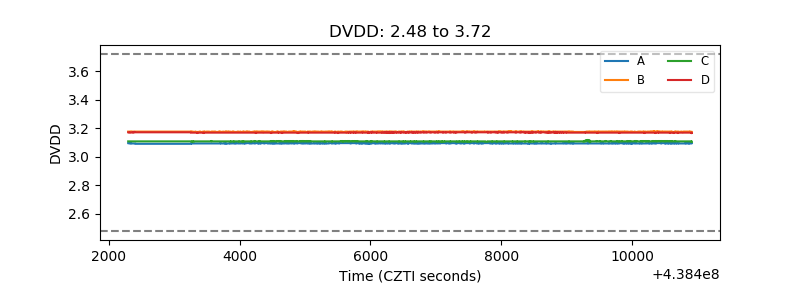 |
| Temperature 1 | 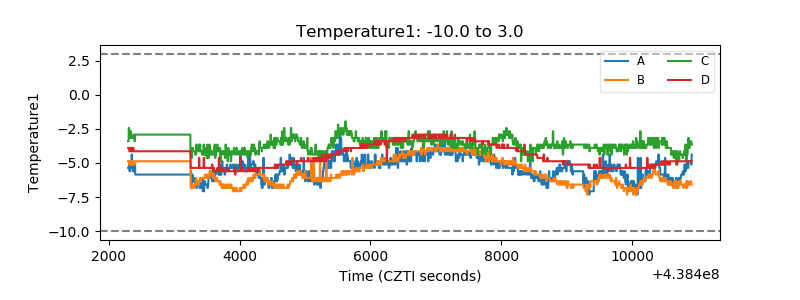 |
| Veto HV Monitor | 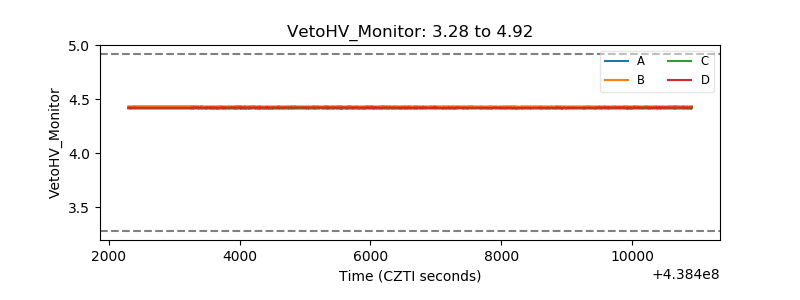 |
| Veto LLD | 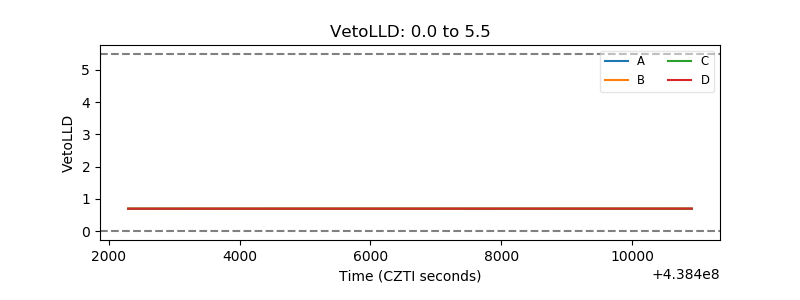 |
| Alpha Counter | 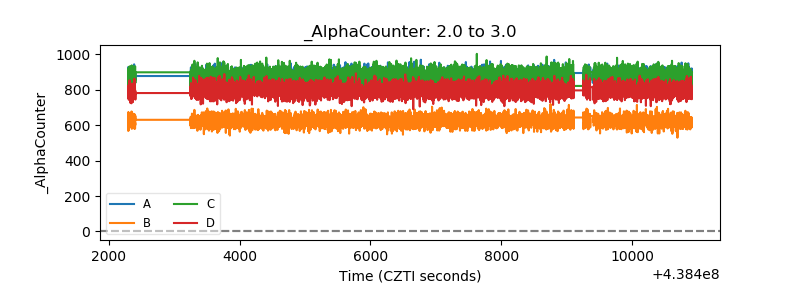 |
| _CPM_Rate | 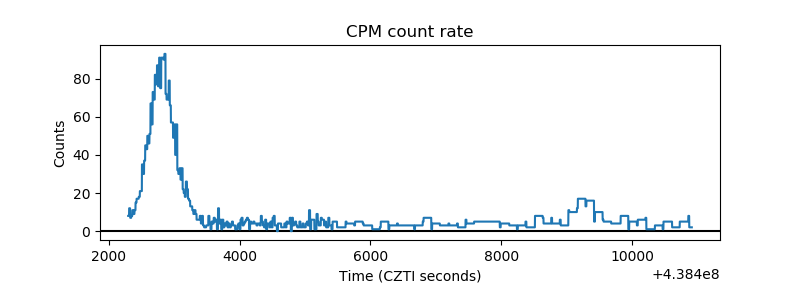 |
| CZT Counter | 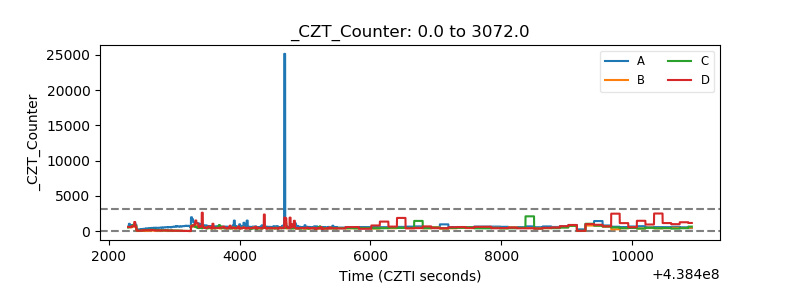 |
| +2.5 Volts monitor | 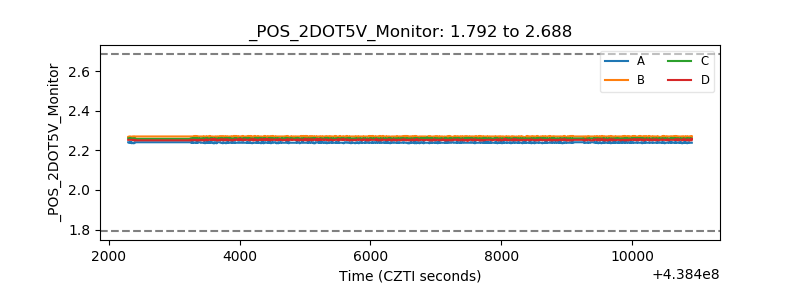 |
| +5 Volts monitor | 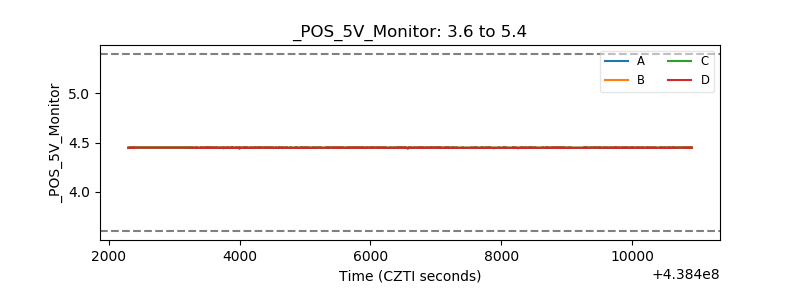 |
| _ROLL_ROT | 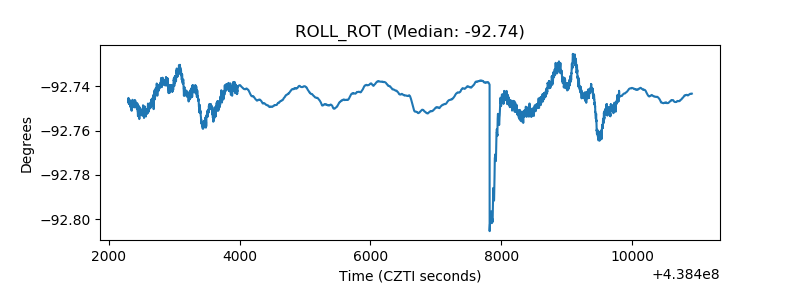 |
| _Roll_DEC | 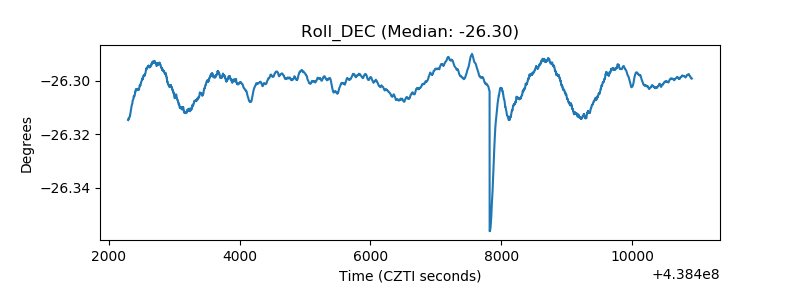 |
| _Roll_RA | 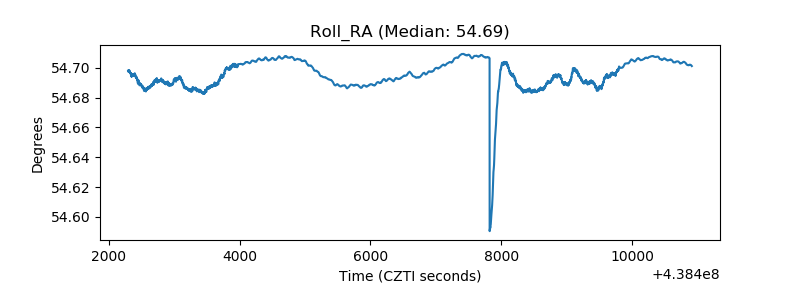 |
| Veto Counter | 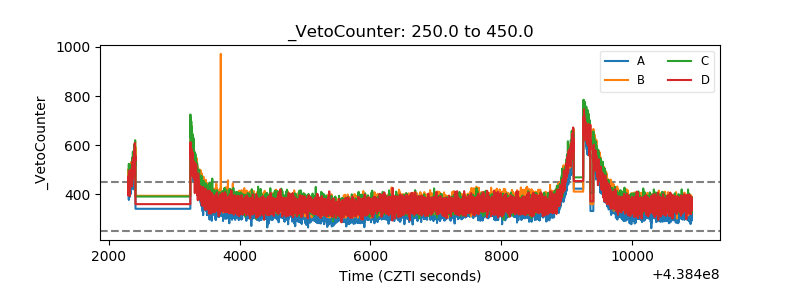 |