| Param | Original file | Final file |
|---|---|---|
| Filename | modeM0/AS1A13_012T01_9000005942_44087cztM0_level2.fits | modeM0/AS1A13_012T01_9000005942_44087cztM0_level2_quad_clean.evt |
| Size (bytes) | 556,007,040 | 121,507,200 |
| Size | 530.2 MB | 115.9 MB |
| Events in quadrant A | 4,963,269 | 833,737 |
| Events in quadrant B | 3,484,541 | 863,591 |
| Events in quadrant C | 3,460,487 | 810,211 |
| Events in quadrant D | 8,076,156 | 636,347 |
| Mode M0 | |||
|---|---|---|---|
| Quadrant | BADHDUFLAG | Total packets | Discarded packets |
| A | 0 | 19960 | 1 |
| B | 0 | 15840 | 1 |
| C | 0 | 15916 | 12 |
| D | 0 | 29333 | 33 |
| Mode SS | |||
|---|---|---|---|
| Quadrant | BADHDUFLAG | Total packets | Discarded packets |
| A | 0 | 154 | 0 |
| B | 0 | 154 | 0 |
| C | 0 | 154 | 0 |
| D | 0 | 154 | 0 |
| Quadrant | Total seconds | Saturated seconds | Saturation percentage |
|---|---|---|---|
| A | 7696 | 39 | 0.506757% |
| B | 7697 | 17 | 0.220865% |
| C | 7691 | 10 | 0.130022% |
| D | 7689 | 1293 | 16.816231% |
Noise dominated data is calculated using 1-second bins in cleaned event files. If a bin has >2000 counts, and if more than 50% of those come from <1% of pixels, then it is considered to be noise-dominated and hence unusable.
| Quadrant | # 1 sec bins | Bins with >0 counts | Bins with >2000 counts | High rate bins dominated by noise | Noise dominated (total time) | Noise dominated (detector-on time) | Marked lightcurve |
|---|---|---|---|---|---|---|---|
| A | 7697 | 7697 | 22 | 22 | 0.29% | 0.29% | 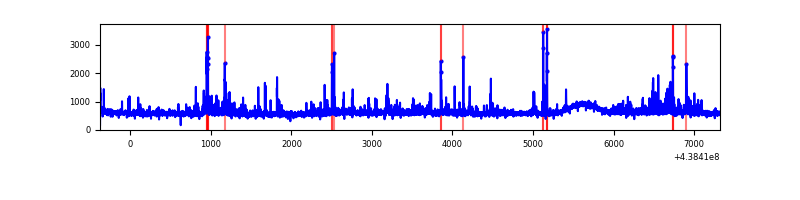 |
| B | 7698 | 7698 | 1 | 1 | 0.01% | 0.01% | 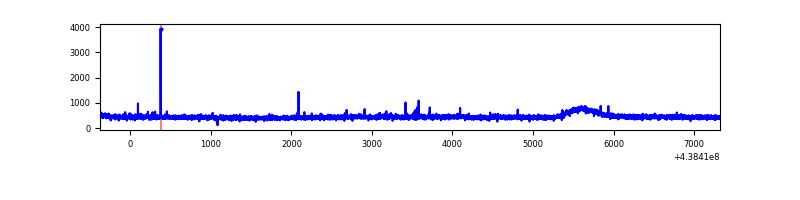 |
| C | 7698 | 7694 | 2 | 2 | 0.03% | 0.03% | 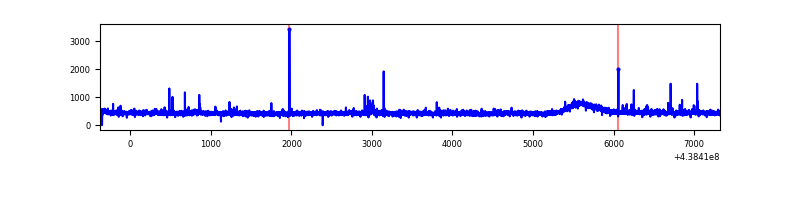 |
| D | 7696 | 7693 | 1044 | 1044 | 13.57% | 13.57% | 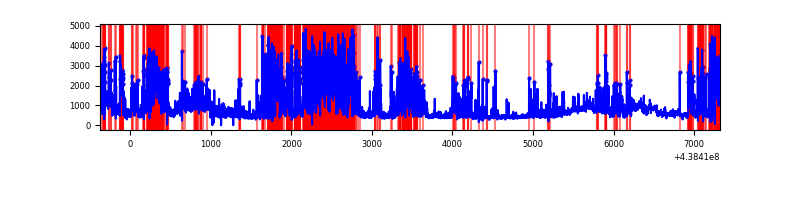 |
Top three noisy pixels from each quadrant. If the there are fewer than three noisy pixels in the level2.evt file, extra rows are filled as -1
| Pixel properties | Quadrant properties | ||||||
|---|---|---|---|---|---|---|---|
| Quadrant | DetID | PixID | Counts | Sigma | Mean | Median | Sigma |
| A | 10 | 83 | 1143794 | 6252.69 | 873 | 854 | 182.8 |
| A | 15 | 222 | 207962 | 1133.03 | 873 | 854 | 182.8 |
| A | 7 | 3 | 193484 | 1053.82 | 873 | 854 | 182.8 |
| B | 12 | 111 | 22801 | 125.69 | 874 | 848 | 174.7 |
| B | 14 | 111 | 21115 | 116.04 | 874 | 848 | 174.7 |
| B | 11 | 111 | 21018 | 115.48 | 874 | 848 | 174.7 |
| C | 14 | 254 | 44906 | 214.17 | 864 | 868 | 205.6 |
| C | 14 | 96 | 17525 | 81.01 | 864 | 868 | 205.6 |
| C | 3 | 233 | 16829 | 77.62 | 864 | 868 | 205.6 |
| D | 1 | 52 | 1852010 | 9186.37 | 795 | 770 | 201.5 |
| D | 13 | 249 | 1746031 | 8660.47 | 795 | 770 | 201.5 |
| D | 1 | 47 | 685628 | 3398.46 | 795 | 770 | 201.5 |
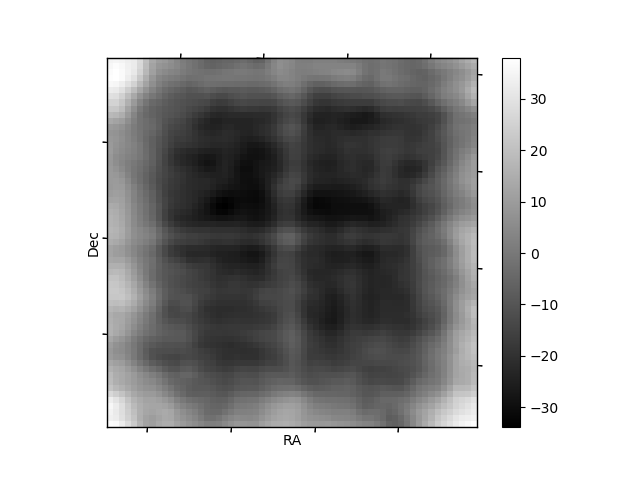
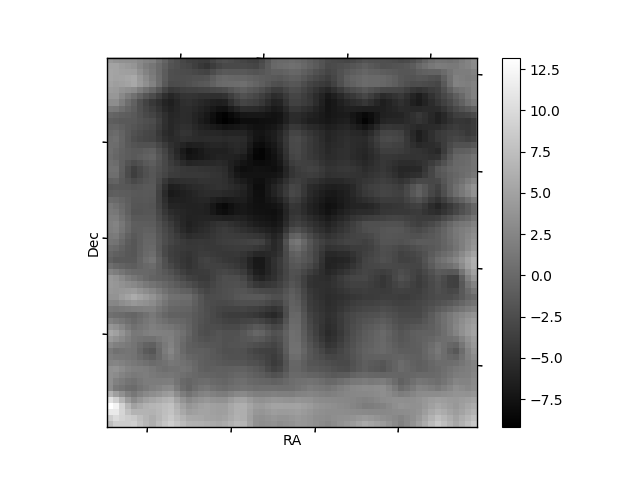
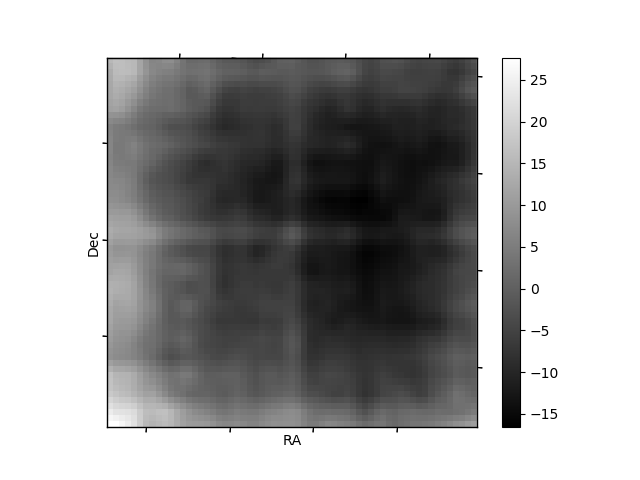
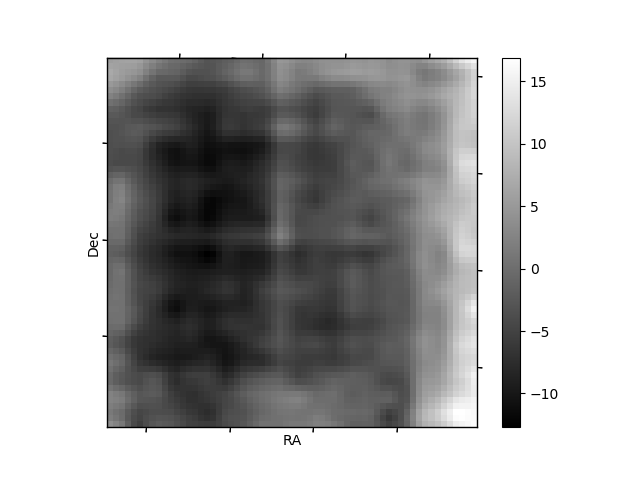
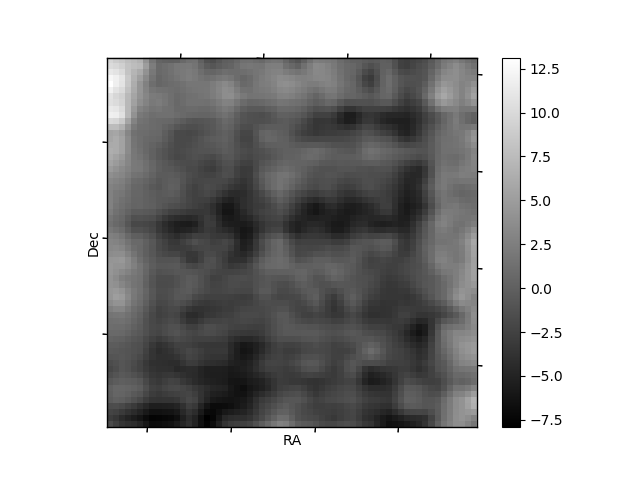
Histogram calculated using DETX and DETY for each event in the final _common_clean file
| Quadrant A | 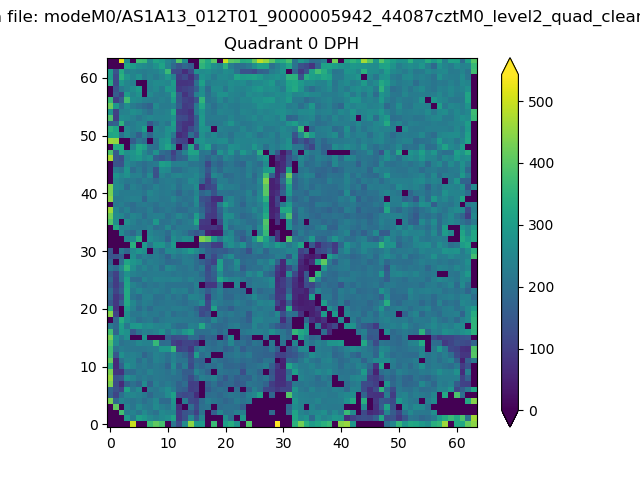 |
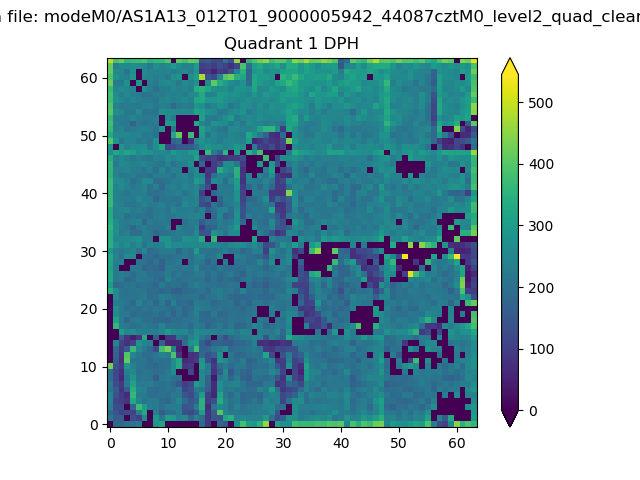 |
Quadrant B |
|---|---|---|---|
| Quadrant D | 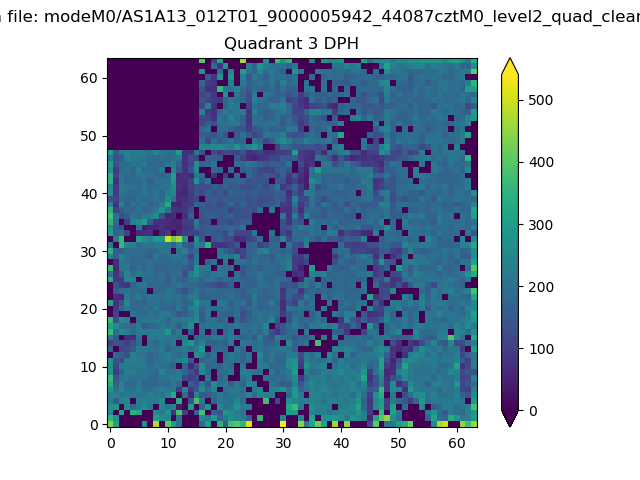 |
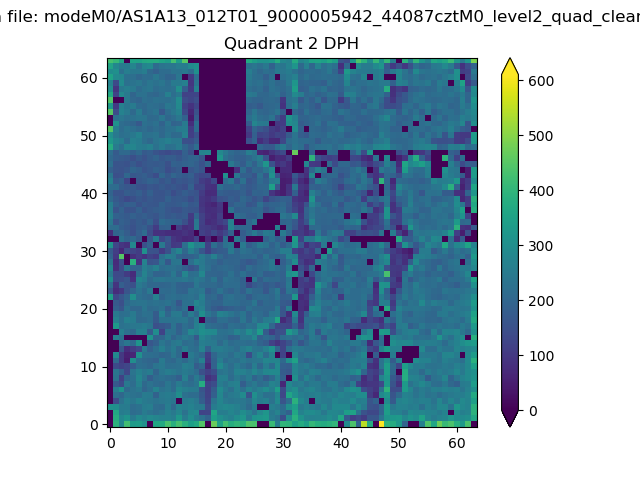 |
Quadrant C |
| Plot type | Count rate plots | Images |
|---|---|---|
| Comparison with Poisson distribution Blue bars denote a histogram of data divided into 1 sec bins. Red curve is a Poisson curve with rate = median count rate of data. |
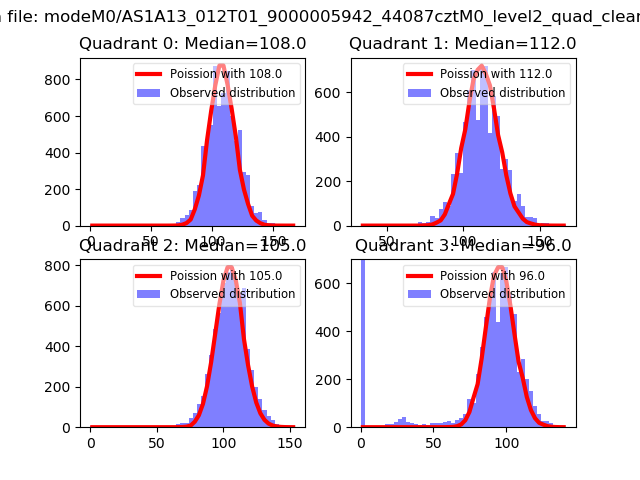 |
 |
| Quadrant-wise count rates Data is divided into 100 sec bins |
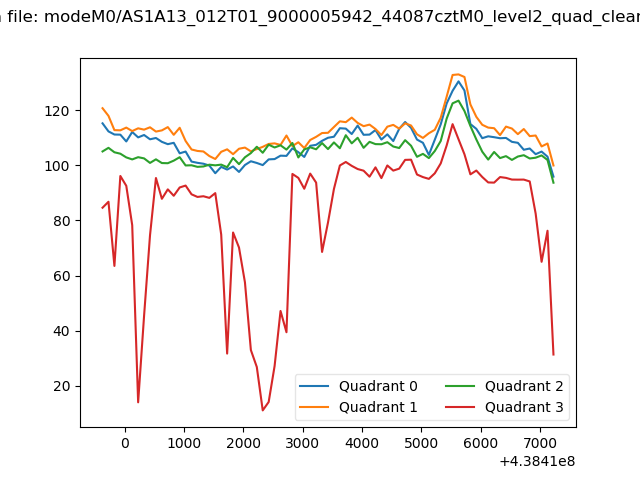 |
|
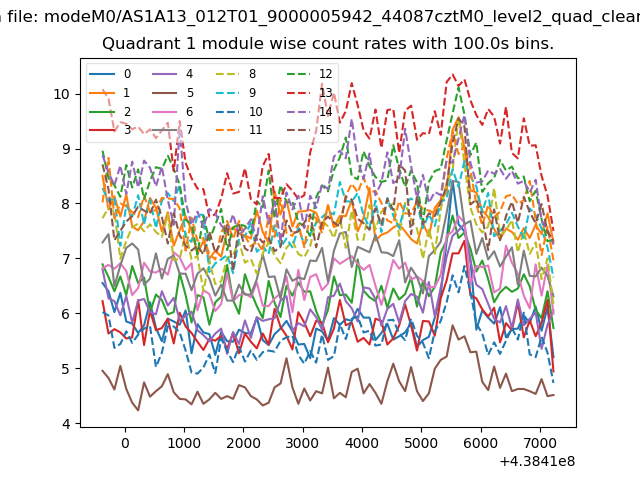
| Module-wise count rates for Quadrant A Data is divided into 100 sec bins |
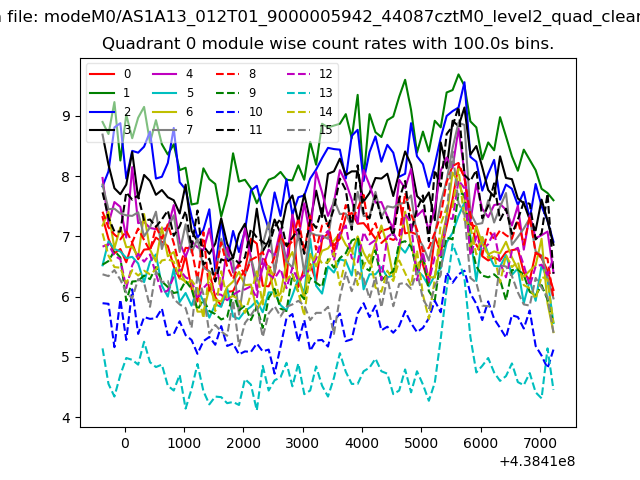 |
 |
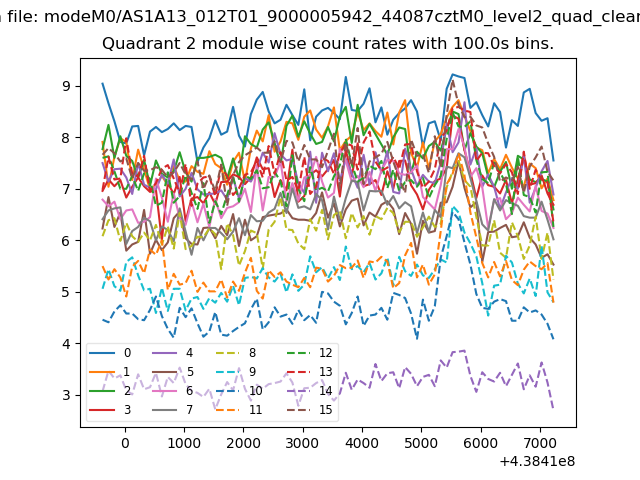
| Module-wise count rates for Quadrant B Data is divided into 100 sec bins |
 |
 |
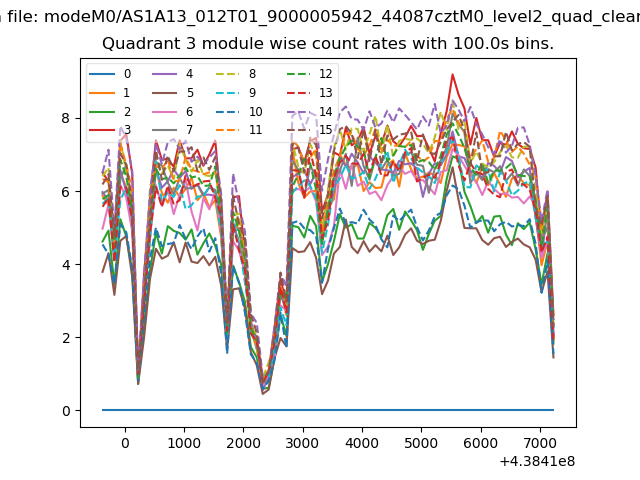
| Module-wise count rates for Quadrant C Data is divided into 100 sec bins |
 |
 |
| Module-wise count rates for Quadrant D Data is divided into 100 sec bins |
 |
 |
| Parameter | Plot |
|---|---|
| CZT HV Monitor | 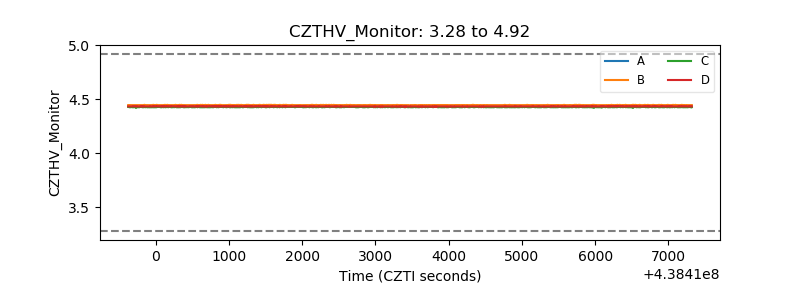 |
| D_VDD | 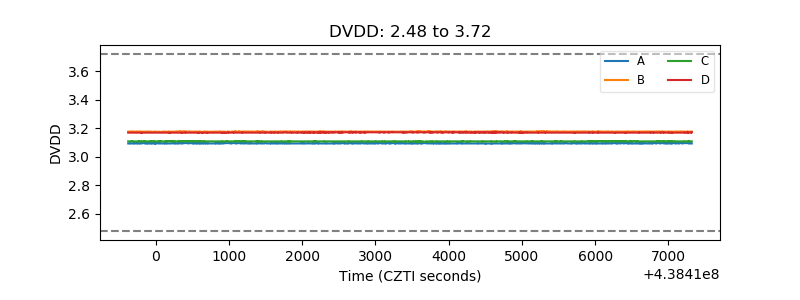 |
| Temperature 1 | 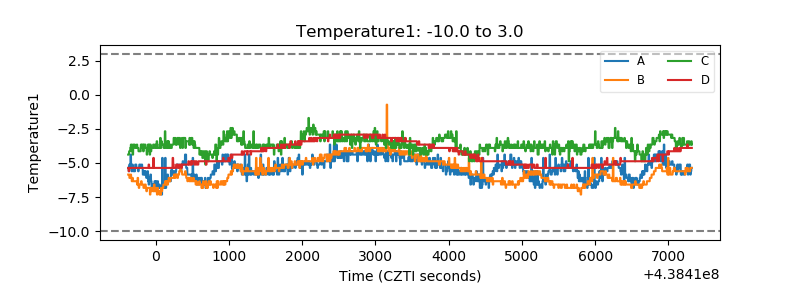 |
| Veto HV Monitor |  |
| Veto LLD | 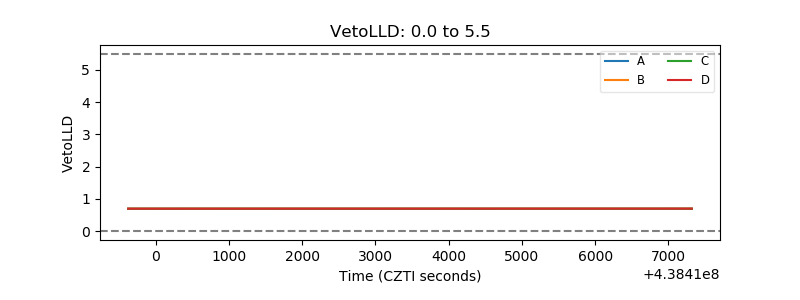 |
| Alpha Counter | 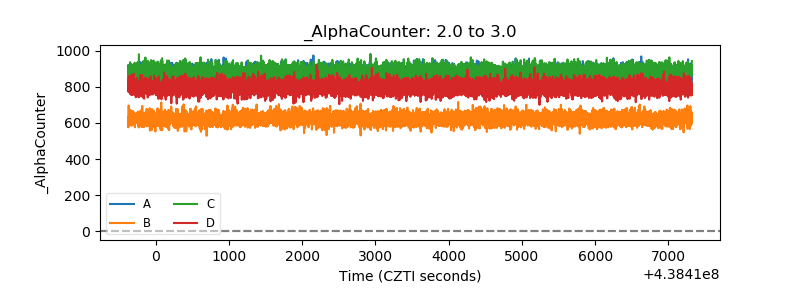 |
| _CPM_Rate | 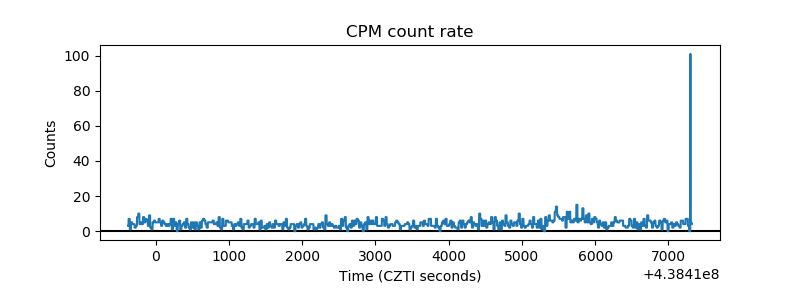 |
| CZT Counter | 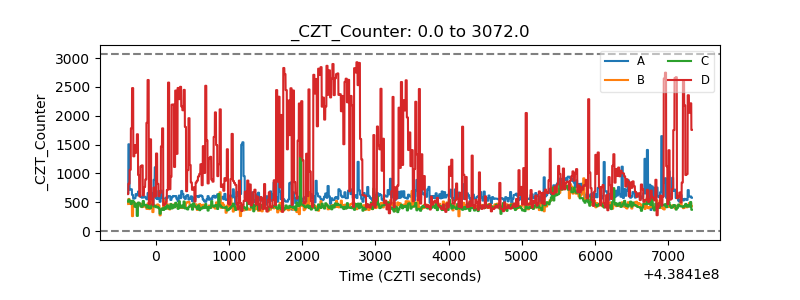 |
| +2.5 Volts monitor | 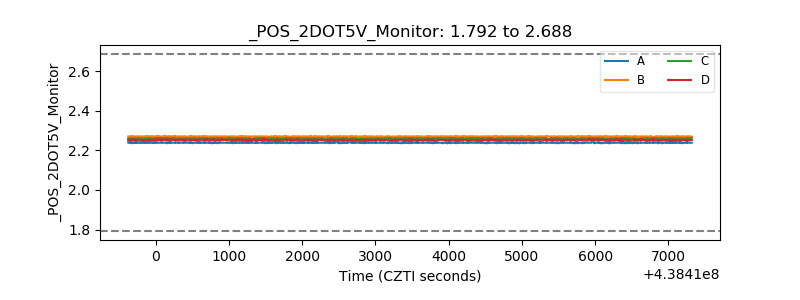 |
| +5 Volts monitor | 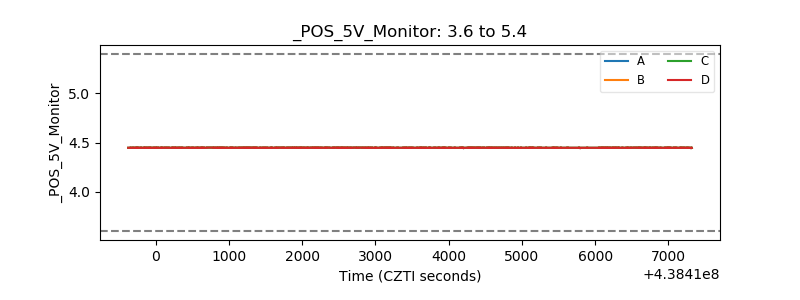 |
| _ROLL_ROT | 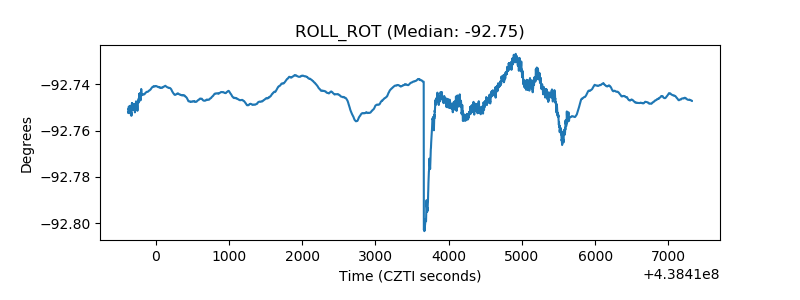 |
| _Roll_DEC | 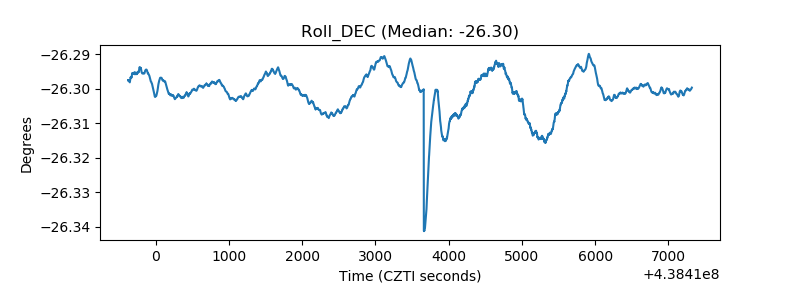 |
| _Roll_RA | 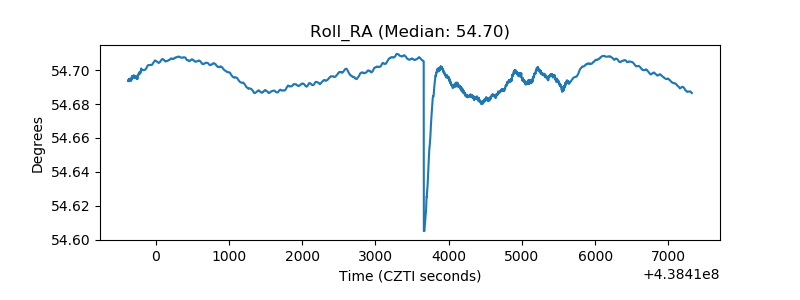 |
| Veto Counter | 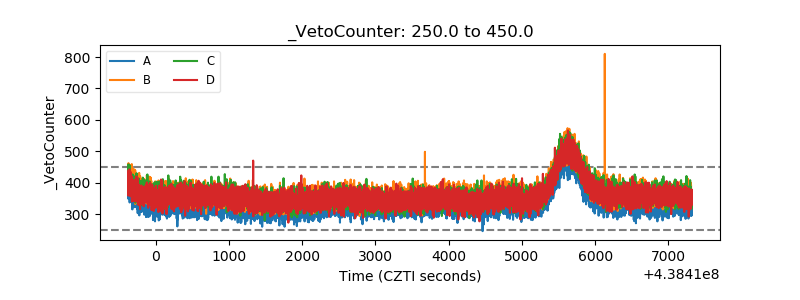 |