| Param | Original file | Final file |
|---|---|---|
| Filename | modeM0/AS1A13_012T01_9000005942_44088cztM0_level2.fits | modeM0/AS1A13_012T01_9000005942_44088cztM0_level2_quad_clean.evt |
| Size (bytes) | 480,355,200 | 122,613,120 |
| Size | 458.1 MB | 116.9 MB |
| Events in quadrant A | 4,688,284 | 820,323 |
| Events in quadrant B | 3,456,502 | 850,098 |
| Events in quadrant C | 3,594,260 | 804,282 |
| Events in quadrant D | 5,450,206 | 707,910 |
| Mode M0 | |||
|---|---|---|---|
| Quadrant | BADHDUFLAG | Total packets | Discarded packets |
| A | 0 | 18754 | 1 |
| B | 0 | 15705 | 0 |
| C | 0 | 15987 | 0 |
| D | 0 | 21400 | 0 |
| Mode SS | |||
|---|---|---|---|
| Quadrant | BADHDUFLAG | Total packets | Discarded packets |
| A | 0 | 152 | 0 |
| B | 0 | 152 | 0 |
| C | 0 | 152 | 0 |
| D | 0 | 152 | 0 |
| Quadrant | Total seconds | Saturated seconds | Saturation percentage |
|---|---|---|---|
| A | 7620 | 33 | 0.433071% |
| B | 7620 | 47 | 0.616798% |
| C | 7620 | 23 | 0.301837% |
| D | 7620 | 433 | 5.682415% |
Noise dominated data is calculated using 1-second bins in cleaned event files. If a bin has >2000 counts, and if more than 50% of those come from <1% of pixels, then it is considered to be noise-dominated and hence unusable.
| Quadrant | # 1 sec bins | Bins with >0 counts | Bins with >2000 counts | High rate bins dominated by noise | Noise dominated (total time) | Noise dominated (detector-on time) | Marked lightcurve |
|---|---|---|---|---|---|---|---|
| A | 7620 | 7620 | 4 | 4 | 0.05% | 0.05% | 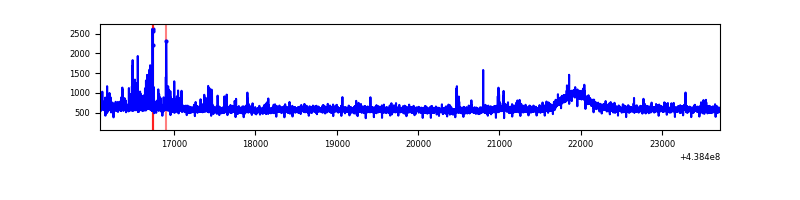 |
| B | 7620 | 7620 | 3 | 3 | 0.04% | 0.04% | 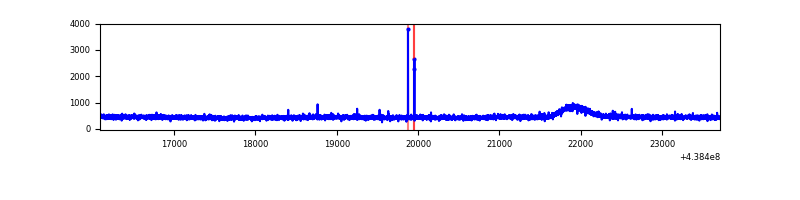 |
| C | 7620 | 7620 | 4 | 4 | 0.05% | 0.05% | 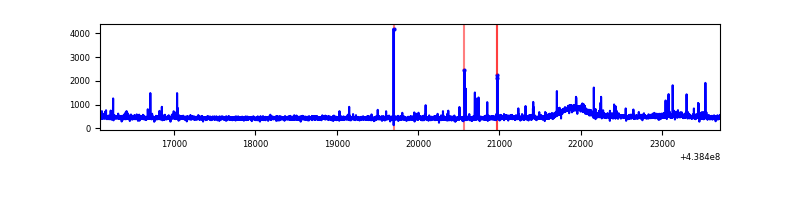 |
| D | 7620 | 7620 | 307 | 307 | 4.03% | 4.03% | 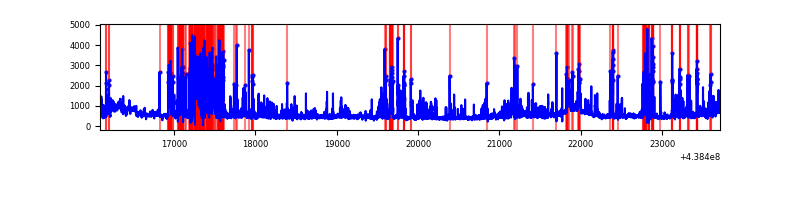 |
Top three noisy pixels from each quadrant. If the there are fewer than three noisy pixels in the level2.evt file, extra rows are filled as -1
| Pixel properties | Quadrant properties | ||||||
|---|---|---|---|---|---|---|---|
| Quadrant | DetID | PixID | Counts | Sigma | Mean | Median | Sigma |
| A | 10 | 83 | 1135819 | 6186.72 | 870 | 851 | 183.5 |
| A | 15 | 222 | 139050 | 753.32 | 870 | 851 | 183.5 |
| A | 7 | 3 | 57198 | 307.15 | 870 | 851 | 183.5 |
| B | 12 | 111 | 22637 | 125.65 | 868 | 843 | 173.5 |
| B | 11 | 111 | 21334 | 118.14 | 868 | 843 | 173.5 |
| B | 14 | 111 | 21177 | 117.23 | 868 | 843 | 173.5 |
| C | 3 | 233 | 125775 | 604.94 | 860 | 865 | 206.5 |
| C | 14 | 254 | 40436 | 191.64 | 860 | 865 | 206.5 |
| C | 14 | 96 | 33952 | 160.24 | 860 | 865 | 206.5 |
| D | 13 | 249 | 1231722 | 5910.0 | 832 | 807 | 208.3 |
| D | 1 | 52 | 286919 | 1373.71 | 832 | 807 | 208.3 |
| D | 5 | 222 | 209188 | 1000.5 | 832 | 807 | 208.3 |
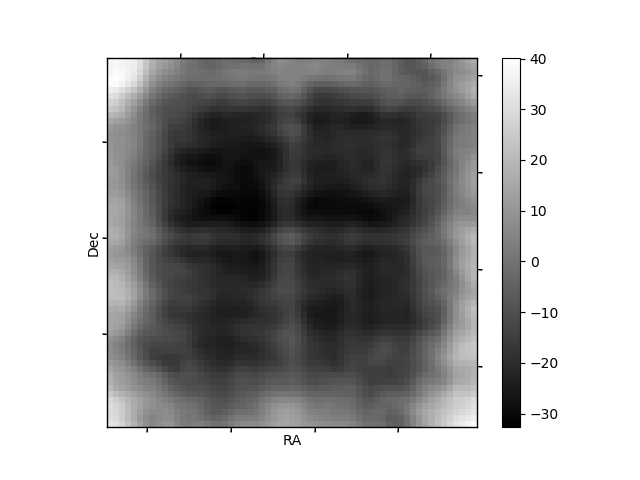
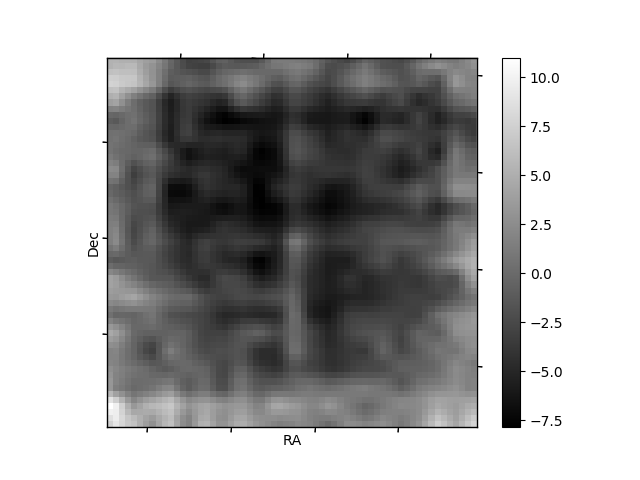
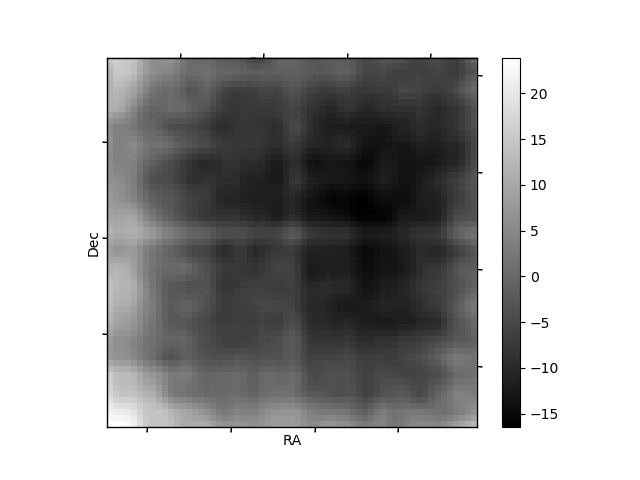
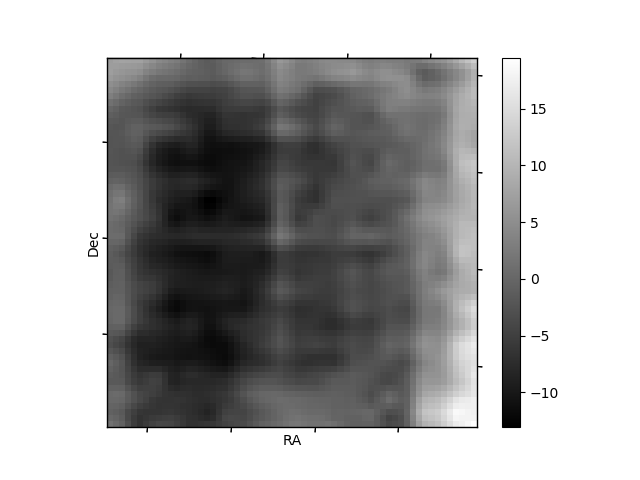
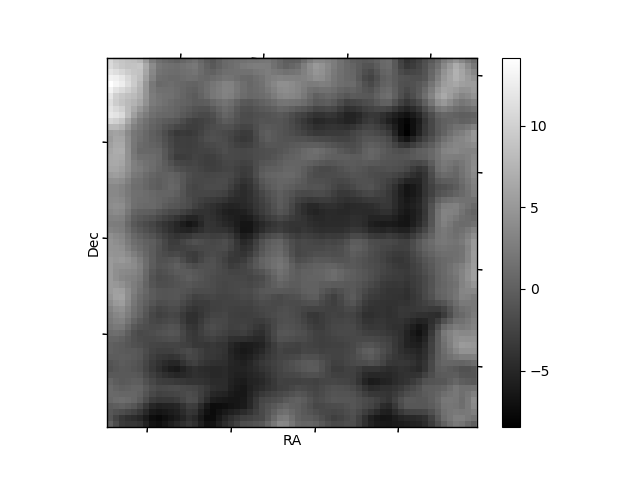
Histogram calculated using DETX and DETY for each event in the final _common_clean file
| Quadrant A | 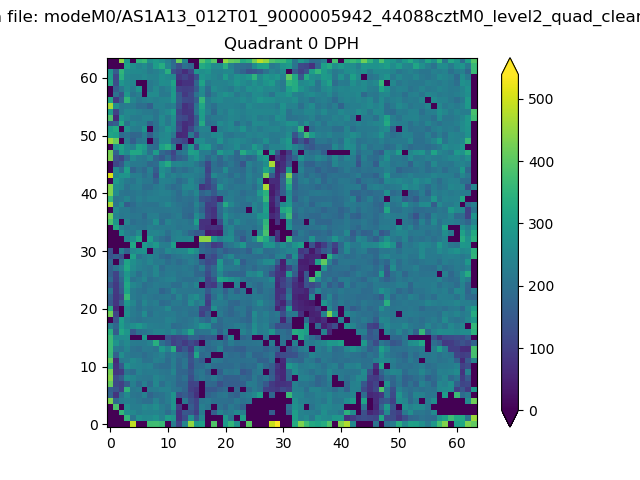 |
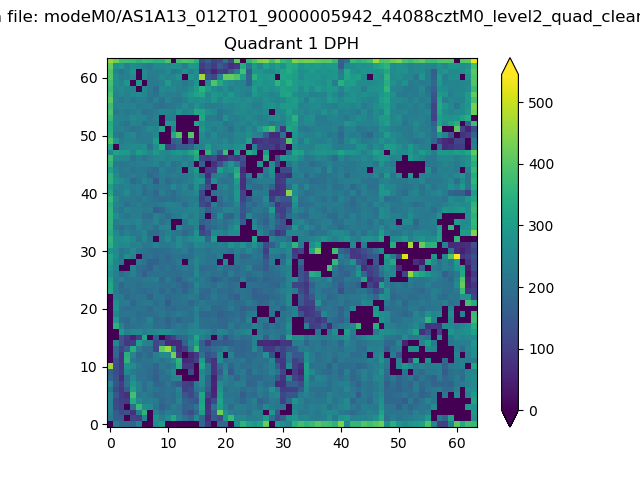 |
Quadrant B |
|---|---|---|---|
| Quadrant D | 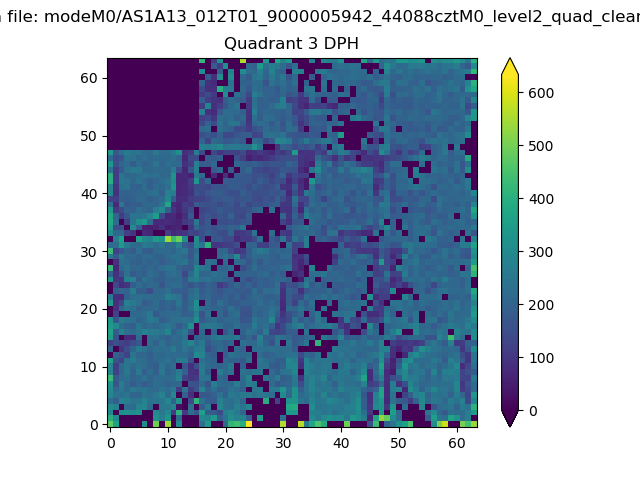 |
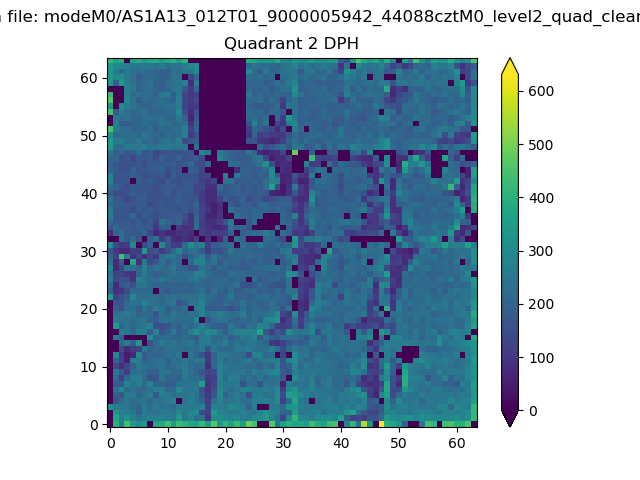 |
Quadrant C |
| Plot type | Count rate plots | Images |
|---|---|---|
| Comparison with Poisson distribution Blue bars denote a histogram of data divided into 1 sec bins. Red curve is a Poisson curve with rate = median count rate of data. |
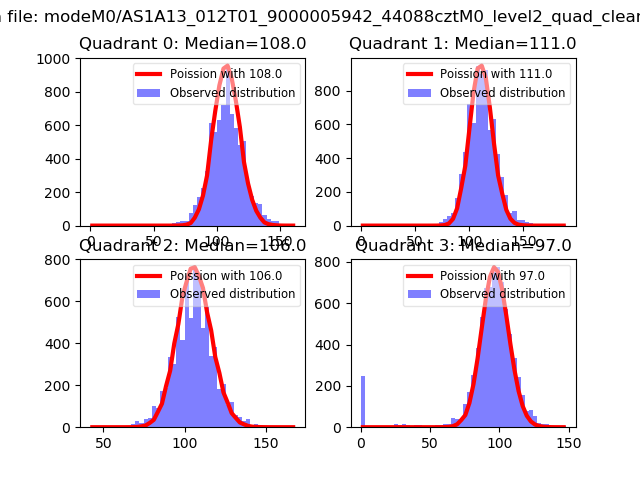 |
 |
| Quadrant-wise count rates Data is divided into 100 sec bins |
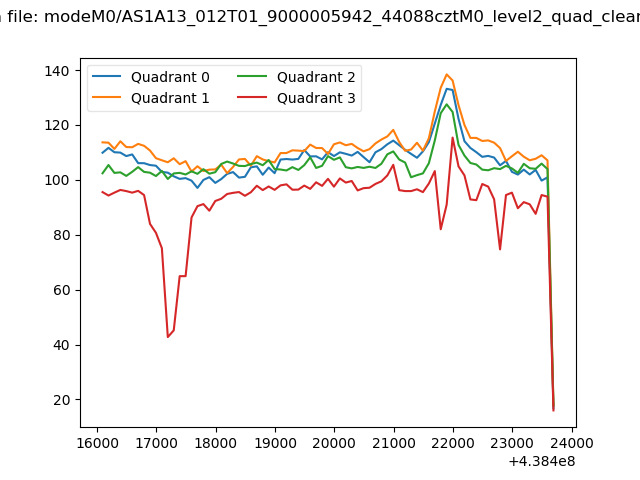 |
|
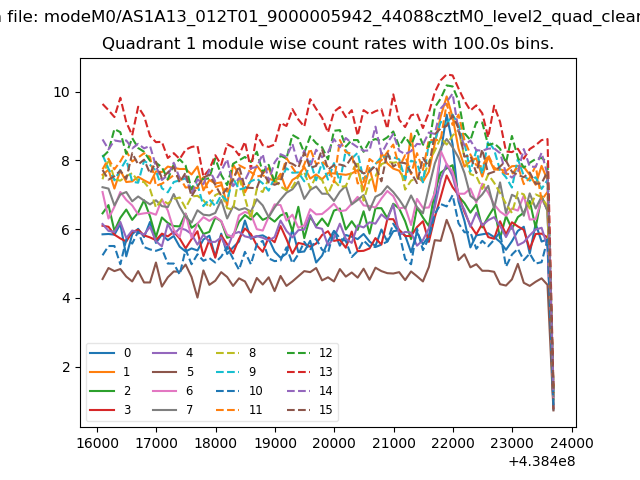
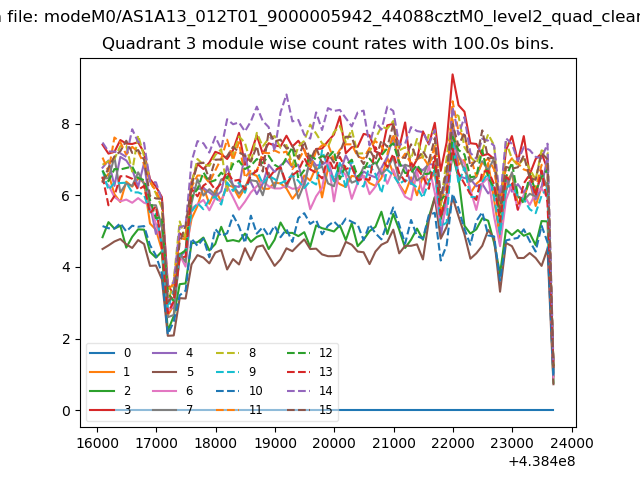
| Module-wise count rates for Quadrant A Data is divided into 100 sec bins |
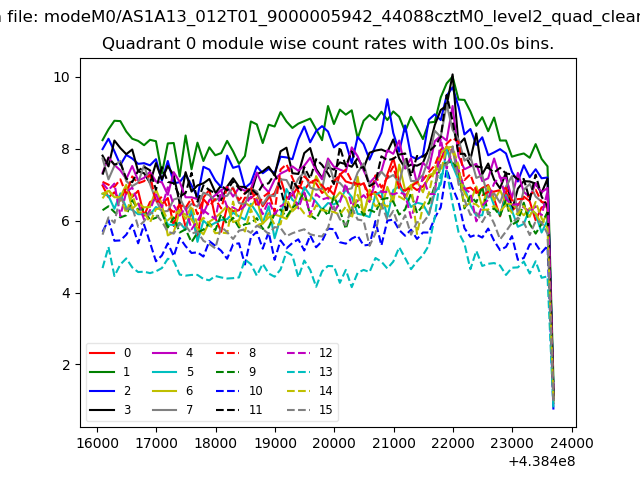 |
 |
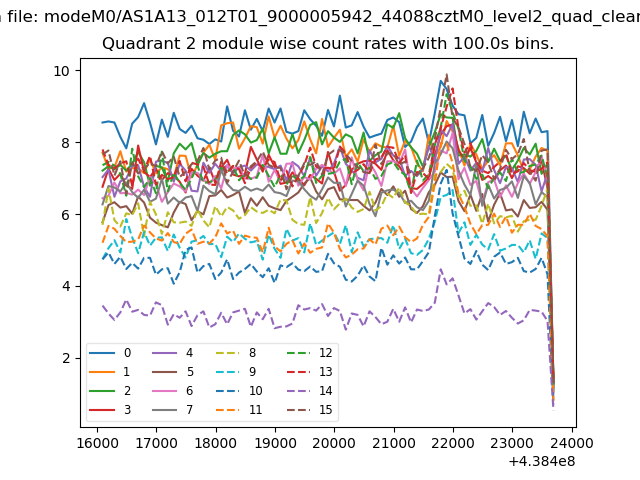
| Module-wise count rates for Quadrant B Data is divided into 100 sec bins |
 |
 |
| Module-wise count rates for Quadrant C Data is divided into 100 sec bins |
 |
 |
| Module-wise count rates for Quadrant D Data is divided into 100 sec bins |
 |
 |
| Parameter | Plot |
|---|---|
| CZT HV Monitor | 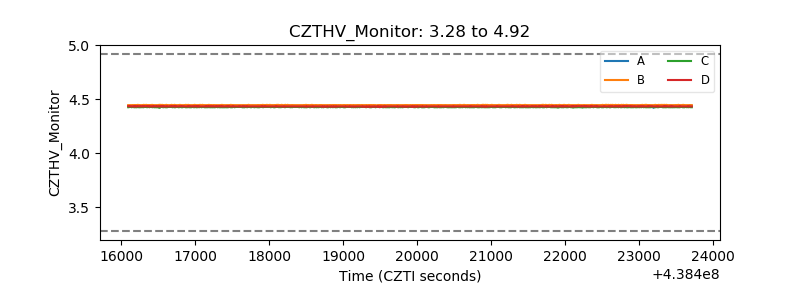 |
| D_VDD | 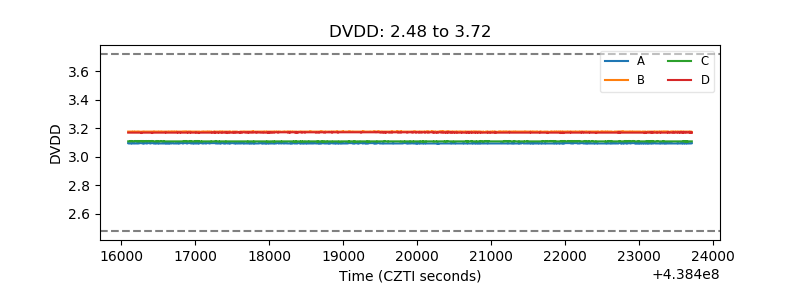 |
| Temperature 1 |  |
| Veto HV Monitor | 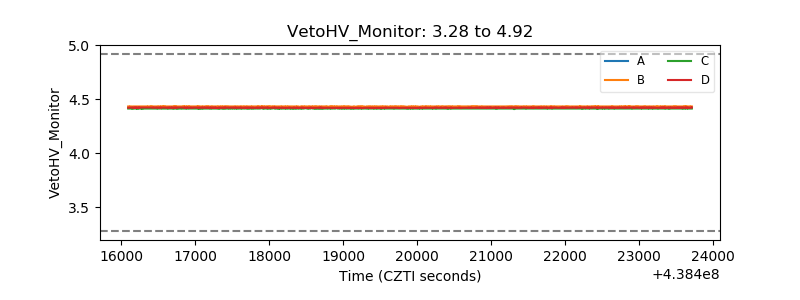 |
| Veto LLD | 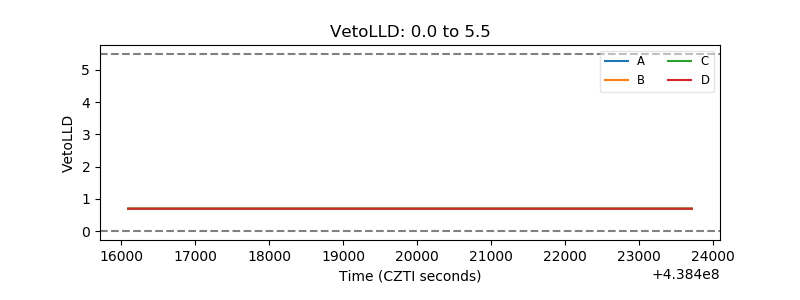 |
| Alpha Counter | 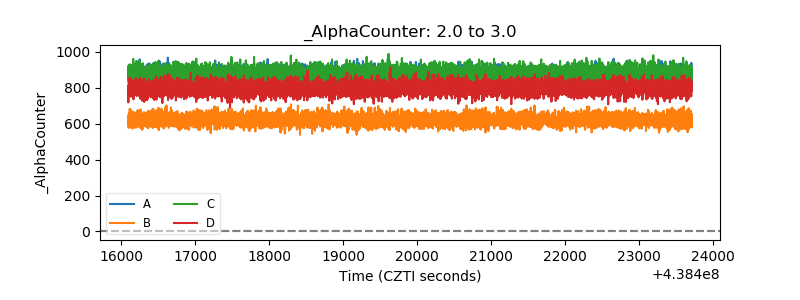 |
| _CPM_Rate | 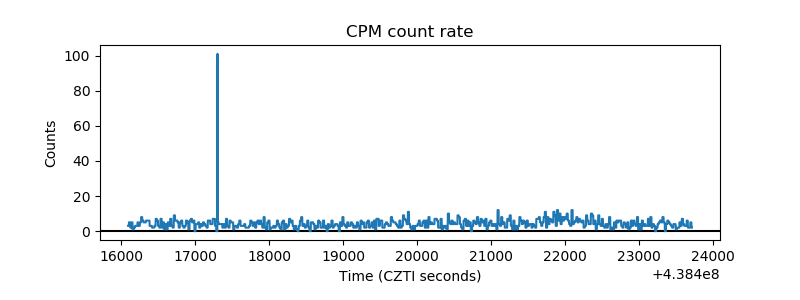 |
| CZT Counter | 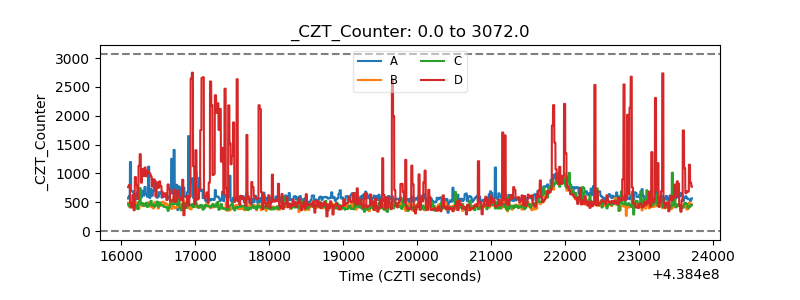 |
| +2.5 Volts monitor | 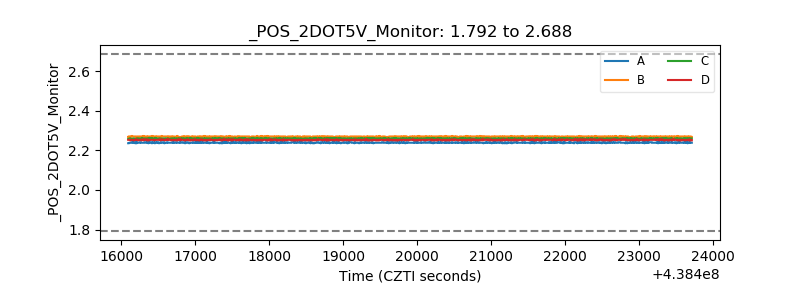 |
| +5 Volts monitor | 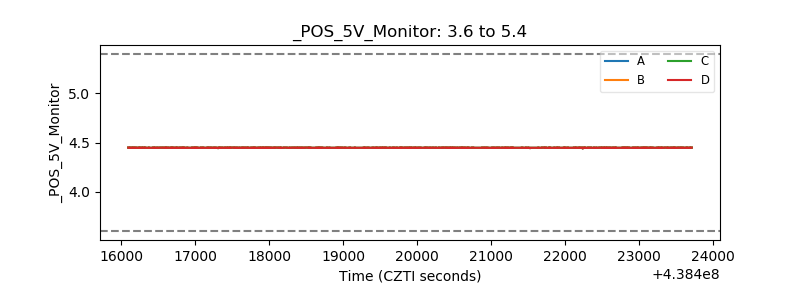 |
| _ROLL_ROT | 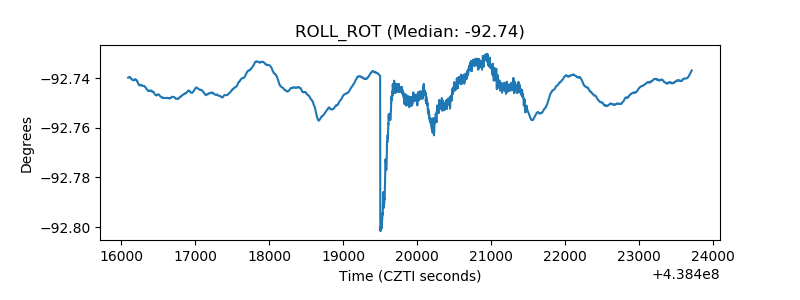 |
| _Roll_DEC | 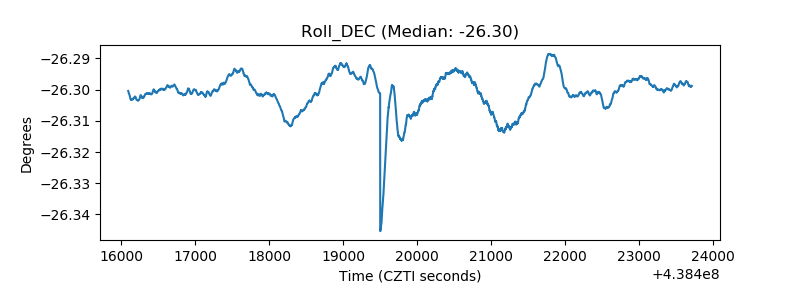 |
| _Roll_RA | 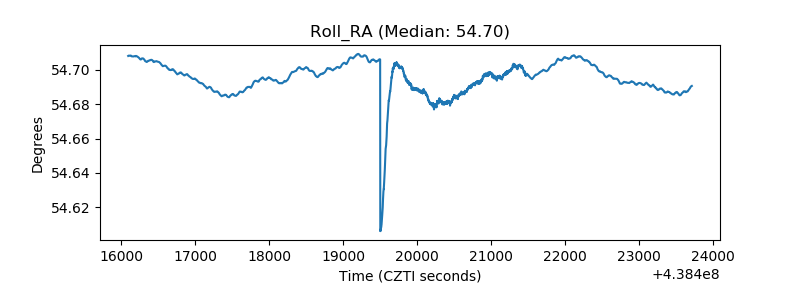 |
| Veto Counter | 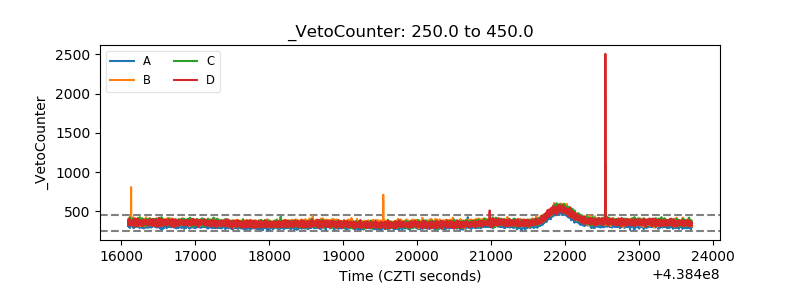 |