| Param | Original file | Final file |
|---|---|---|
| Filename | modeM0/AS1A13_012T01_9000005942_44092cztM0_level2.fits | modeM0/AS1A13_012T01_9000005942_44092cztM0_level2_quad_clean.evt |
| Size (bytes) | 430,764,480 | 59,333,760 |
| Size | 410.8 MB | 56.6 MB |
| Events in quadrant A | 7,783,333 | 167,131 |
| Events in quadrant B | 1,964,998 | 480,709 |
| Events in quadrant C | 1,956,932 | 459,058 |
| Events in quadrant D | 3,904,535 | 386,925 |
| Mode M9 | |||
|---|---|---|---|
| Quadrant | BADHDUFLAG | Total packets | Discarded packets |
| A | 0 | 7 | 0 |
| B | 0 | 7 | 0 |
| C | 0 | 7 | 0 |
| D | 0 | 7 | 0 |
| Mode M0 | |||
|---|---|---|---|
| Quadrant | BADHDUFLAG | Total packets | Discarded packets |
| A | 0 | 26100 | 1 |
| B | 0 | 8757 | 1 |
| C | 0 | 8862 | 1 |
| D | 0 | 14623 | 1 |
| Mode SS | |||
|---|---|---|---|
| Quadrant | BADHDUFLAG | Total packets | Discarded packets |
| A | 0 | 88 | 0 |
| B | 0 | 88 | 0 |
| C | 0 | 88 | 0 |
| D | 0 | 88 | 0 |
| Quadrant | Total seconds | Saturated seconds | Saturation percentage |
|---|---|---|---|
| A | 4299 | 2847 | 66.224703% |
| B | 4299 | 60 | 1.395673% |
| C | 4299 | 35 | 0.814143% |
| D | 4300 | 487 | 11.325581% |
Noise dominated data is calculated using 1-second bins in cleaned event files. If a bin has >2000 counts, and if more than 50% of those come from <1% of pixels, then it is considered to be noise-dominated and hence unusable.
| Quadrant | # 1 sec bins | Bins with >0 counts | Bins with >2000 counts | High rate bins dominated by noise | Noise dominated (total time) | Noise dominated (detector-on time) | Marked lightcurve |
|---|---|---|---|---|---|---|---|
| A | 5003 | 4297 | 2287 | 2287 | 45.71% | 53.22% | 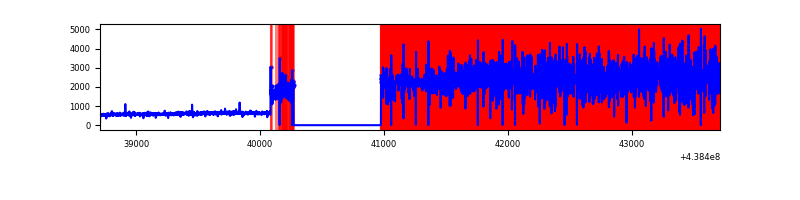 |
| B | 5004 | 4300 | 0 | 0 | 0.00% | 0.00% | 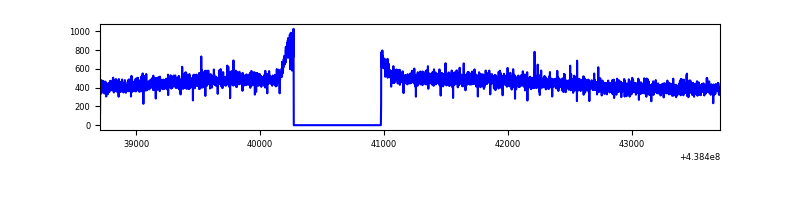 |
| C | 5004 | 4300 | 0 | 0 | 0.00% | 0.00% | 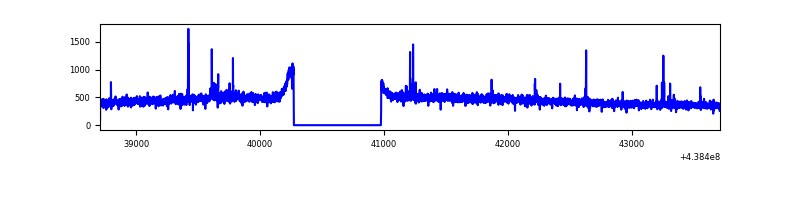 |
| D | 5005 | 4301 | 298 | 298 | 5.95% | 6.93% | 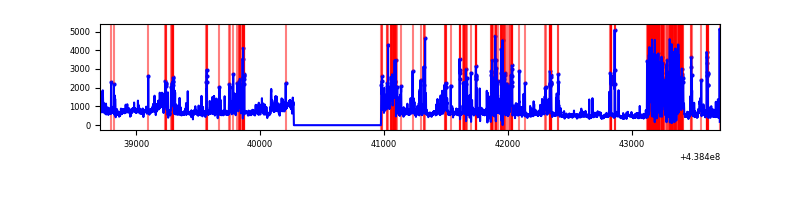 |
Top three noisy pixels from each quadrant. If the there are fewer than three noisy pixels in the level2.evt file, extra rows are filled as -1
| Pixel properties | Quadrant properties | ||||||
|---|---|---|---|---|---|---|---|
| Quadrant | DetID | PixID | Counts | Sigma | Mean | Median | Sigma |
| A | 15 | 223 | 6318180 | 110218.62 | 272 | 268 | 57.3 |
| A | 10 | 83 | 391484 | 6824.93 | 272 | 268 | 57.3 |
| A | 7 | 3 | 8636 | 145.98 | 272 | 268 | 57.3 |
| B | 12 | 111 | 12916 | 124.24 | 493 | 478 | 100.1 |
| B | 11 | 111 | 12001 | 115.1 | 493 | 478 | 100.1 |
| B | 14 | 111 | 11921 | 114.3 | 493 | 478 | 100.1 |
| C | 3 | 233 | 22218 | 186.75 | 487 | 489 | 116.4 |
| C | 14 | 96 | 16797 | 140.16 | 487 | 489 | 116.4 |
| C | 14 | 254 | 16522 | 137.8 | 487 | 489 | 116.4 |
| D | 1 | 52 | 1122247 | 9565.21 | 463 | 449 | 117.3 |
| D | 13 | 249 | 296057 | 2520.56 | 463 | 449 | 117.3 |
| D | 5 | 222 | 255308 | 2173.1 | 463 | 449 | 117.3 |
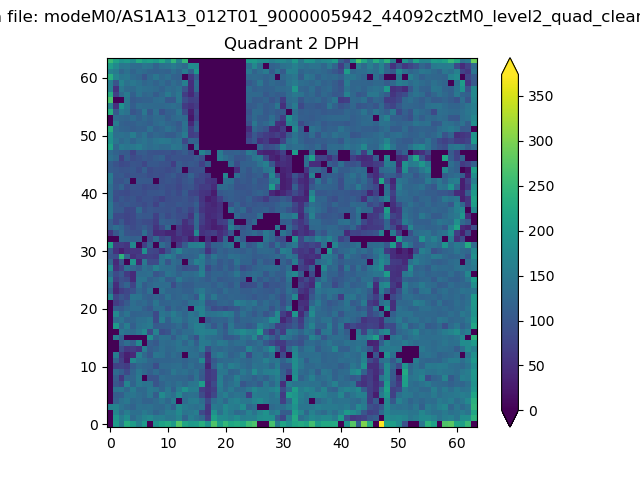
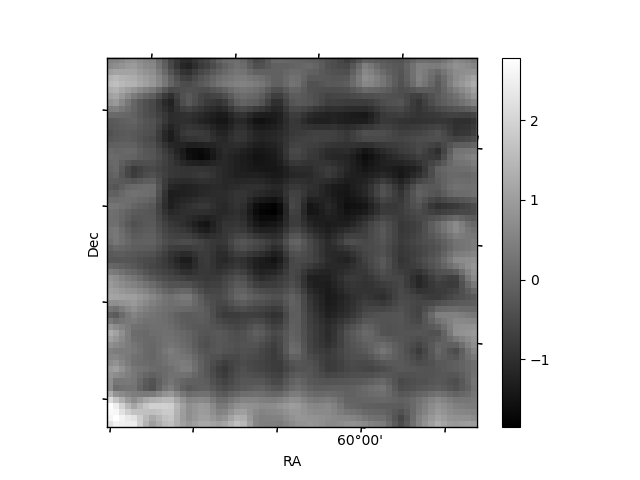
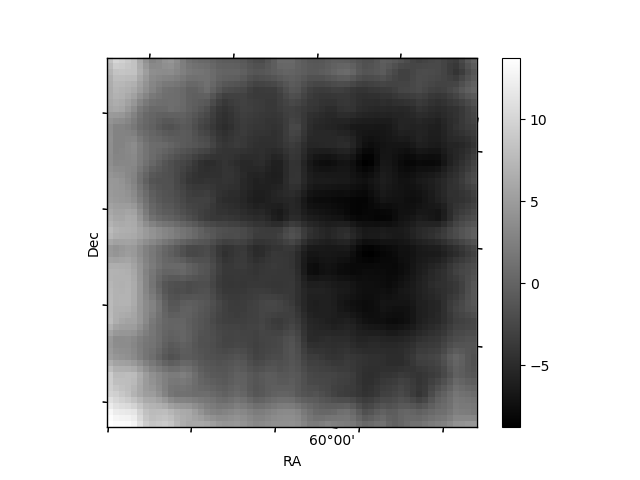
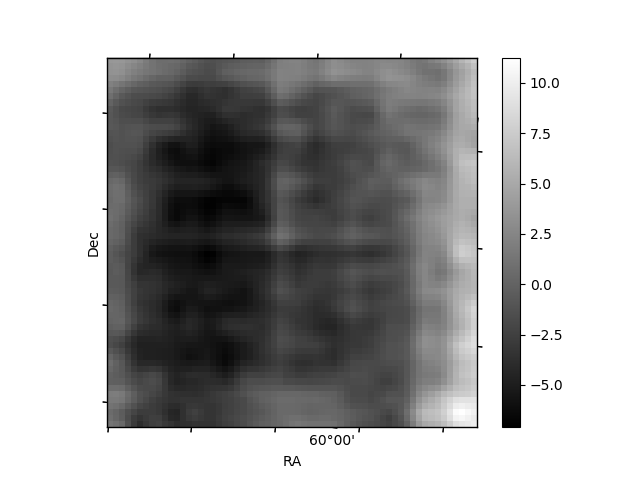
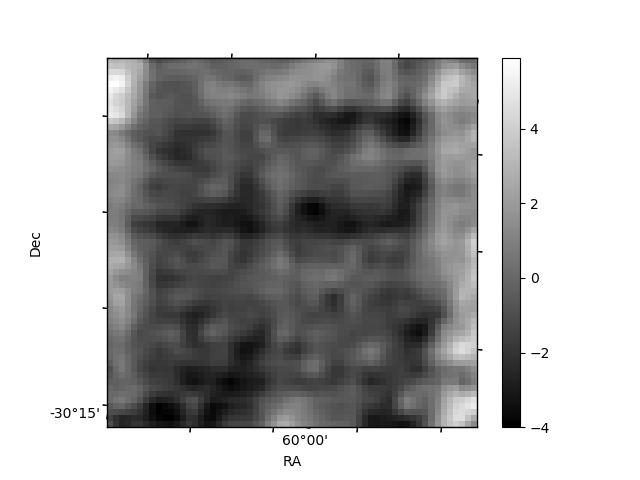
Histogram calculated using DETX and DETY for each event in the final _common_clean file
| Quadrant A | 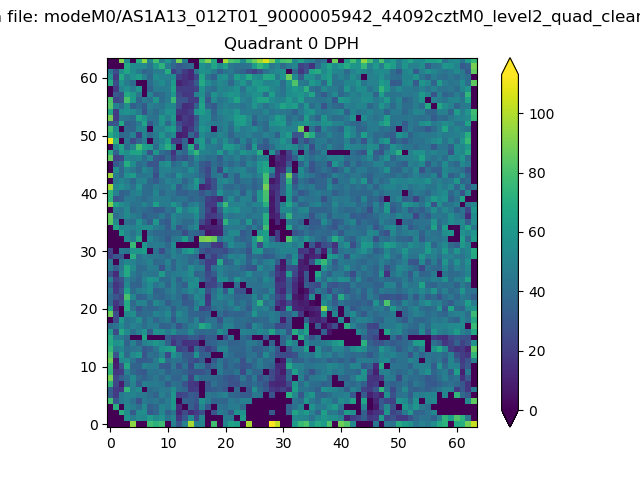 |
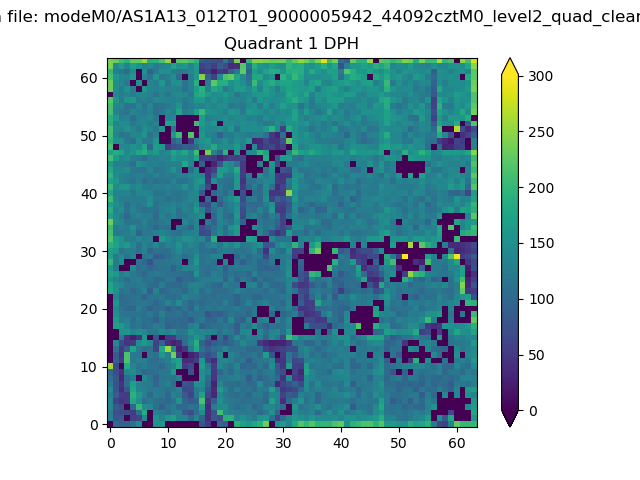 |
Quadrant B |
|---|---|---|---|
| Quadrant D | 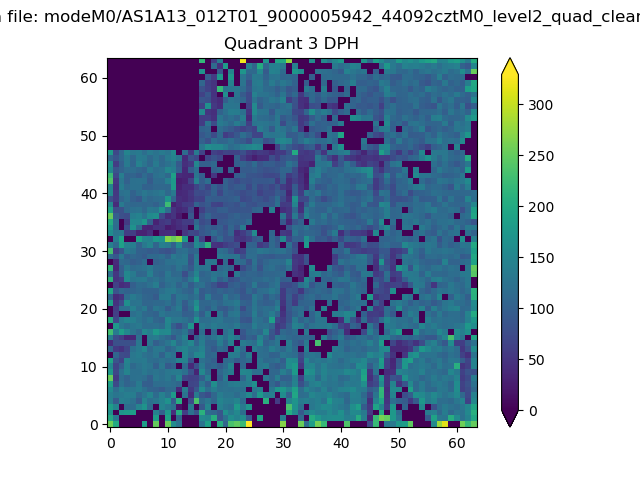 |
 |
Quadrant C |
| Plot type | Count rate plots | Images |
|---|---|---|
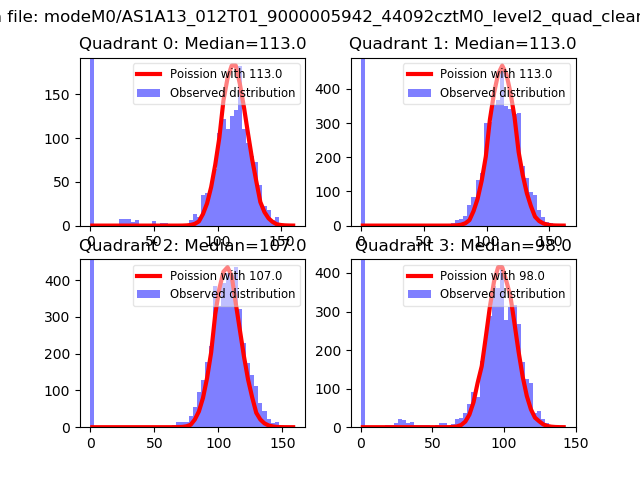
| Comparison with Poisson distribution Blue bars denote a histogram of data divided into 1 sec bins. Red curve is a Poisson curve with rate = median count rate of data. |
 |
 |
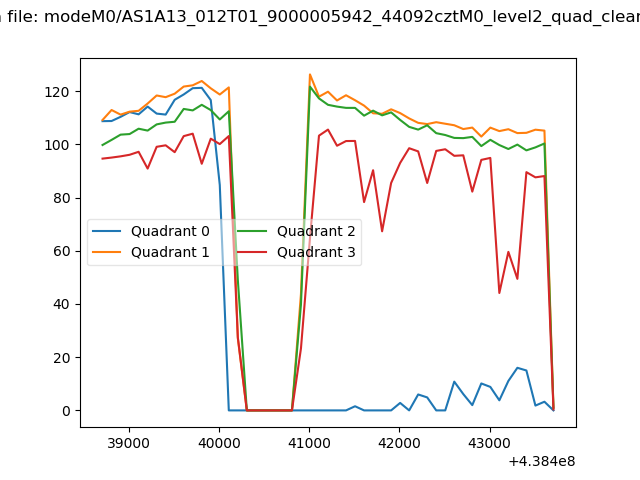
| Quadrant-wise count rates Data is divided into 100 sec bins |
 |
|
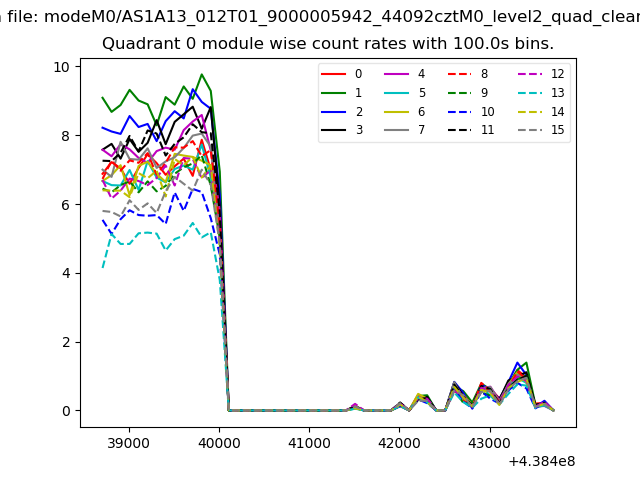
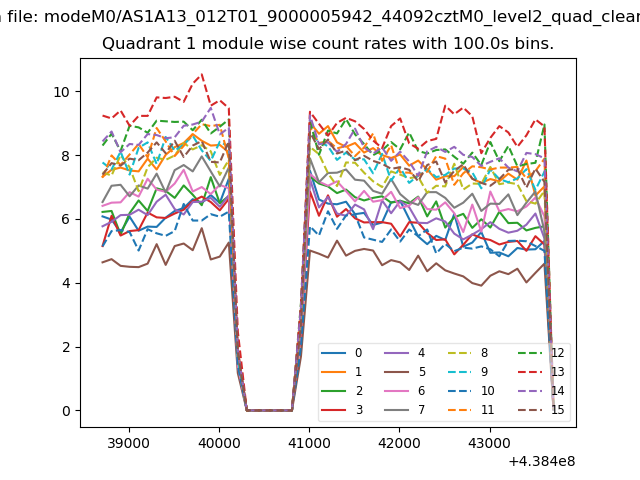
| Module-wise count rates for Quadrant A Data is divided into 100 sec bins |
 |
 |
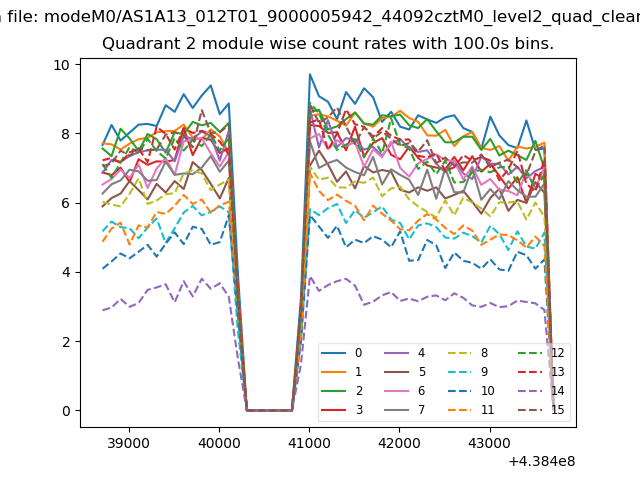
| Module-wise count rates for Quadrant B Data is divided into 100 sec bins |
 |
 |
| Module-wise count rates for Quadrant C Data is divided into 100 sec bins |
 |
 |
| Module-wise count rates for Quadrant D Data is divided into 100 sec bins |
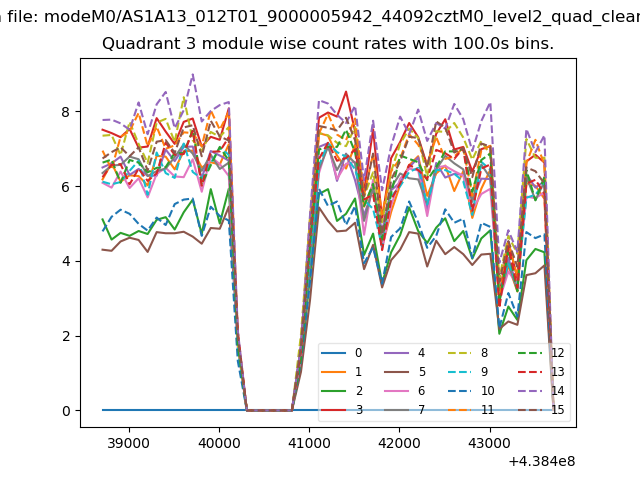 |
 |
| Parameter | Plot |
|---|---|
| CZT HV Monitor | 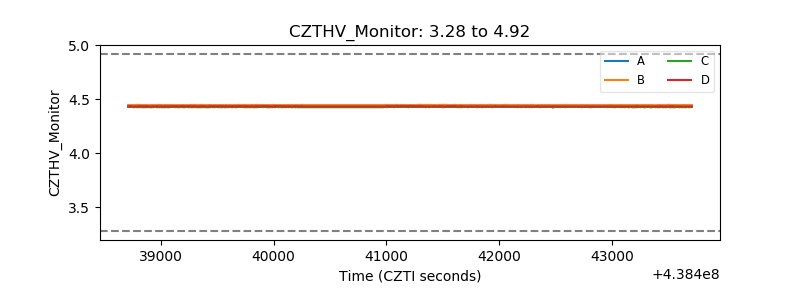 |
| D_VDD | 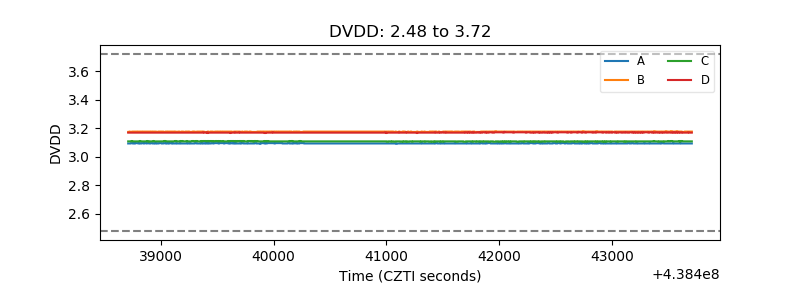 |
| Temperature 1 | 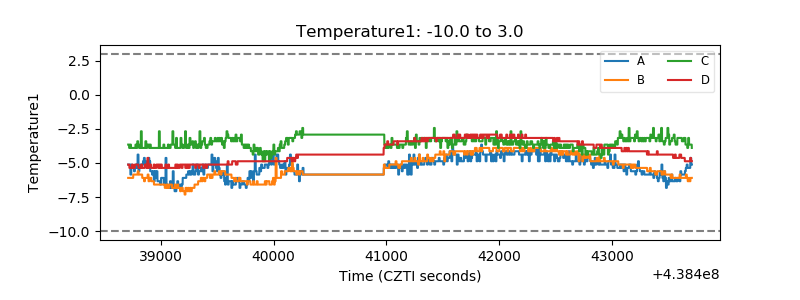 |
| Veto HV Monitor | 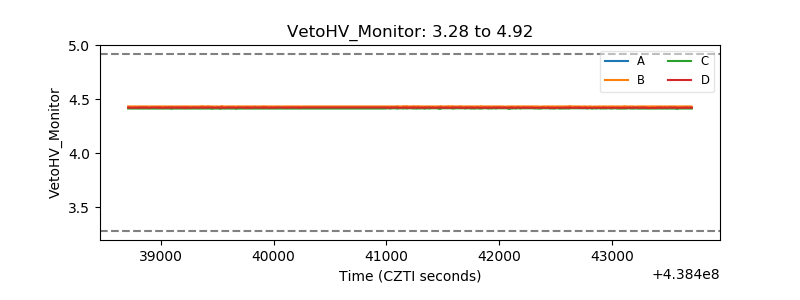 |
| Veto LLD | 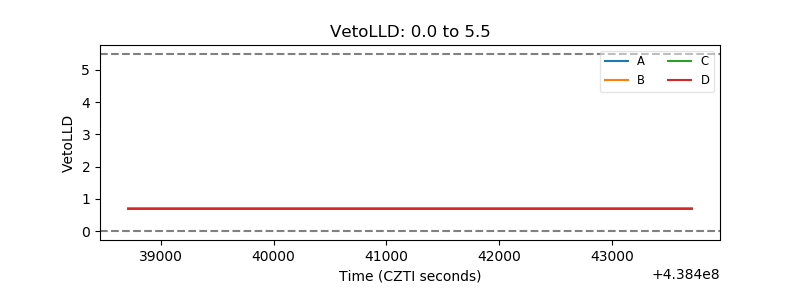 |
| Alpha Counter | 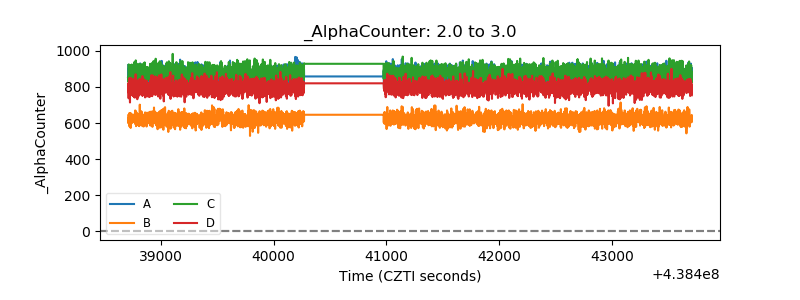 |
| _CPM_Rate | 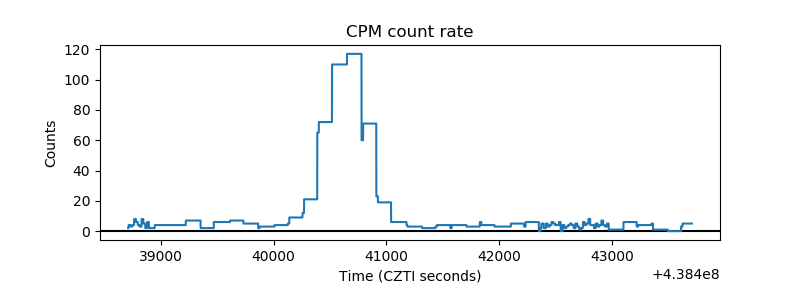 |
| CZT Counter | 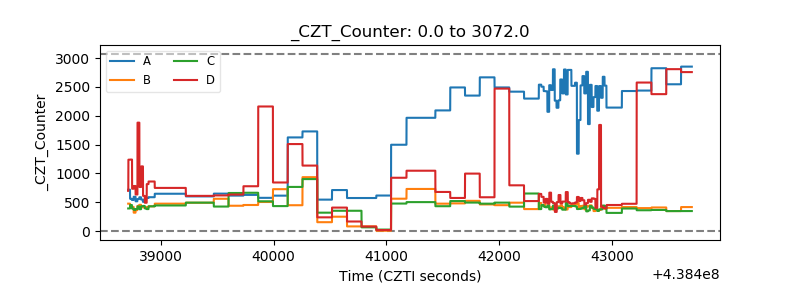 |
| +2.5 Volts monitor |  |
| +5 Volts monitor | 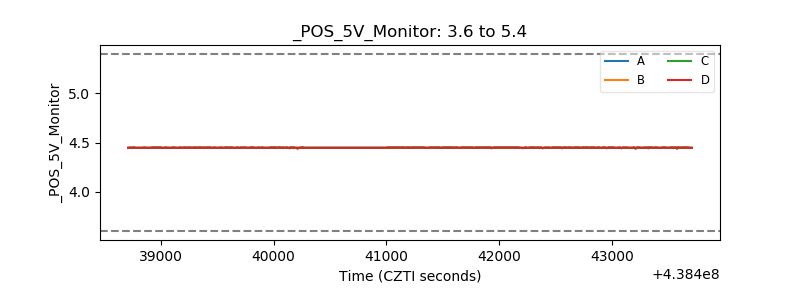 |
| _ROLL_ROT | 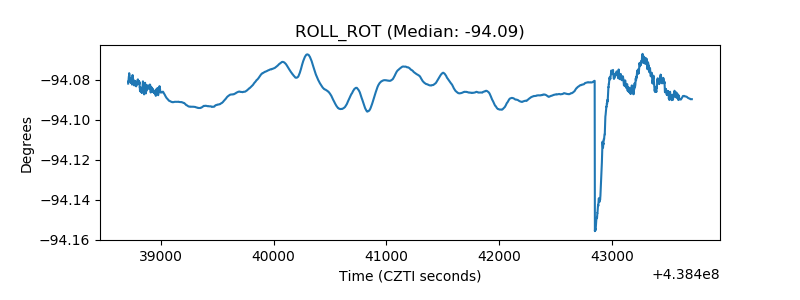 |
| _Roll_DEC | 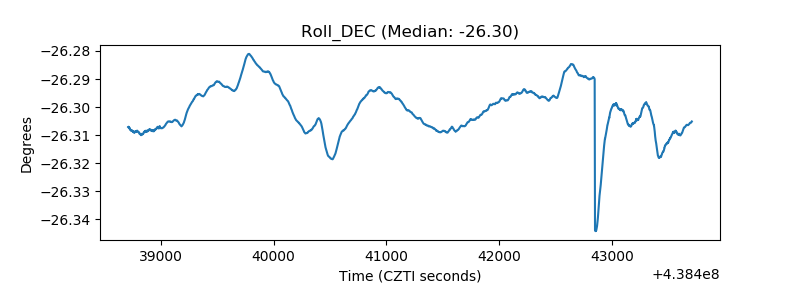 |
| _Roll_RA | 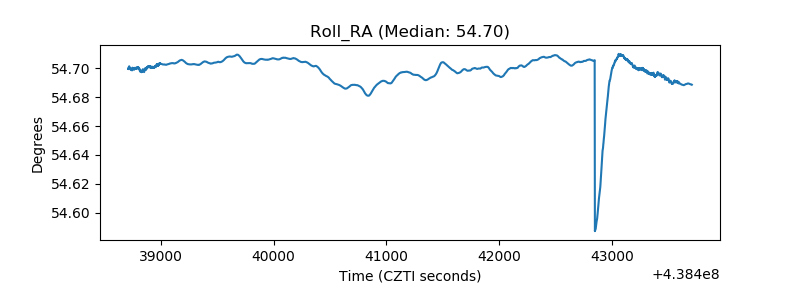 |
| Veto Counter | 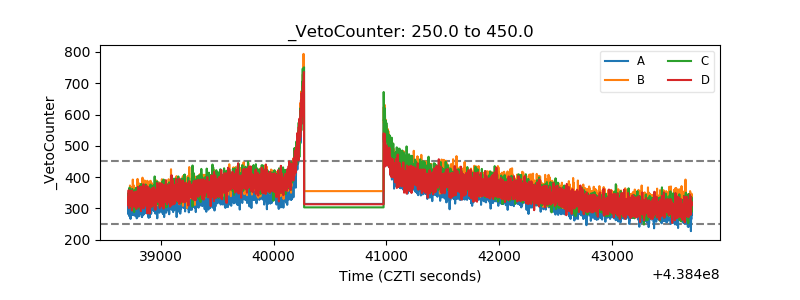 |