| Param | Original file | Final file |
|---|---|---|
| Filename | modeM0/AS1A13_038T01_9000005944_44092cztM0_level2.fits | modeM0/AS1A13_038T01_9000005944_44092cztM0_level2_quad_clean.evt |
| Size (bytes) | 352,612,800 | 38,070,720 |
| Size | 336.3 MB | 36.3 MB |
| Events in quadrant A | 6,764,628 | 35,181 |
| Events in quadrant B | 2,490,133 | 298,889 |
| Events in quadrant C | 1,406,314 | 321,122 |
| Events in quadrant D | 2,162,220 | 288,695 |
| Mode SS | |||
|---|---|---|---|
| Quadrant | BADHDUFLAG | Total packets | Discarded packets |
| A | 0 | 62 | 0 |
| B | 0 | 62 | 0 |
| C | 0 | 62 | 0 |
| D | 0 | 62 | 0 |
| Mode M9 | |||
|---|---|---|---|
| Quadrant | BADHDUFLAG | Total packets | Discarded packets |
| A | 0 | 9 | 0 |
| B | 0 | 9 | 0 |
| C | 0 | 9 | 0 |
| D | 0 | 9 | 0 |
| Mode M0 | |||
|---|---|---|---|
| Quadrant | BADHDUFLAG | Total packets | Discarded packets |
| A | 0 | 22086 | 4 |
| B | 0 | 9481 | 1 |
| C | 0 | 6146 | 1 |
| D | 0 | 8380 | 1 |
| Quadrant | Total seconds | Saturated seconds | Saturation percentage |
|---|---|---|---|
| A | 2924 | 2678 | 91.586867% |
| B | 2924 | 465 | 15.902873% |
| C | 2924 | 38 | 1.299590% |
| D | 2924 | 148 | 5.061560% |
Noise dominated data is calculated using 1-second bins in cleaned event files. If a bin has >2000 counts, and if more than 50% of those come from <1% of pixels, then it is considered to be noise-dominated and hence unusable.
| Quadrant | # 1 sec bins | Bins with >0 counts | Bins with >2000 counts | High rate bins dominated by noise | Noise dominated (total time) | Noise dominated (detector-on time) | Marked lightcurve |
|---|---|---|---|---|---|---|---|
| A | 3824 | 2925 | 2038 | 2038 | 53.29% | 69.68% | 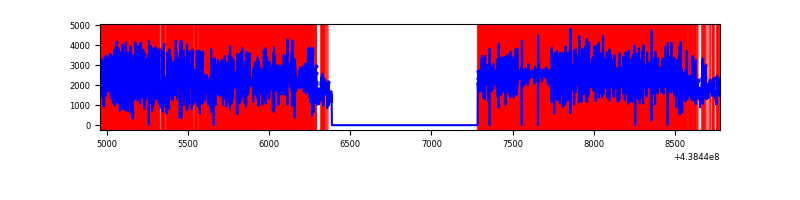 |
| B | 3824 | 2925 | 222 | 222 | 5.81% | 7.59% | 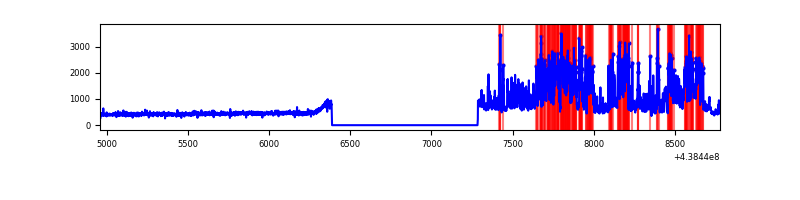 |
| C | 3824 | 2925 | 0 | 0 | 0.00% | 0.00% | 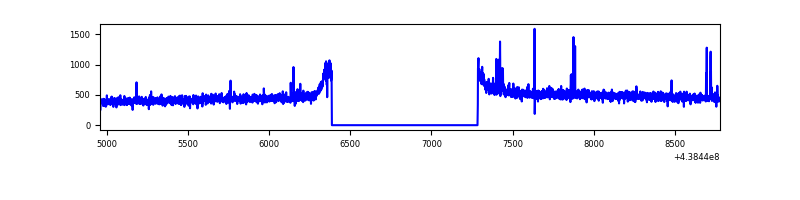 |
| D | 3824 | 2925 | 84 | 84 | 2.20% | 2.87% | 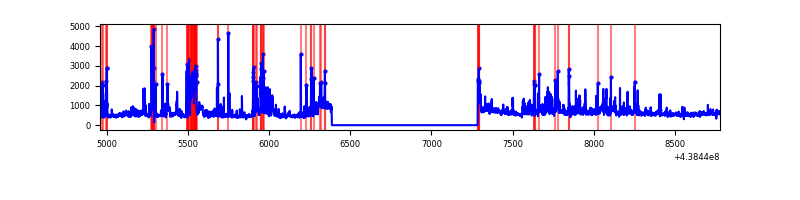 |
Top three noisy pixels from each quadrant. If the there are fewer than three noisy pixels in the level2.evt file, extra rows are filled as -1
| Pixel properties | Quadrant properties | ||||||
|---|---|---|---|---|---|---|---|
| Quadrant | DetID | PixID | Counts | Sigma | Mean | Median | Sigma |
| A | 15 | 223 | 5781875 | 169936.81 | 153 | 149 | 34.0 |
| A | 10 | 83 | 272425 | 8002.75 | 153 | 149 | 34.0 |
| A | 14 | 238 | 59534 | 1745.45 | 153 | 149 | 34.0 |
| B | 0 | 200 | 733991 | 10715.16 | 337 | 327 | 68.5 |
| B | 4 | 171 | 231639 | 3378.31 | 337 | 327 | 68.5 |
| B | 15 | 36 | 59464 | 863.7 | 337 | 327 | 68.5 |
| C | 14 | 96 | 23047 | 273.81 | 348 | 350 | 82.9 |
| C | 14 | 254 | 13079 | 153.56 | 348 | 350 | 82.9 |
| C | 3 | 233 | 11364 | 132.87 | 348 | 350 | 82.9 |
| D | 1 | 52 | 302147 | 3372.7 | 347 | 334 | 89.5 |
| D | 13 | 249 | 285266 | 3184.05 | 347 | 334 | 89.5 |
| D | 13 | 171 | 71766 | 798.24 | 347 | 334 | 89.5 |
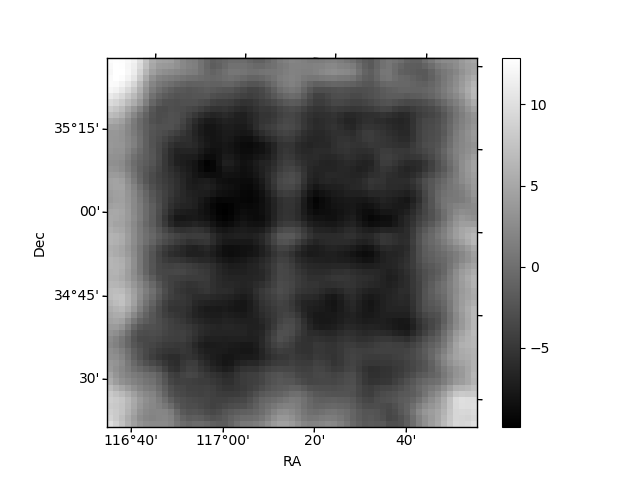
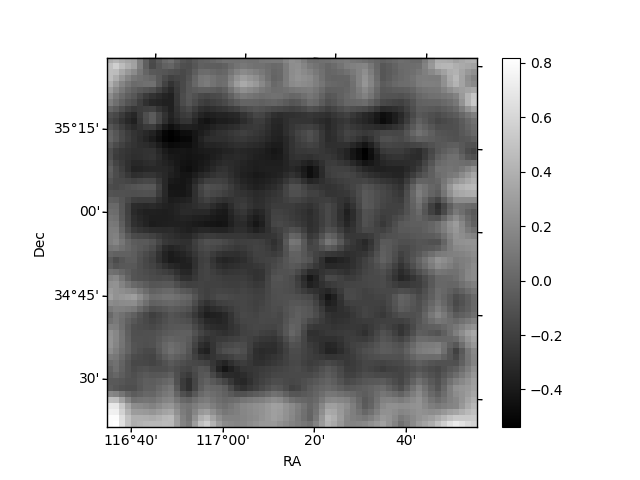
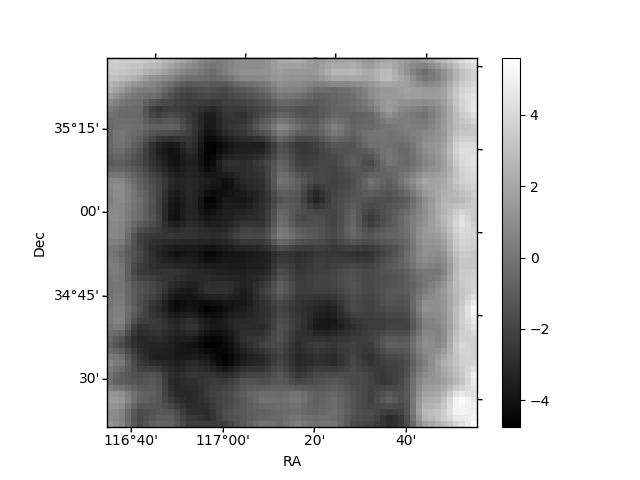
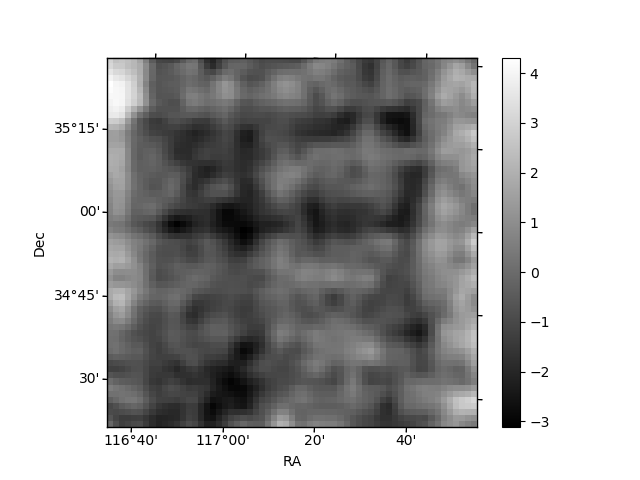
Histogram calculated using DETX and DETY for each event in the final _common_clean file
| Quadrant A | 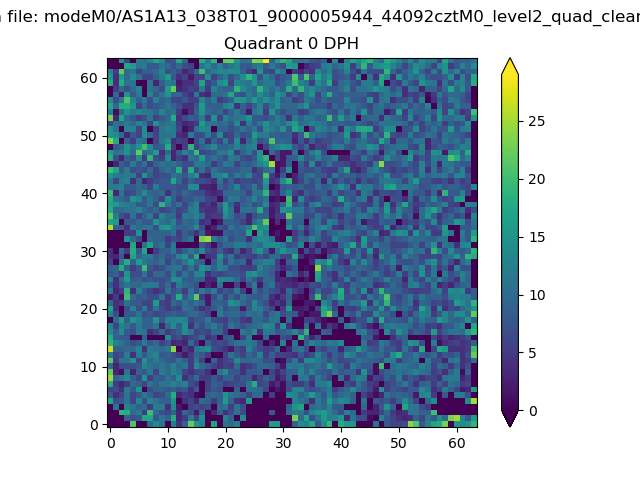 |
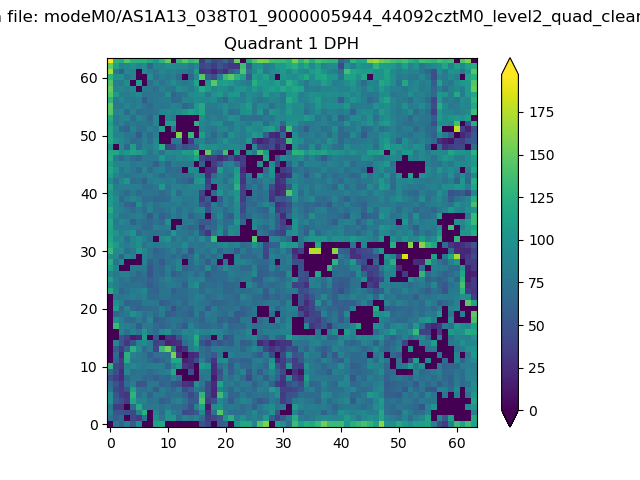 |
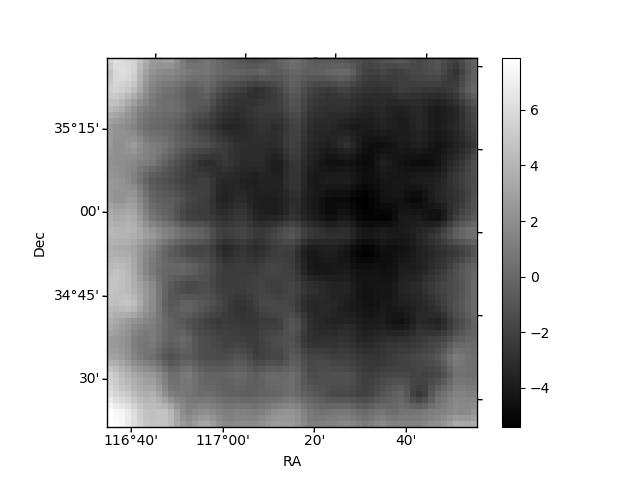
Quadrant B |
|---|---|---|---|
| Quadrant D | 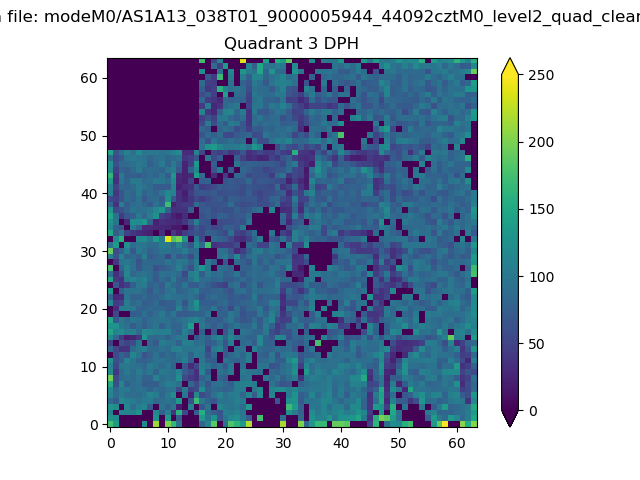 |
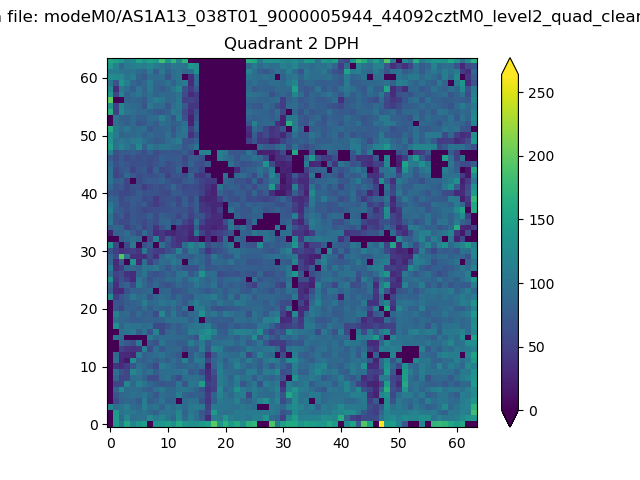 |
Quadrant C |
| Plot type | Count rate plots | Images |
|---|---|---|
| Comparison with Poisson distribution Blue bars denote a histogram of data divided into 1 sec bins. Red curve is a Poisson curve with rate = median count rate of data. |
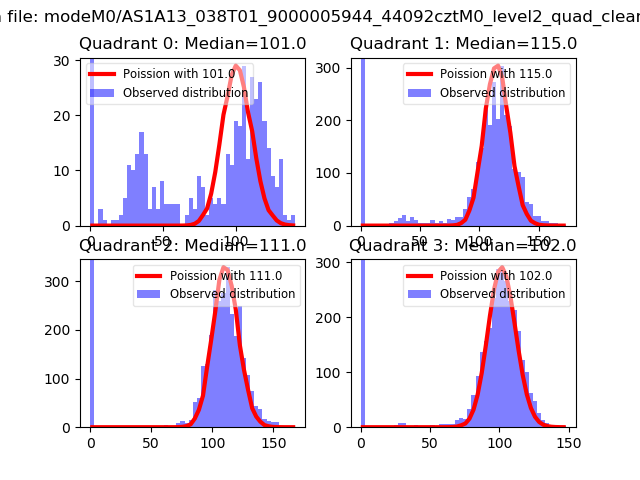 |
 |
| Quadrant-wise count rates Data is divided into 100 sec bins |
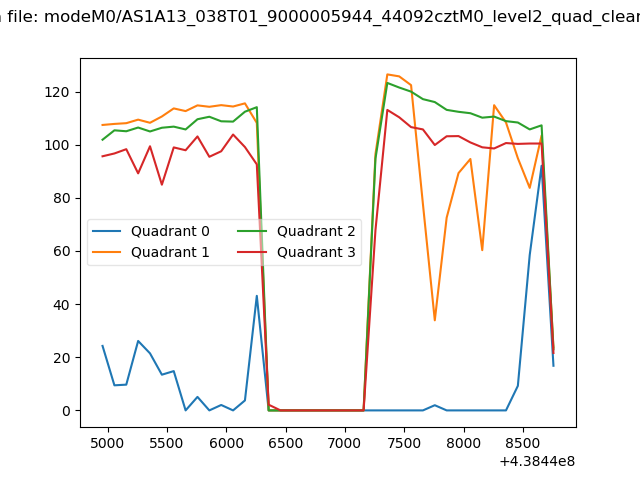 |
|
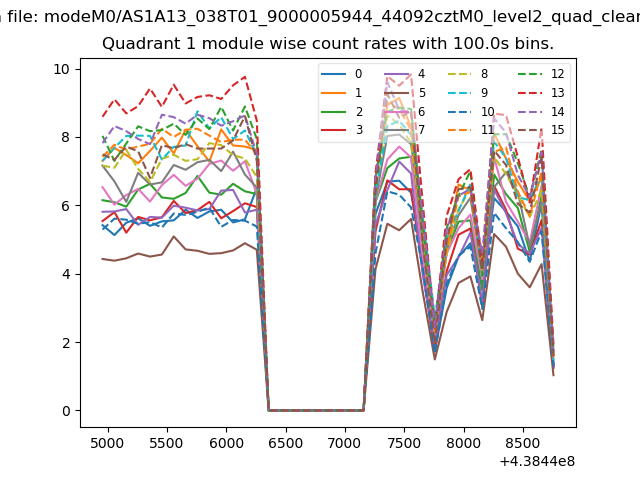
| Module-wise count rates for Quadrant A Data is divided into 100 sec bins |
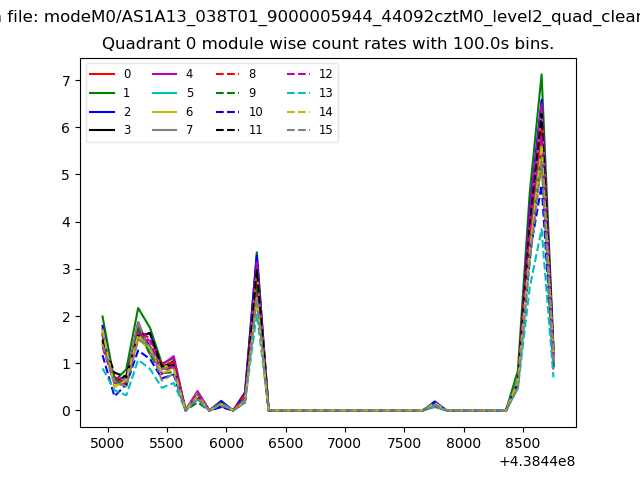 |
 |
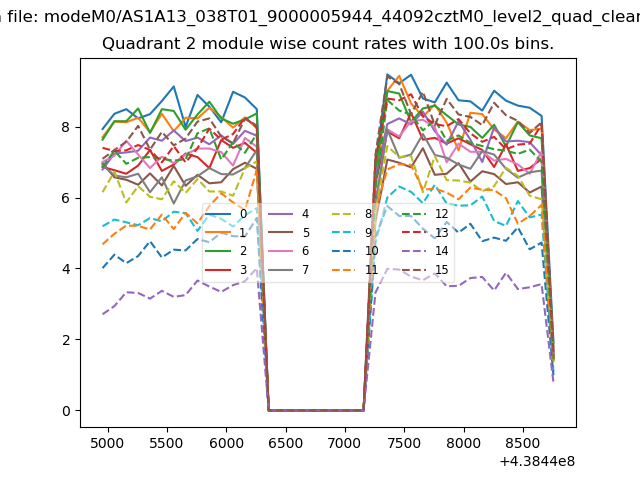
| Module-wise count rates for Quadrant B Data is divided into 100 sec bins |
 |
 |
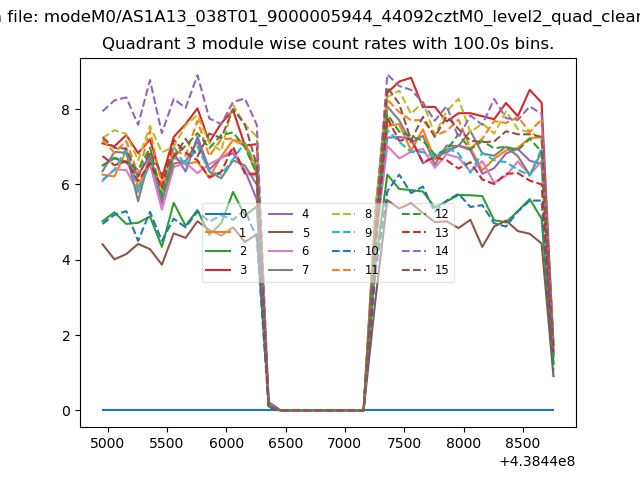
| Module-wise count rates for Quadrant C Data is divided into 100 sec bins |
 |
 |
| Module-wise count rates for Quadrant D Data is divided into 100 sec bins |
 |
 |
| Parameter | Plot |
|---|---|
| CZT HV Monitor | 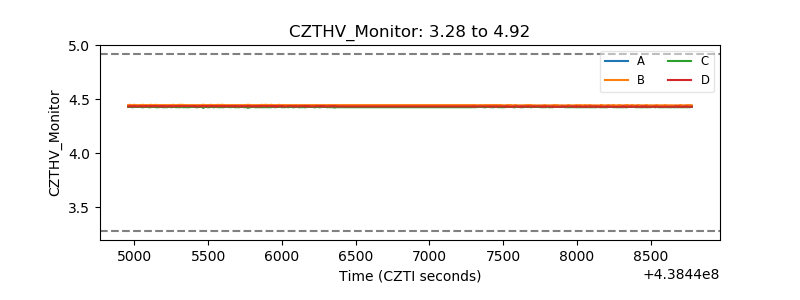 |
| D_VDD | 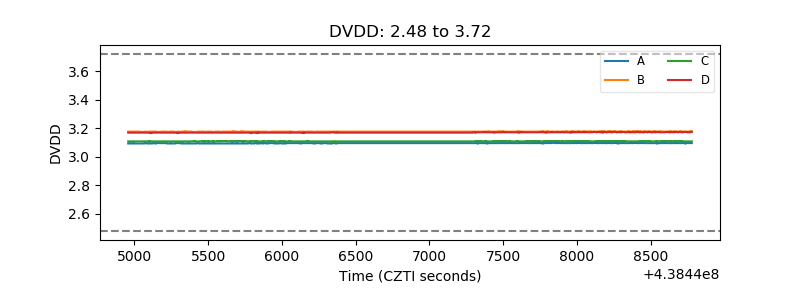 |
| Temperature 1 | 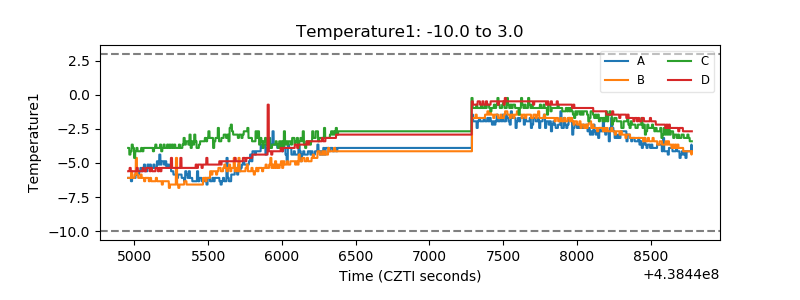 |
| Veto HV Monitor | 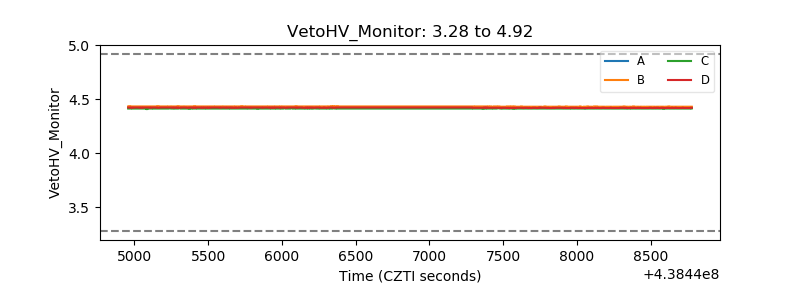 |
| Veto LLD | 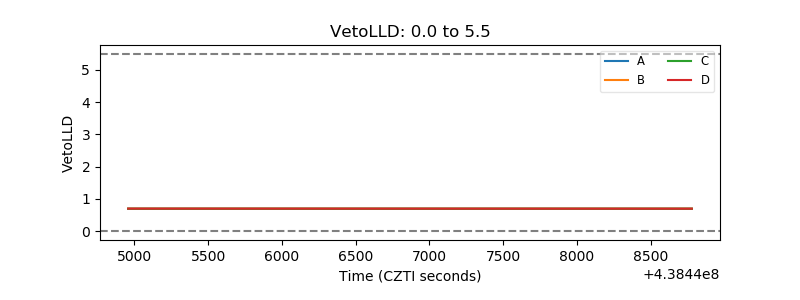 |
| Alpha Counter | 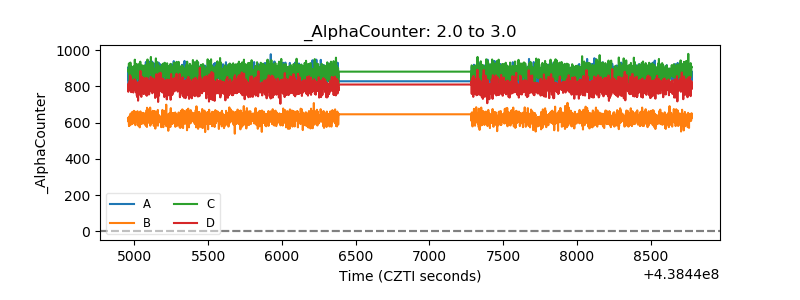 |
| _CPM_Rate | 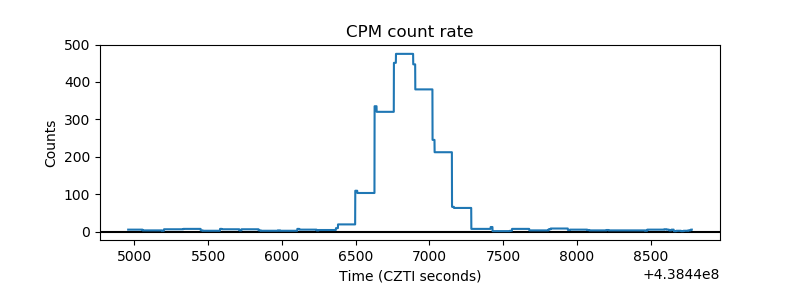 |
| CZT Counter | 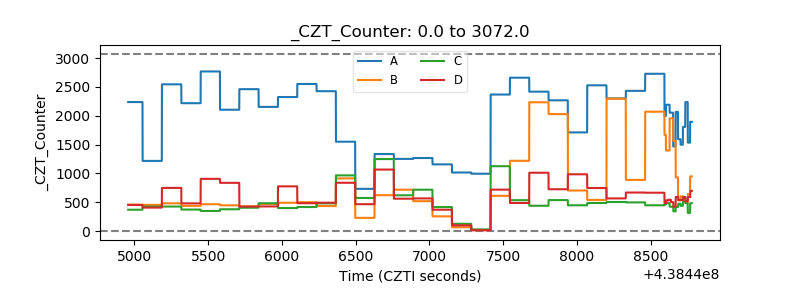 |
| +2.5 Volts monitor | 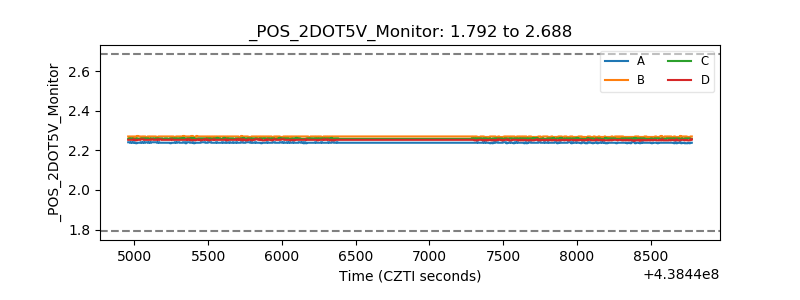 |
| +5 Volts monitor | 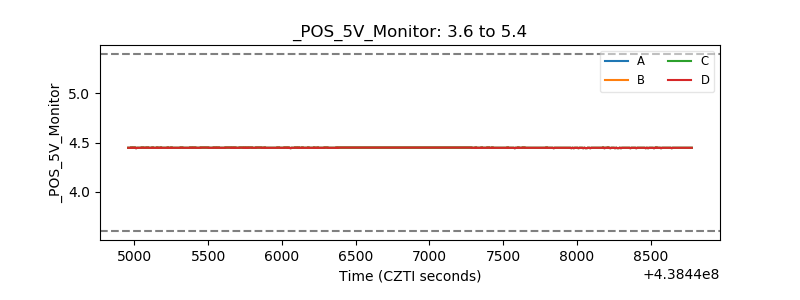 |
| _ROLL_ROT | 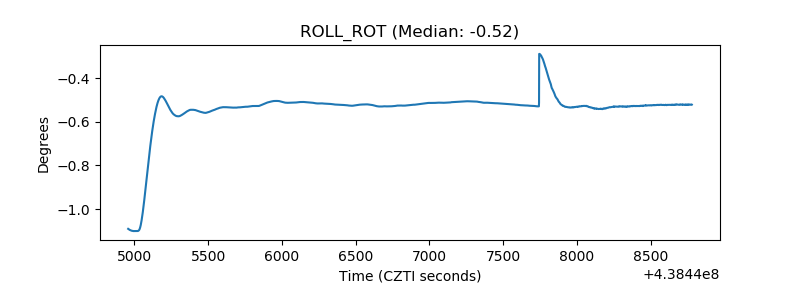 |
| _Roll_DEC | 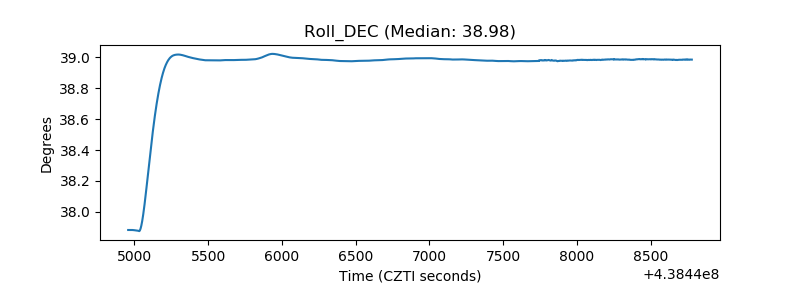 |
| _Roll_RA | 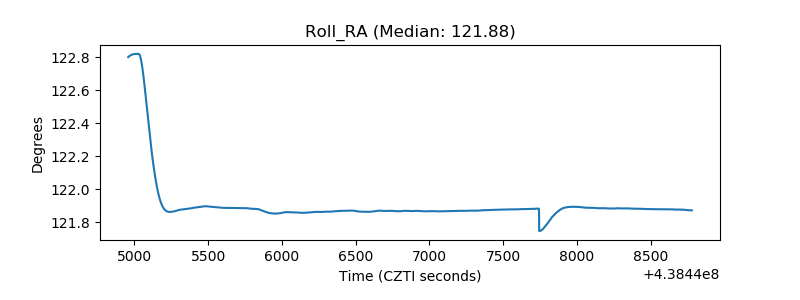 |
| Veto Counter | 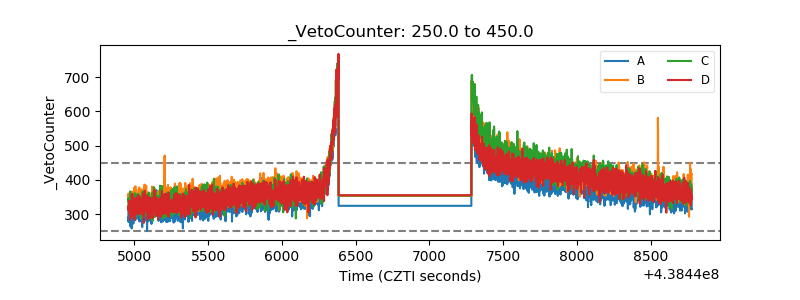 |