| Param | Original file | Final file |
|---|---|---|
| Filename | modeM0/AS1A13_038T01_9000005944_44094cztM0_level2.fits | modeM0/AS1A13_038T01_9000005944_44094cztM0_level2_quad_clean.evt |
| Size (bytes) | 612,725,760 | 86,624,640 |
| Size | 584.3 MB | 82.6 MB |
| Events in quadrant A | 11,475,966 | 294,431 |
| Events in quadrant B | 3,915,584 | 664,430 |
| Events in quadrant C | 2,760,252 | 656,205 |
| Events in quadrant D | 4,064,109 | 589,582 |
| Mode SS | |||
|---|---|---|---|
| Quadrant | BADHDUFLAG | Total packets | Discarded packets |
| A | 0 | 122 | 0 |
| B | 0 | 122 | 0 |
| C | 0 | 122 | 0 |
| D | 0 | 122 | 0 |
| Mode M9 | |||
|---|---|---|---|
| Quadrant | BADHDUFLAG | Total packets | Discarded packets |
| A | 0 | 11 | 0 |
| B | 0 | 11 | 0 |
| C | 0 | 11 | 0 |
| D | 0 | 11 | 0 |
| Mode M0 | |||
|---|---|---|---|
| Quadrant | BADHDUFLAG | Total packets | Discarded packets |
| A | 0 | 38214 | 6 |
| B | 0 | 15837 | 1 |
| C | 0 | 12410 | 1 |
| D | 0 | 16233 | 1 |
| Quadrant | Total seconds | Saturated seconds | Saturation percentage |
|---|---|---|---|
| A | 5982 | 3657 | 61.133400% |
| B | 5982 | 319 | 5.332665% |
| C | 5983 | 28 | 0.467993% |
| D | 5983 | 232 | 3.877653% |
Noise dominated data is calculated using 1-second bins in cleaned event files. If a bin has >2000 counts, and if more than 50% of those come from <1% of pixels, then it is considered to be noise-dominated and hence unusable.
| Quadrant | # 1 sec bins | Bins with >0 counts | Bins with >2000 counts | High rate bins dominated by noise | Noise dominated (total time) | Noise dominated (detector-on time) | Marked lightcurve |
|---|---|---|---|---|---|---|---|
| A | 7061 | 5981 | 2733 | 2733 | 38.71% | 45.69% | 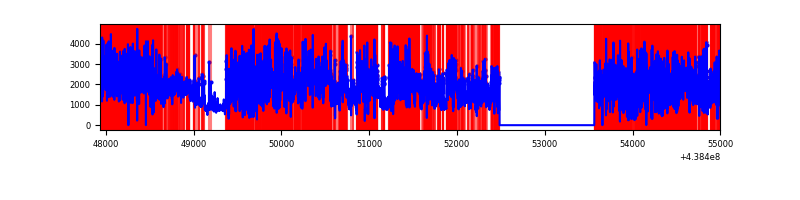 |
| B | 7062 | 5983 | 168 | 168 | 2.38% | 2.81% | 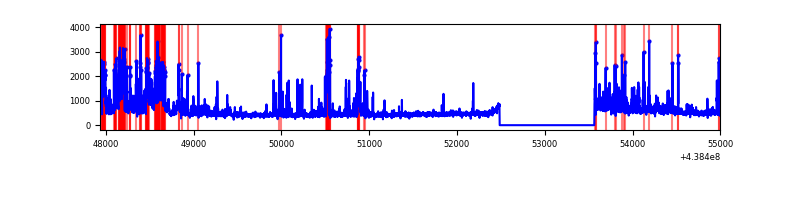 |
| C | 7063 | 5984 | 11 | 11 | 0.16% | 0.18% | 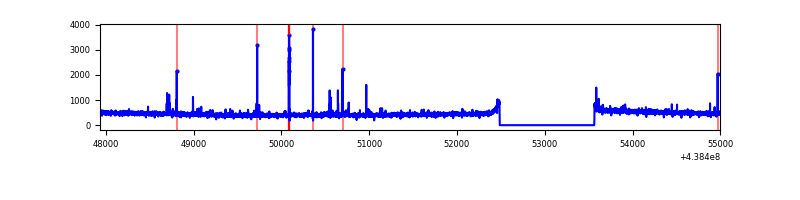 |
| D | 7063 | 5984 | 171 | 171 | 2.42% | 2.86% | 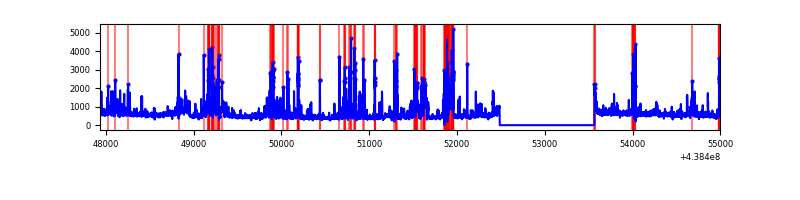 |
Top three noisy pixels from each quadrant. If the there are fewer than three noisy pixels in the level2.evt file, extra rows are filled as -1
| Pixel properties | Quadrant properties | ||||||
|---|---|---|---|---|---|---|---|
| Quadrant | DetID | PixID | Counts | Sigma | Mean | Median | Sigma |
| A | 15 | 223 | 8283524 | 87891.13 | 451 | 442 | 94.2 |
| A | 10 | 83 | 749679 | 7950.09 | 451 | 442 | 94.2 |
| A | 14 | 238 | 467350 | 4954.32 | 451 | 442 | 94.2 |
| B | 0 | 200 | 844026 | 6409.47 | 671 | 650 | 131.6 |
| B | 4 | 171 | 272494 | 2065.96 | 671 | 650 | 131.6 |
| B | 0 | 245 | 31363 | 233.41 | 671 | 650 | 131.6 |
| C | 14 | 254 | 86511 | 536.65 | 675 | 678 | 159.9 |
| C | 3 | 233 | 27952 | 170.52 | 675 | 678 | 159.9 |
| C | 14 | 96 | 17079 | 102.54 | 675 | 678 | 159.9 |
| D | 1 | 52 | 626654 | 3756.62 | 661 | 641 | 166.6 |
| D | 13 | 249 | 296297 | 1774.19 | 661 | 641 | 166.6 |
| D | 13 | 171 | 151700 | 906.48 | 661 | 641 | 166.6 |
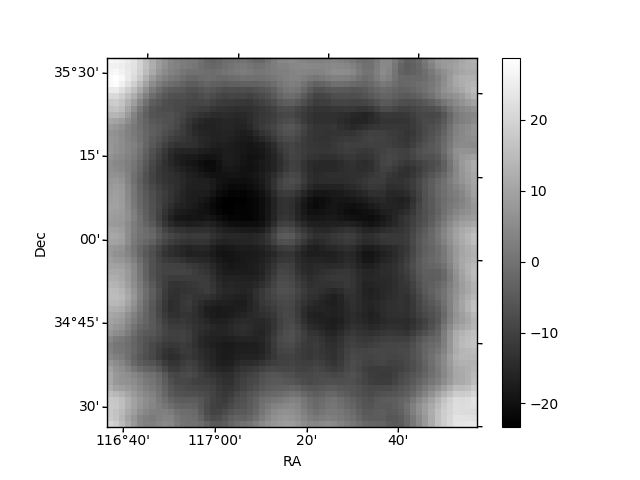
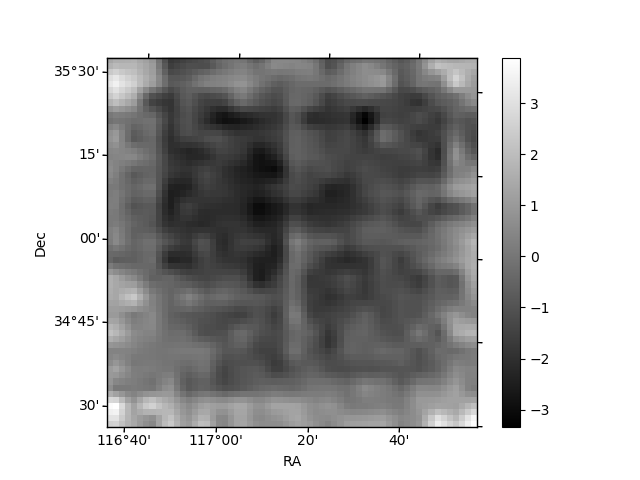
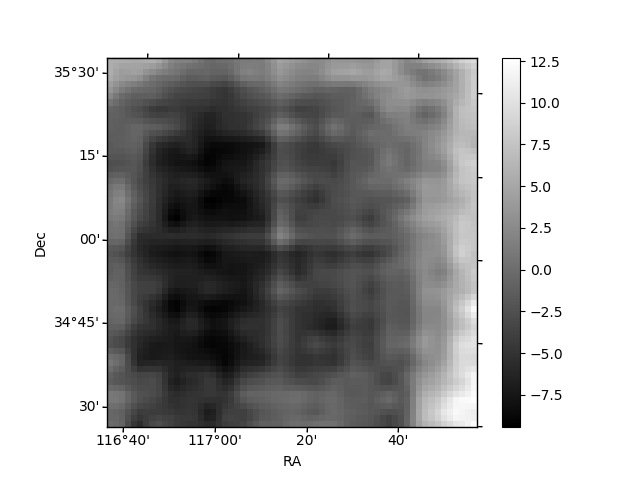
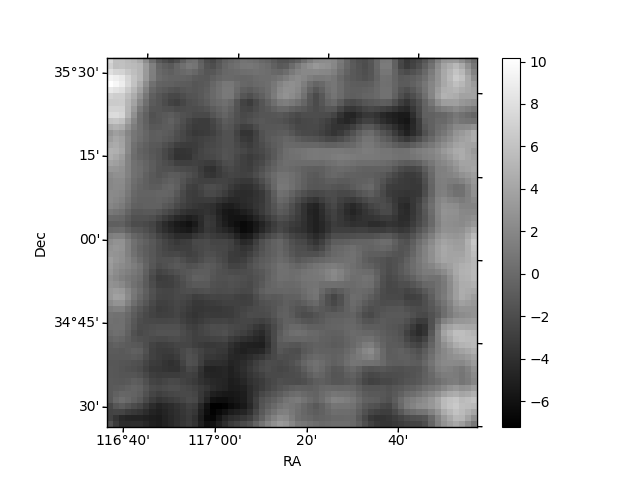
Histogram calculated using DETX and DETY for each event in the final _common_clean file
| Quadrant A | 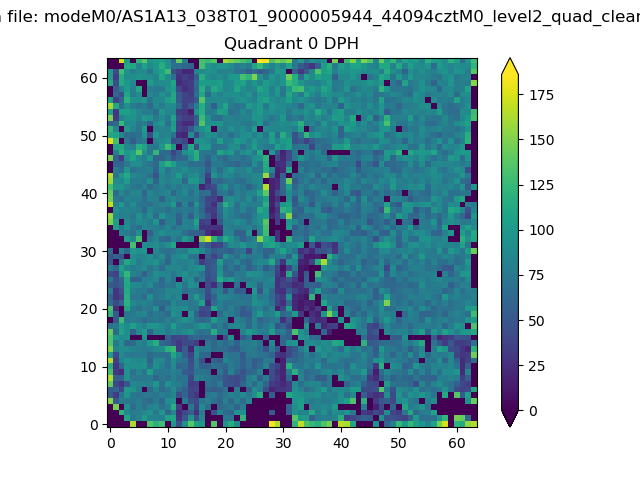 |
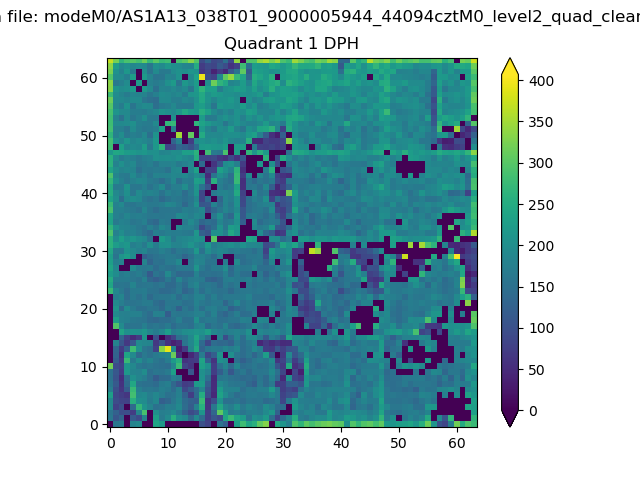 |
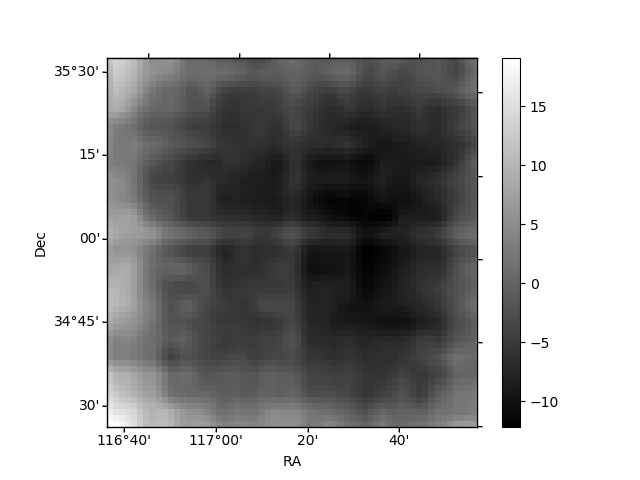
Quadrant B |
|---|---|---|---|
| Quadrant D | 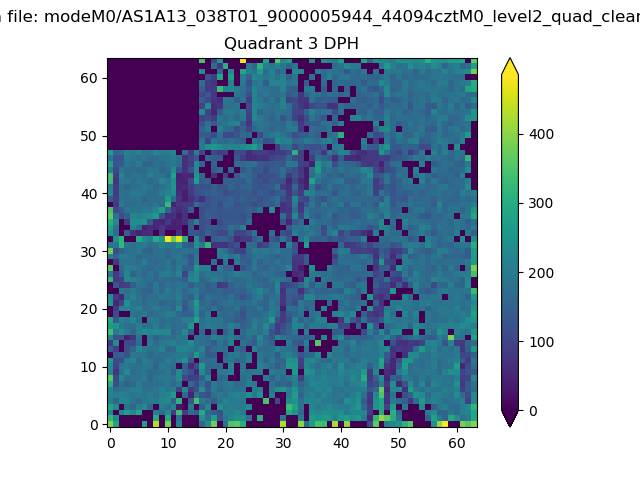 |
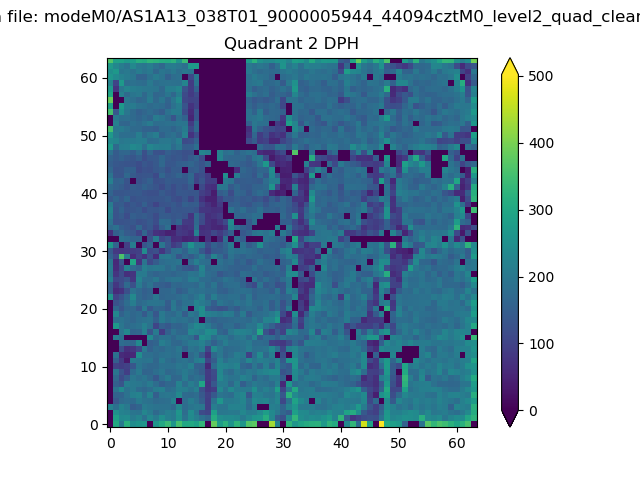 |
Quadrant C |
| Plot type | Count rate plots | Images |
|---|---|---|
| Comparison with Poisson distribution Blue bars denote a histogram of data divided into 1 sec bins. Red curve is a Poisson curve with rate = median count rate of data. |
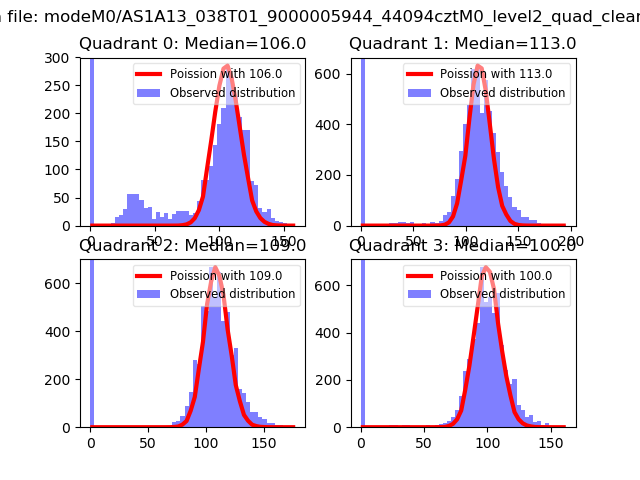 |
 |
| Quadrant-wise count rates Data is divided into 100 sec bins |
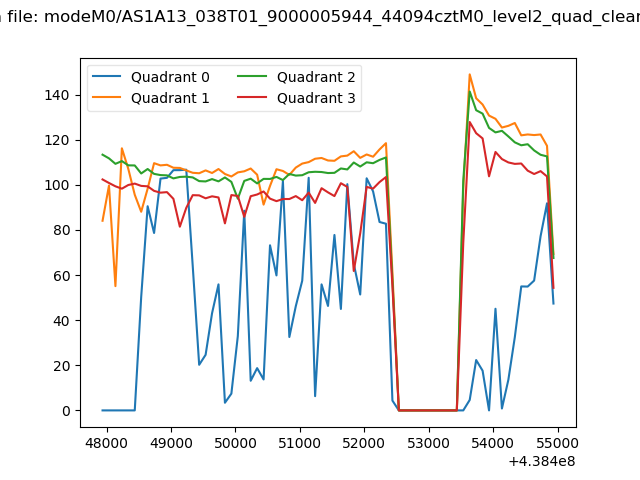 |
|
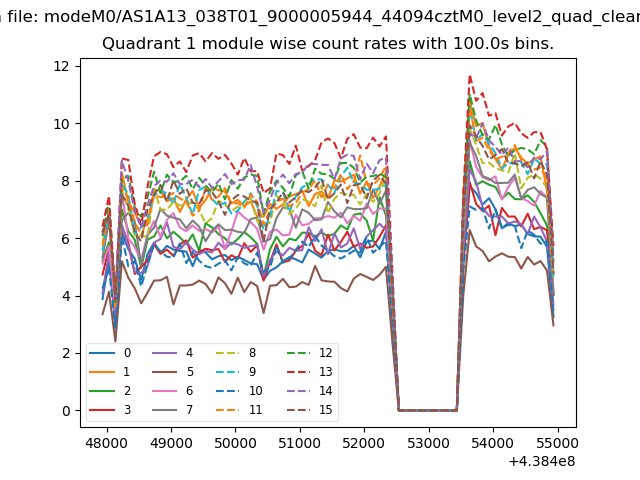
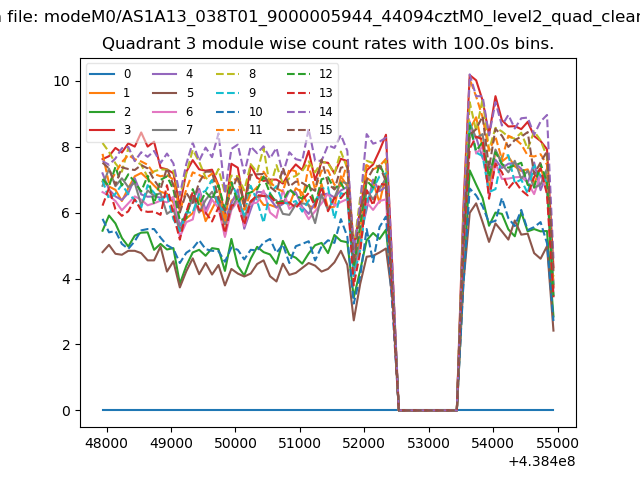
| Module-wise count rates for Quadrant A Data is divided into 100 sec bins |
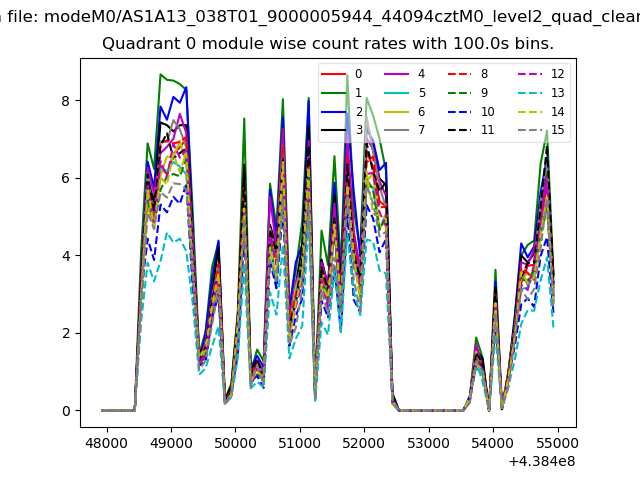 |
 |
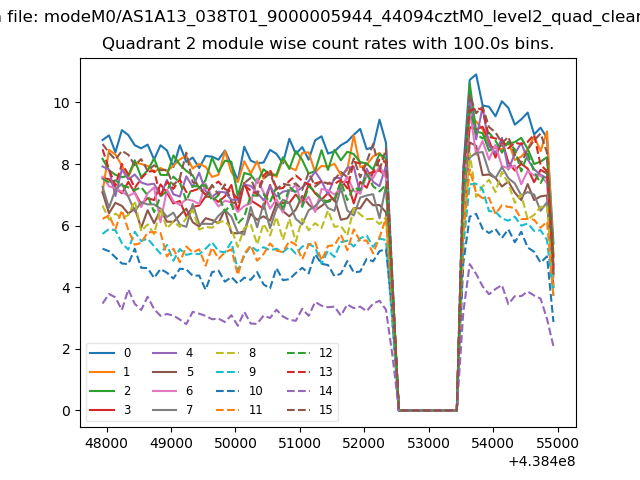
| Module-wise count rates for Quadrant B Data is divided into 100 sec bins |
 |
 |
| Module-wise count rates for Quadrant C Data is divided into 100 sec bins |
 |
 |
| Module-wise count rates for Quadrant D Data is divided into 100 sec bins |
 |
 |
| Parameter | Plot |
|---|---|
| CZT HV Monitor | 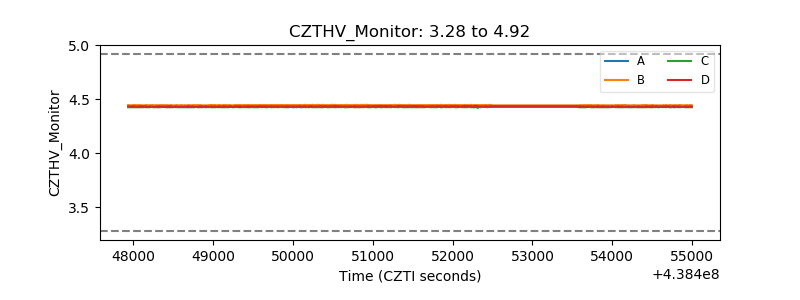 |
| D_VDD | 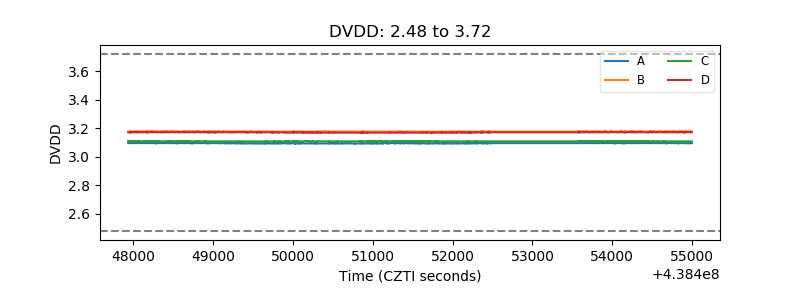 |
| Temperature 1 | 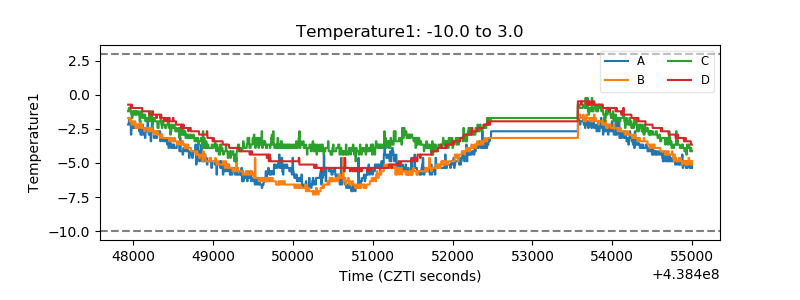 |
| Veto HV Monitor | 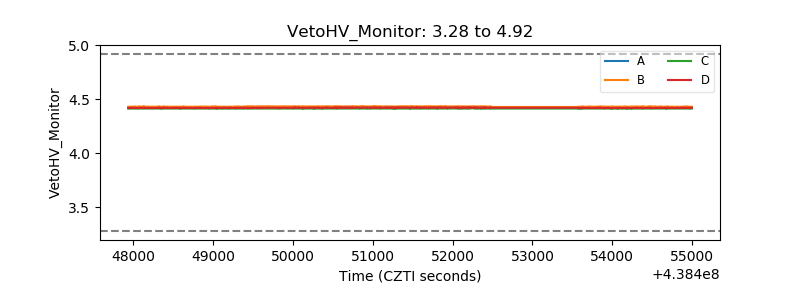 |
| Veto LLD | 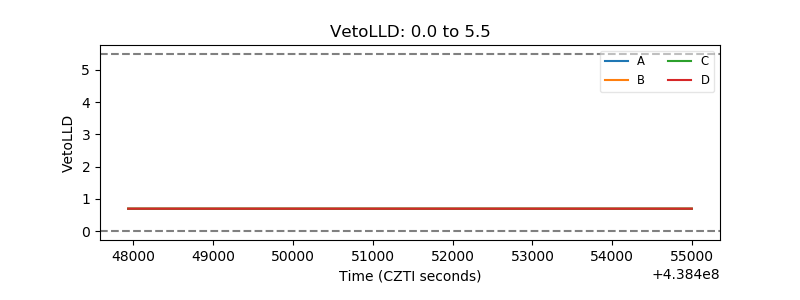 |
| Alpha Counter | 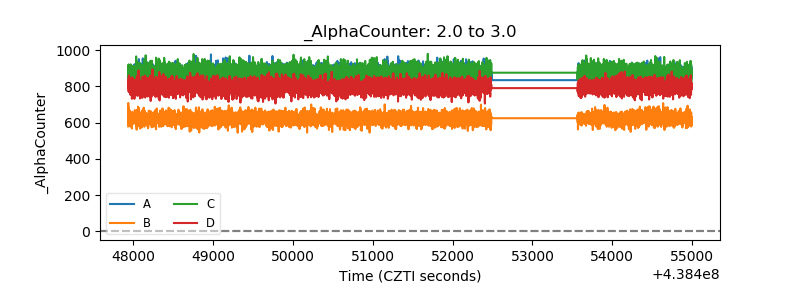 |
| _CPM_Rate | 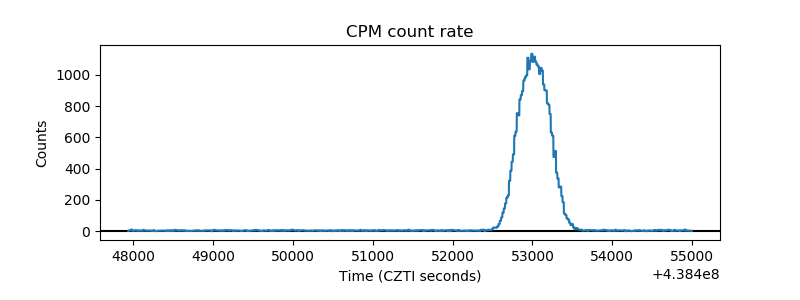 |
| CZT Counter | 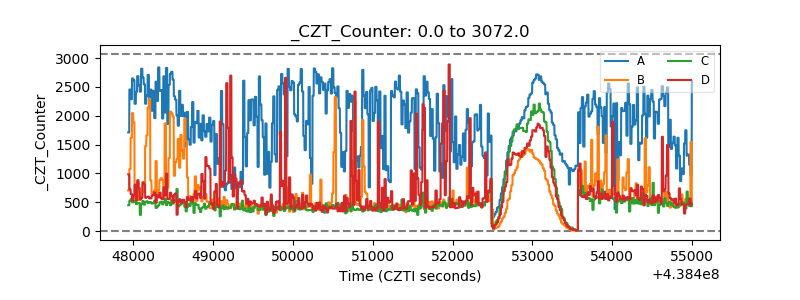 |
| +2.5 Volts monitor | 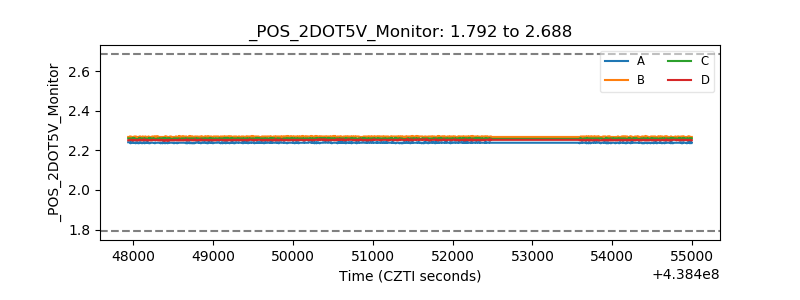 |
| +5 Volts monitor | 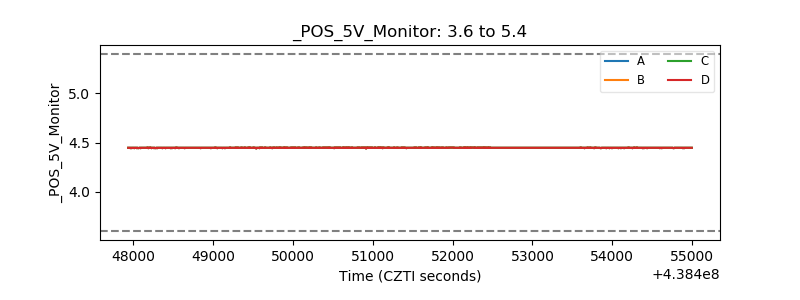 |
| _ROLL_ROT | 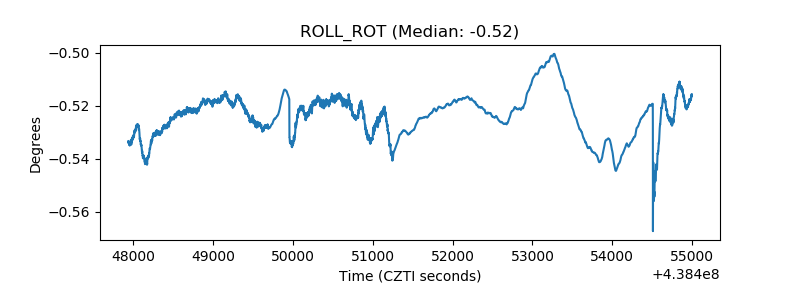 |
| _Roll_DEC | 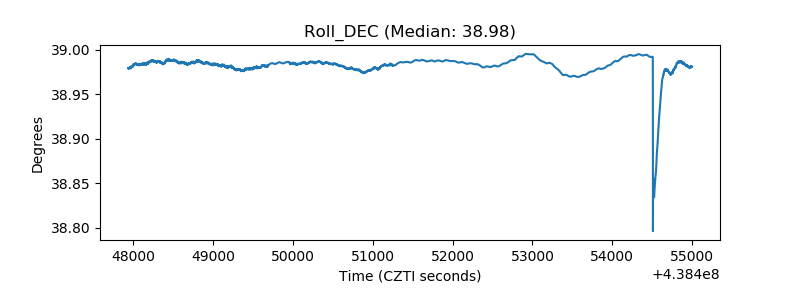 |
| _Roll_RA | 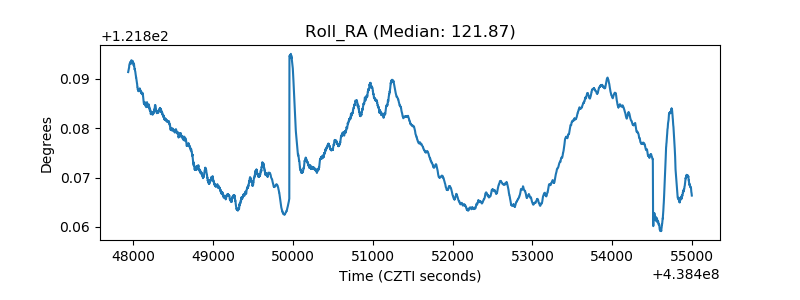 |
| Veto Counter | 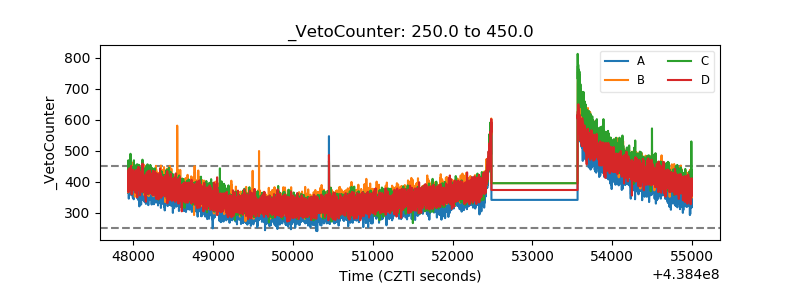 |