| Param | Original file | Final file |
|---|---|---|
| Filename | modeM0/AS1A13_038T01_9000005944_44095cztM0_level2.fits | modeM0/AS1A13_038T01_9000005944_44095cztM0_level2_quad_clean.evt |
| Size (bytes) | 626,189,760 | 97,718,400 |
| Size | 597.2 MB | 93.2 MB |
| Events in quadrant A | 11,415,820 | 307,523 |
| Events in quadrant B | 3,690,959 | 777,775 |
| Events in quadrant C | 3,145,631 | 756,052 |
| Events in quadrant D | 4,422,760 | 665,064 |
| Mode SS | |||
|---|---|---|---|
| Quadrant | BADHDUFLAG | Total packets | Discarded packets |
| A | 0 | 132 | 0 |
| B | 0 | 132 | 0 |
| C | 0 | 132 | 0 |
| D | 0 | 132 | 0 |
| Mode M9 | |||
|---|---|---|---|
| Quadrant | BADHDUFLAG | Total packets | Discarded packets |
| A | 0 | 19 | 0 |
| B | 0 | 20 | 0 |
| C | 0 | 20 | 0 |
| D | 0 | 20 | 0 |
| Mode M0 | |||
|---|---|---|---|
| Quadrant | BADHDUFLAG | Total packets | Discarded packets |
| A | 0 | 38424 | 2 |
| B | 0 | 15504 | 2 |
| C | 0 | 13821 | 3 |
| D | 0 | 17674 | 2 |
| Quadrant | Total seconds | Saturated seconds | Saturation percentage |
|---|---|---|---|
| A | 6482 | 4080 | 62.943536% |
| B | 6482 | 212 | 3.270595% |
| C | 6481 | 55 | 0.848634% |
| D | 6481 | 338 | 5.215245% |
Noise dominated data is calculated using 1-second bins in cleaned event files. If a bin has >2000 counts, and if more than 50% of those come from <1% of pixels, then it is considered to be noise-dominated and hence unusable.
| Quadrant | # 1 sec bins | Bins with >0 counts | Bins with >2000 counts | High rate bins dominated by noise | Noise dominated (total time) | Noise dominated (detector-on time) | Marked lightcurve |
|---|---|---|---|---|---|---|---|
| A | 7606 | 6482 | 2534 | 2534 | 33.32% | 39.09% | 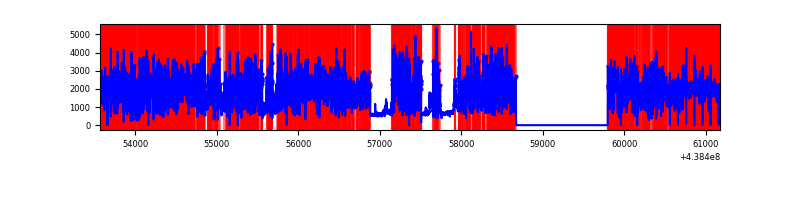 |
| B | 7607 | 6483 | 53 | 53 | 0.70% | 0.82% | 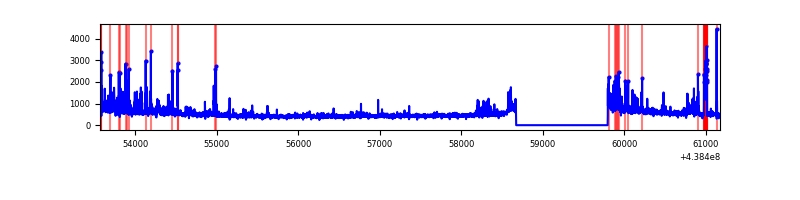 |
| C | 7606 | 6482 | 3 | 3 | 0.04% | 0.05% | 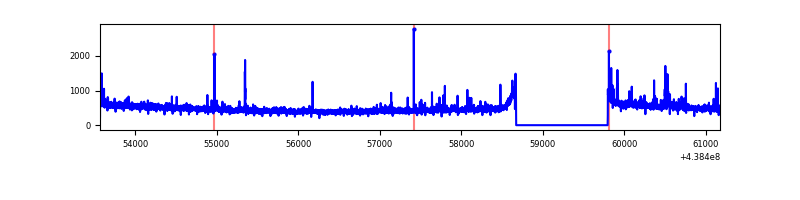 |
| D | 7606 | 6482 | 190 | 190 | 2.50% | 2.93% | 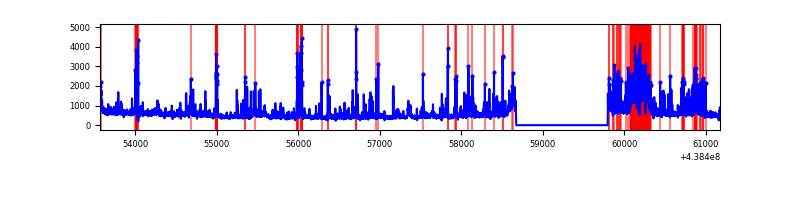 |
Top three noisy pixels from each quadrant. If the there are fewer than three noisy pixels in the level2.evt file, extra rows are filled as -1
| Pixel properties | Quadrant properties | ||||||
|---|---|---|---|---|---|---|---|
| Quadrant | DetID | PixID | Counts | Sigma | Mean | Median | Sigma |
| A | 15 | 223 | 8652052 | 90497.56 | 461 | 452 | 95.6 |
| A | 10 | 83 | 799967 | 8363.1 | 461 | 452 | 95.6 |
| A | 15 | 222 | 108464 | 1129.83 | 461 | 452 | 95.6 |
| B | 4 | 171 | 352656 | 2329.69 | 770 | 748 | 151.1 |
| B | 0 | 200 | 123231 | 810.86 | 770 | 748 | 151.1 |
| B | 4 | 173 | 46806 | 304.91 | 770 | 748 | 151.1 |
| C | 14 | 96 | 51617 | 283.92 | 767 | 772 | 179.1 |
| C | 14 | 254 | 48557 | 266.83 | 767 | 772 | 179.1 |
| C | 3 | 233 | 46612 | 255.97 | 767 | 772 | 179.1 |
| D | 1 | 52 | 363226 | 1917.2 | 752 | 730 | 189.1 |
| D | 12 | 222 | 248883 | 1312.45 | 752 | 730 | 189.1 |
| D | 12 | 233 | 208634 | 1099.58 | 752 | 730 | 189.1 |
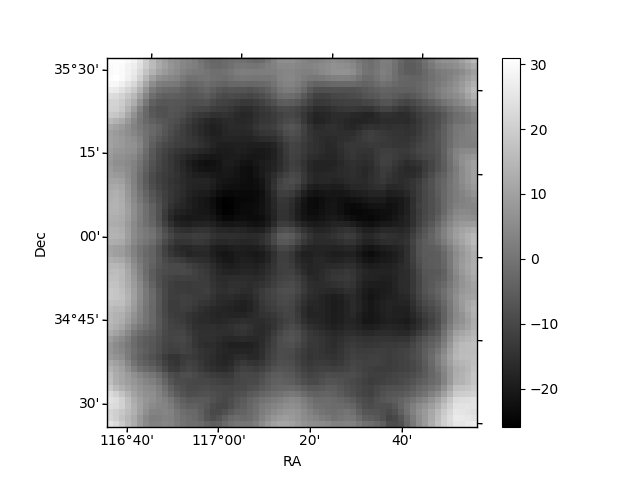
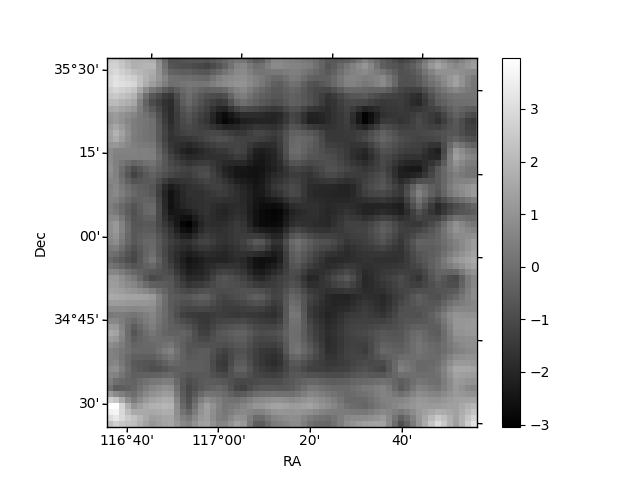
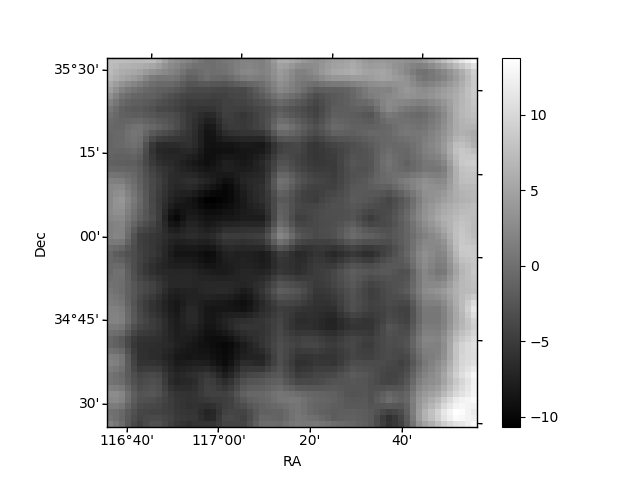
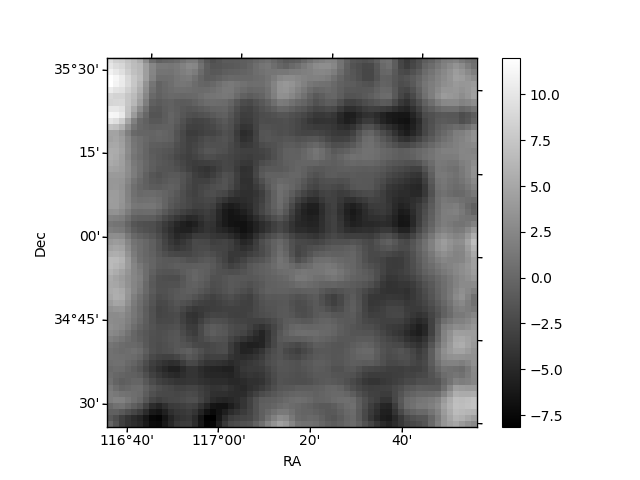
Histogram calculated using DETX and DETY for each event in the final _common_clean file
| Quadrant A | 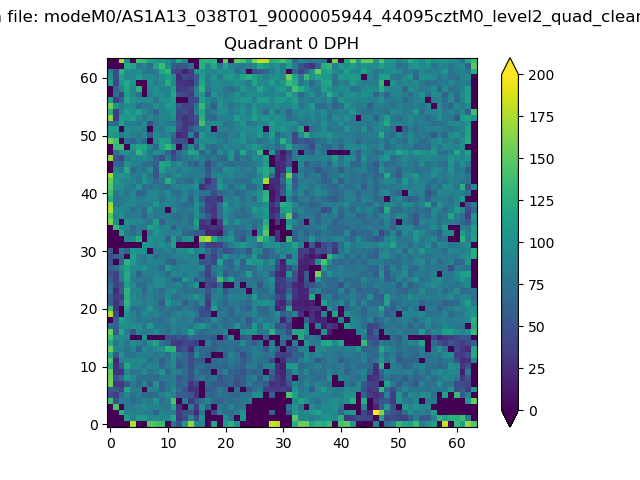 |
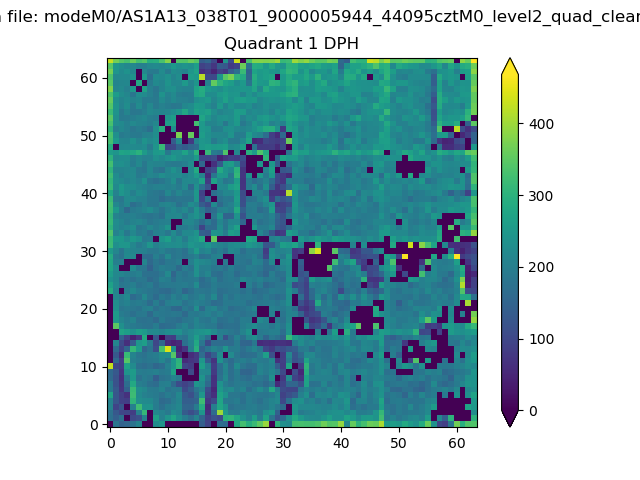 |
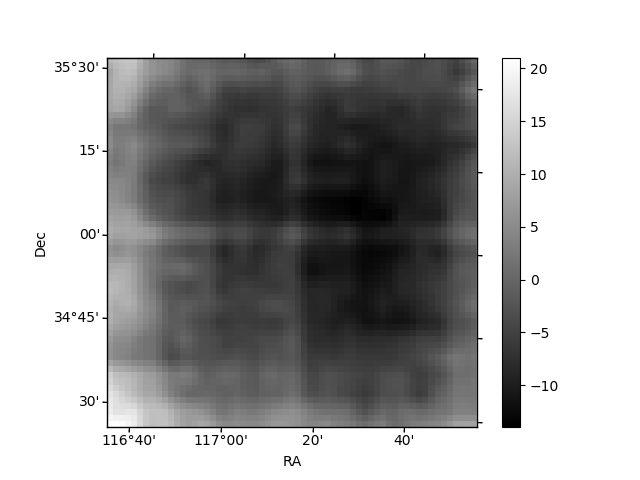
Quadrant B |
|---|---|---|---|
| Quadrant D | 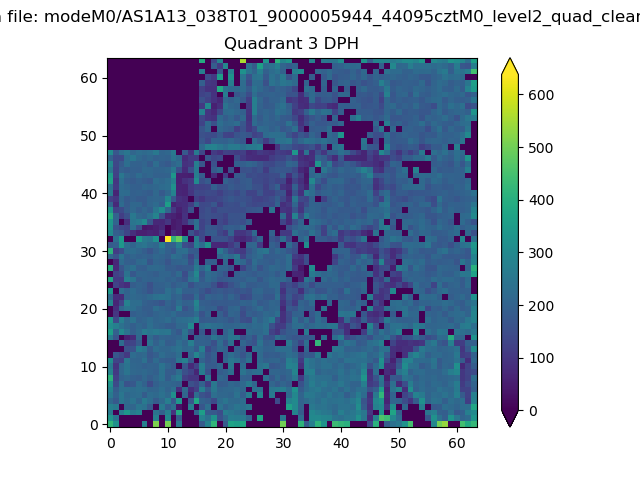 |
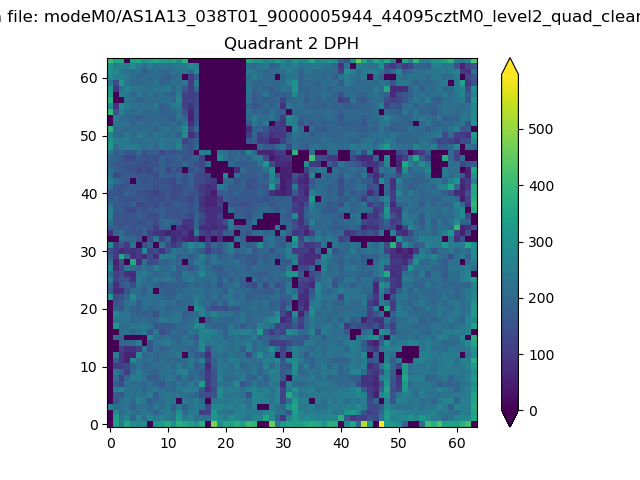 |
Quadrant C |
| Plot type | Count rate plots | Images |
|---|---|---|
| Comparison with Poisson distribution Blue bars denote a histogram of data divided into 1 sec bins. Red curve is a Poisson curve with rate = median count rate of data. |
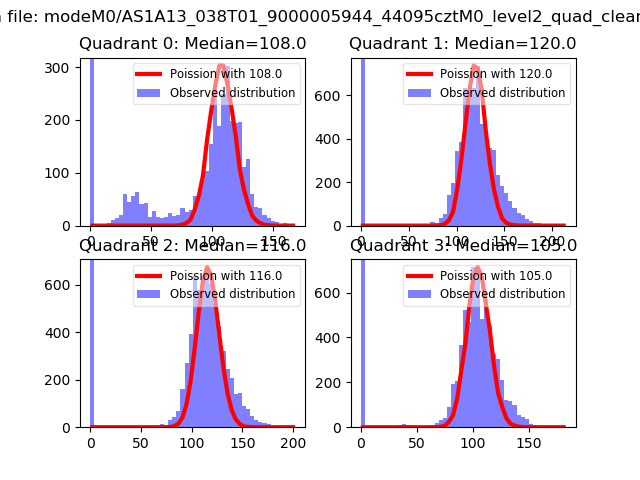 |
 |
| Quadrant-wise count rates Data is divided into 100 sec bins |
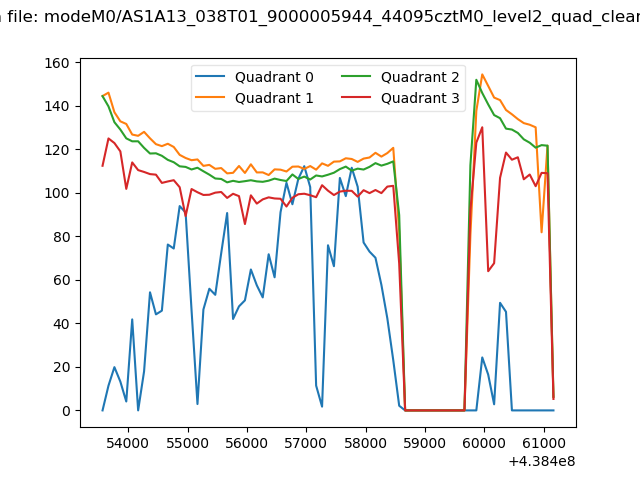 |
|
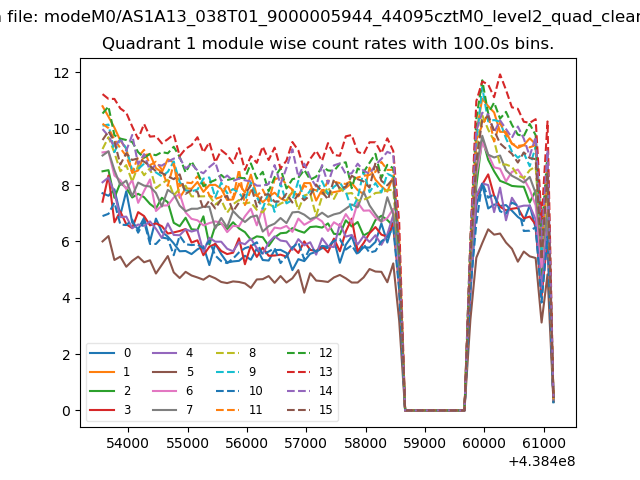
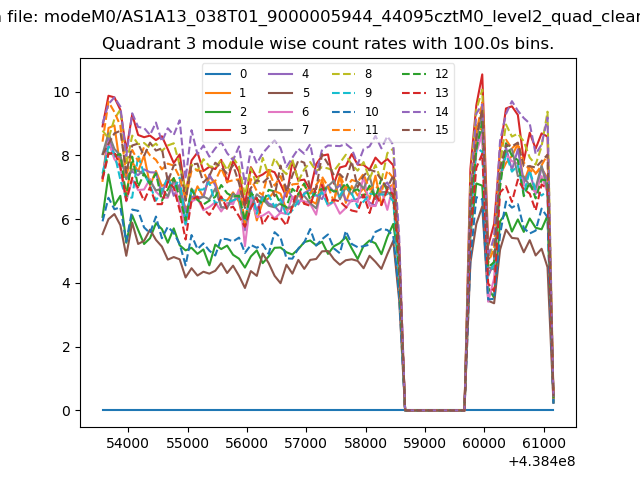
| Module-wise count rates for Quadrant A Data is divided into 100 sec bins |
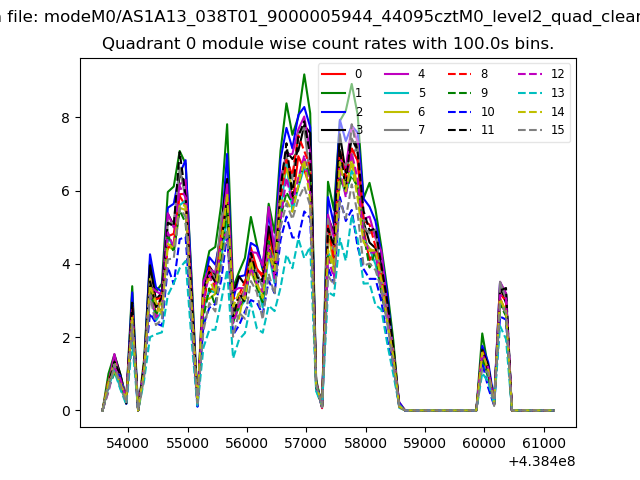 |
 |
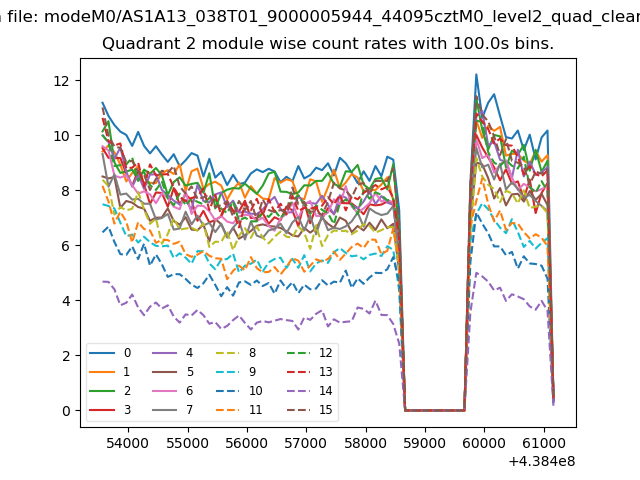
| Module-wise count rates for Quadrant B Data is divided into 100 sec bins |
 |
 |
| Module-wise count rates for Quadrant C Data is divided into 100 sec bins |
 |
 |
| Module-wise count rates for Quadrant D Data is divided into 100 sec bins |
 |
 |
| Parameter | Plot |
|---|---|
| CZT HV Monitor |  |
| D_VDD | 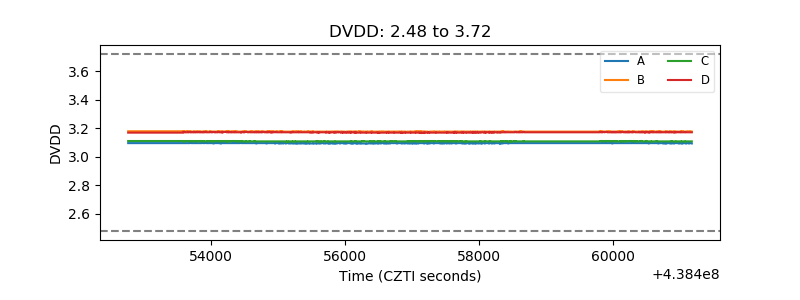 |
| Temperature 1 | 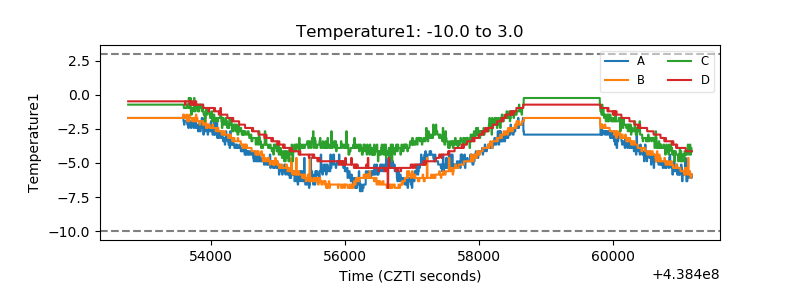 |
| Veto HV Monitor | 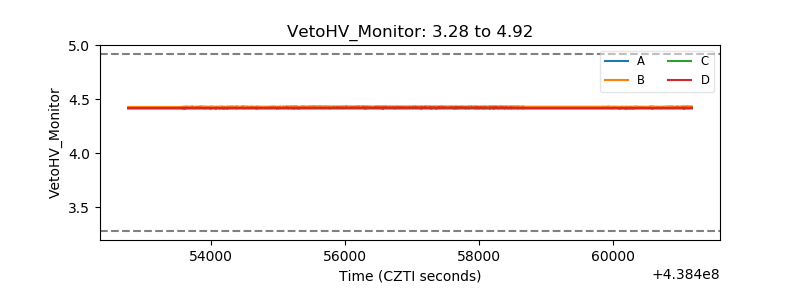 |
| Veto LLD | 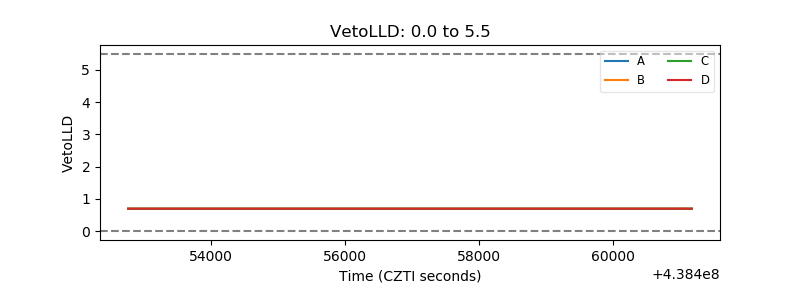 |
| Alpha Counter | 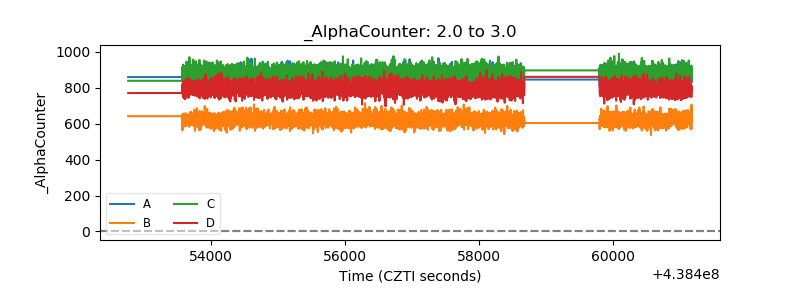 |
| _CPM_Rate | 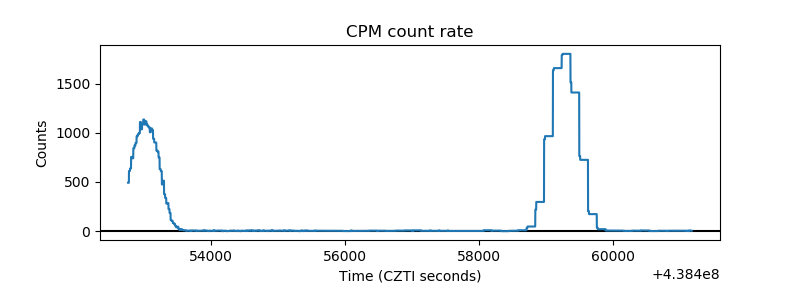 |
| CZT Counter | 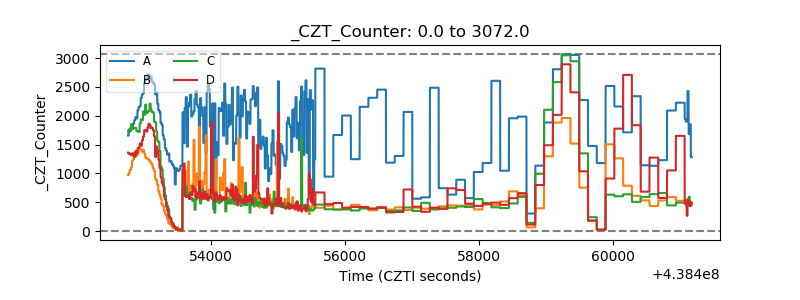 |
| +2.5 Volts monitor | 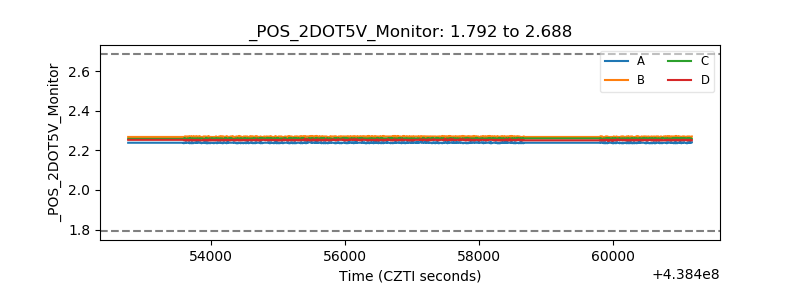 |
| +5 Volts monitor | 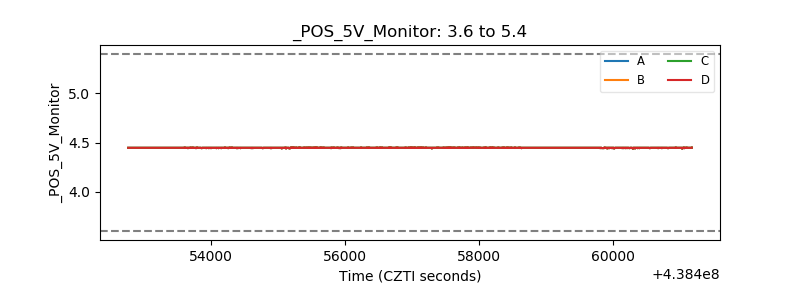 |
| _ROLL_ROT | 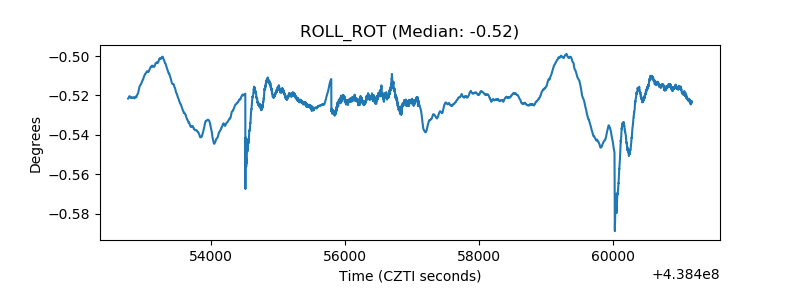 |
| _Roll_DEC | 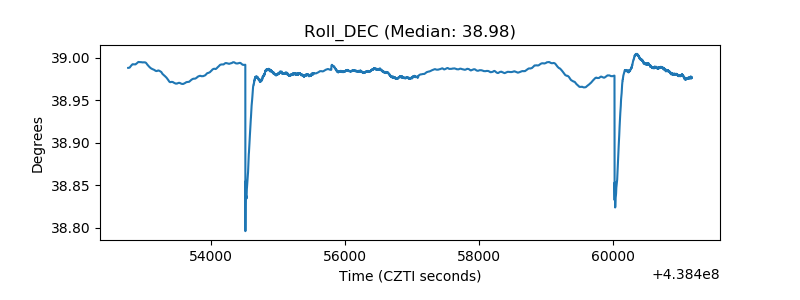 |
| _Roll_RA | 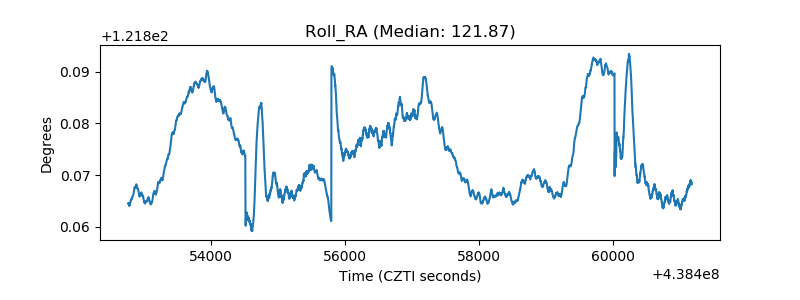 |
| Veto Counter | 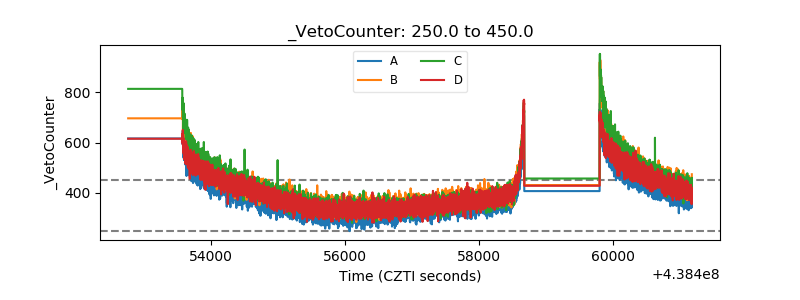 |