| Param | Original file | Final file |
|---|---|---|
| Filename | modeM0/AS1A13_038T01_9000005944_44096cztM0_level2.fits | modeM0/AS1A13_038T01_9000005944_44096cztM0_level2_quad_clean.evt |
| Size (bytes) | 682,511,040 | 85,199,040 |
| Size | 650.9 MB | 81.3 MB |
| Events in quadrant A | 13,713,080 | 60,365 |
| Events in quadrant B | 3,432,369 | 742,920 |
| Events in quadrant C | 2,950,293 | 725,219 |
| Events in quadrant D | 4,695,649 | 626,719 |
| Mode SS | |||
|---|---|---|---|
| Quadrant | BADHDUFLAG | Total packets | Discarded packets |
| A | 0 | 126 | 0 |
| B | 0 | 126 | 0 |
| C | 0 | 126 | 0 |
| D | 0 | 126 | 0 |
| Mode M9 | |||
|---|---|---|---|
| Quadrant | BADHDUFLAG | Total packets | Discarded packets |
| A | 0 | 12 | 0 |
| B | 0 | 12 | 0 |
| C | 0 | 12 | 0 |
| D | 0 | 12 | 0 |
| Mode M0 | |||
|---|---|---|---|
| Quadrant | BADHDUFLAG | Total packets | Discarded packets |
| A | 0 | 44881 | 6 |
| B | 0 | 14349 | 1 |
| C | 0 | 12923 | 1 |
| D | 0 | 18260 | 1 |
| Quadrant | Total seconds | Saturated seconds | Saturation percentage |
|---|---|---|---|
| A | 6071 | 5710 | 94.053698% |
| B | 6072 | 164 | 2.700922% |
| C | 6072 | 36 | 0.592885% |
| D | 6072 | 379 | 6.241765% |
Noise dominated data is calculated using 1-second bins in cleaned event files. If a bin has >2000 counts, and if more than 50% of those come from <1% of pixels, then it is considered to be noise-dominated and hence unusable.
| Quadrant | # 1 sec bins | Bins with >0 counts | Bins with >2000 counts | High rate bins dominated by noise | Noise dominated (total time) | Noise dominated (detector-on time) | Marked lightcurve |
|---|---|---|---|---|---|---|---|
| A | 7306 | 6070 | 4228 | 4228 | 57.87% | 69.65% | 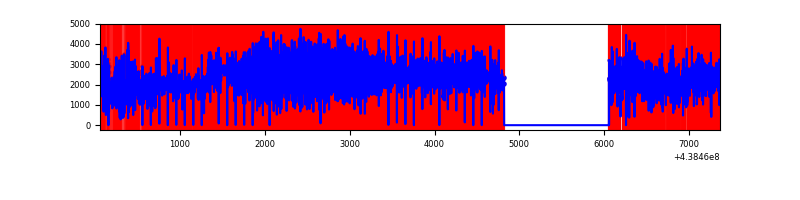 |
| B | 7307 | 6073 | 56 | 56 | 0.77% | 0.92% |  |
| C | 7306 | 6072 | 6 | 6 | 0.08% | 0.10% | 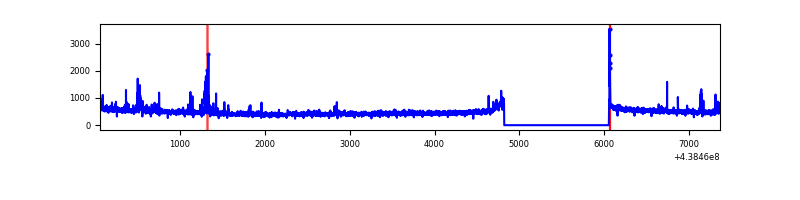 |
| D | 7306 | 6072 | 249 | 249 | 3.41% | 4.10% | 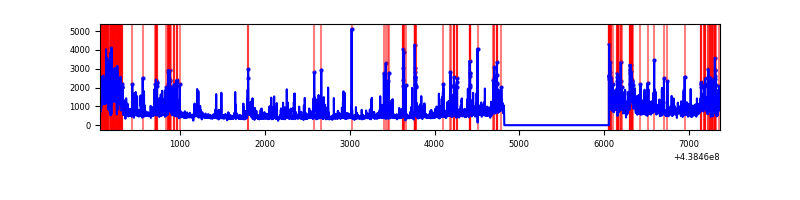 |
Top three noisy pixels from each quadrant. If the there are fewer than three noisy pixels in the level2.evt file, extra rows are filled as -1
| Pixel properties | Quadrant properties | ||||||
|---|---|---|---|---|---|---|---|
| Quadrant | DetID | PixID | Counts | Sigma | Mean | Median | Sigma |
| A | 15 | 223 | 11950634 | 193347.09 | 296 | 291 | 61.8 |
| A | 10 | 83 | 516456 | 8351.14 | 296 | 291 | 61.8 |
| A | 15 | 222 | 75554 | 1217.7 | 296 | 291 | 61.8 |
| B | 4 | 171 | 173668 | 1242.32 | 718 | 696 | 139.2 |
| B | 0 | 200 | 111739 | 797.53 | 718 | 696 | 139.2 |
| B | 15 | 36 | 108588 | 774.9 | 718 | 696 | 139.2 |
| C | 14 | 96 | 85537 | 504.11 | 716 | 722 | 168.2 |
| C | 3 | 233 | 33164 | 192.82 | 716 | 722 | 168.2 |
| C | 14 | 254 | 29973 | 173.86 | 716 | 722 | 168.2 |
| D | 1 | 52 | 455686 | 2586.9 | 694 | 673 | 175.9 |
| D | 12 | 222 | 323231 | 1833.85 | 694 | 673 | 175.9 |
| D | 13 | 249 | 195254 | 1106.26 | 694 | 673 | 175.9 |
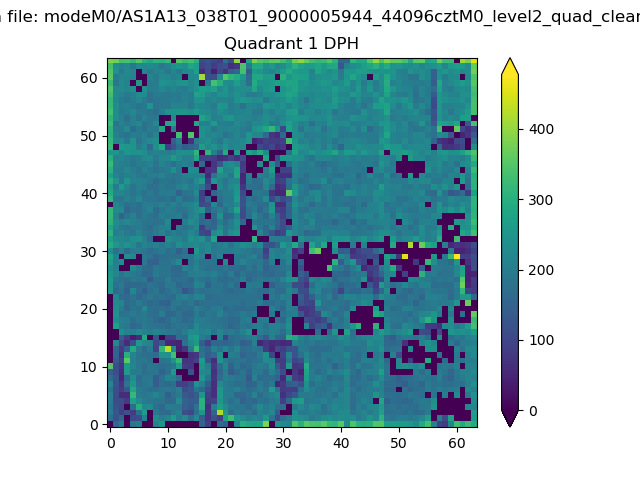
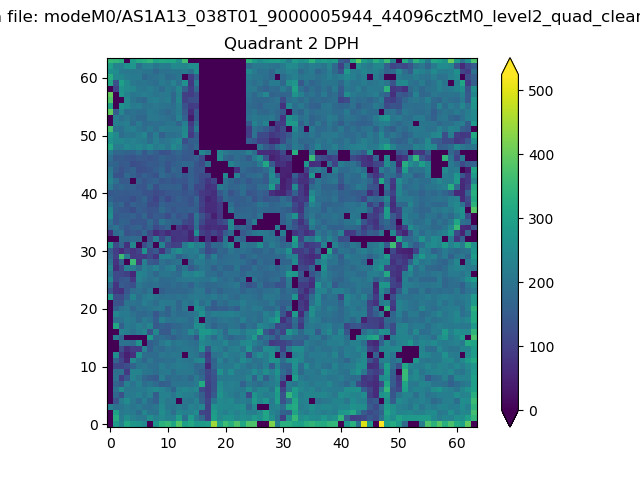
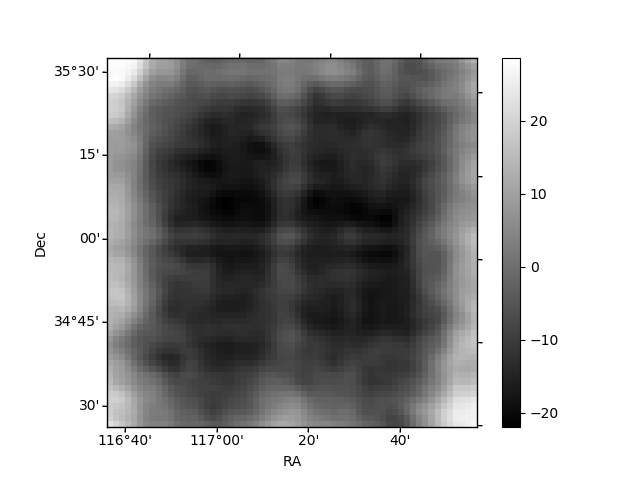
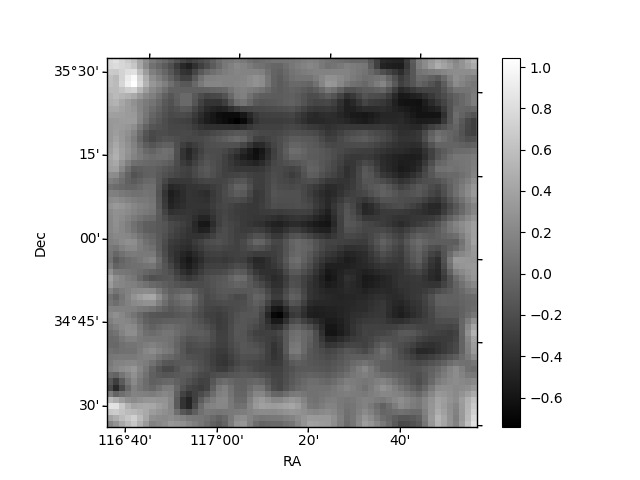
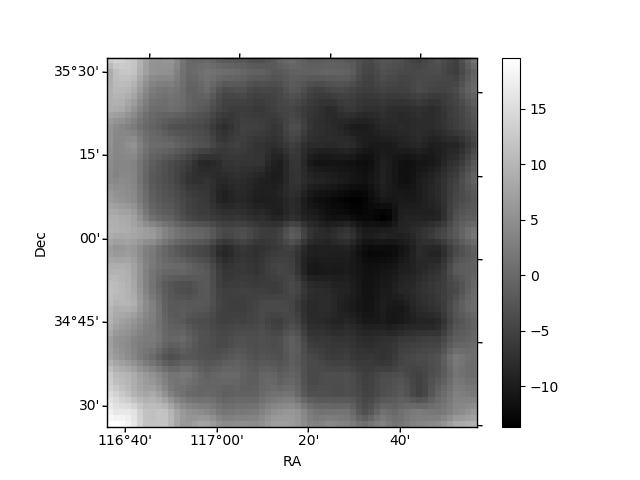
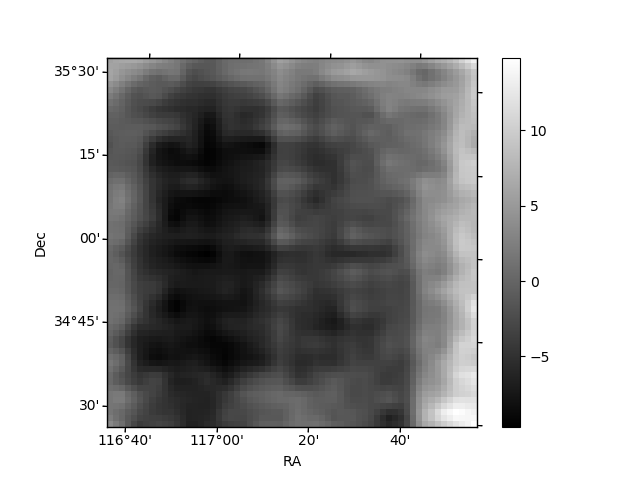
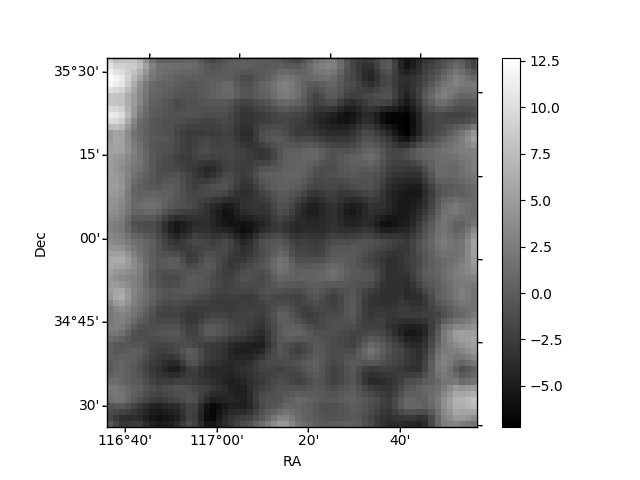
Histogram calculated using DETX and DETY for each event in the final _common_clean file
| Quadrant A | 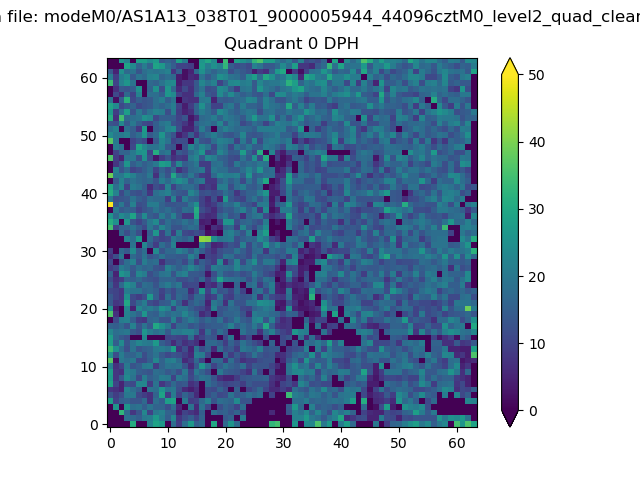 |
 |
Quadrant B |
|---|---|---|---|
| Quadrant D | 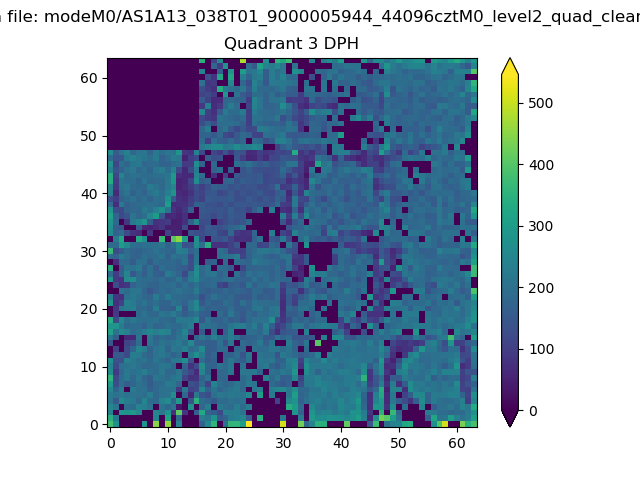 |
 |
Quadrant C |
| Plot type | Count rate plots | Images |
|---|---|---|
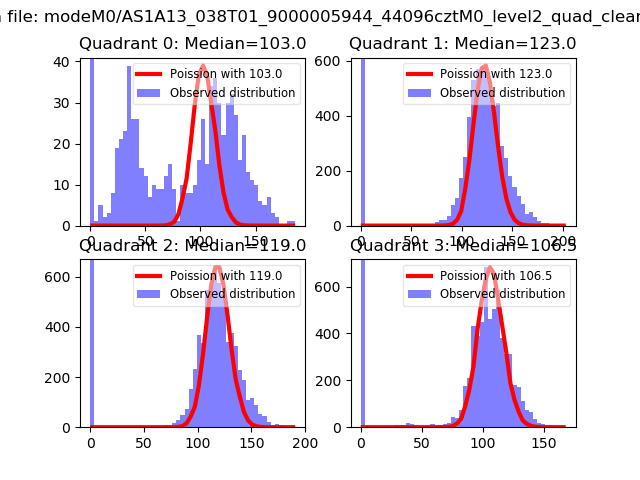
| Comparison with Poisson distribution Blue bars denote a histogram of data divided into 1 sec bins. Red curve is a Poisson curve with rate = median count rate of data. |
 |
 |
| Quadrant-wise count rates Data is divided into 100 sec bins |
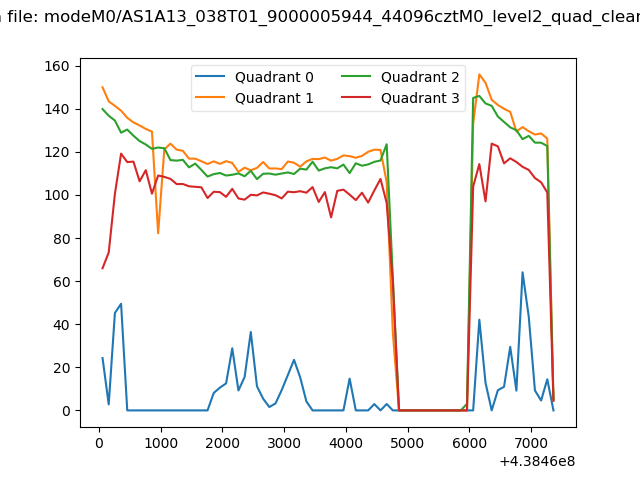 |
|
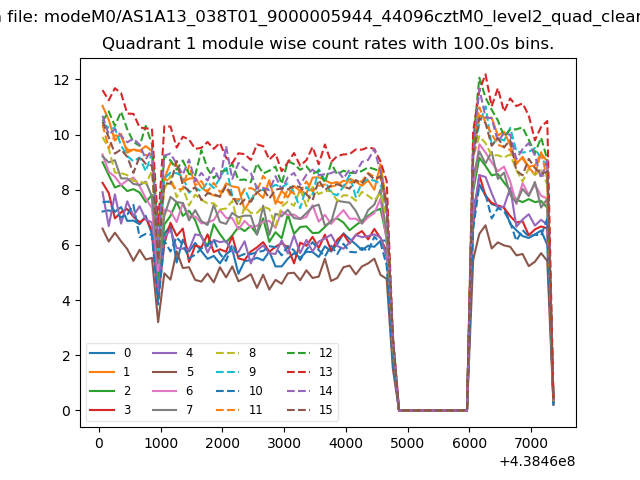
| Module-wise count rates for Quadrant A Data is divided into 100 sec bins |
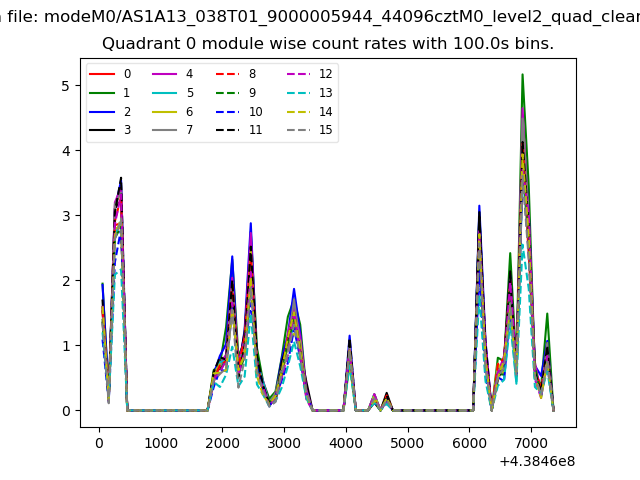 |
 |
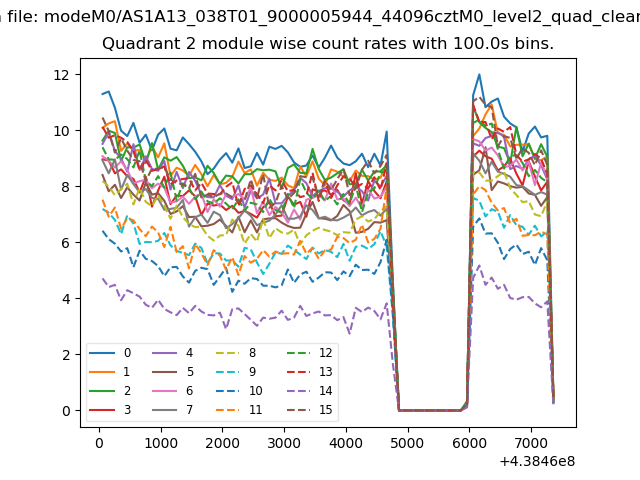
| Module-wise count rates for Quadrant B Data is divided into 100 sec bins |
 |
 |
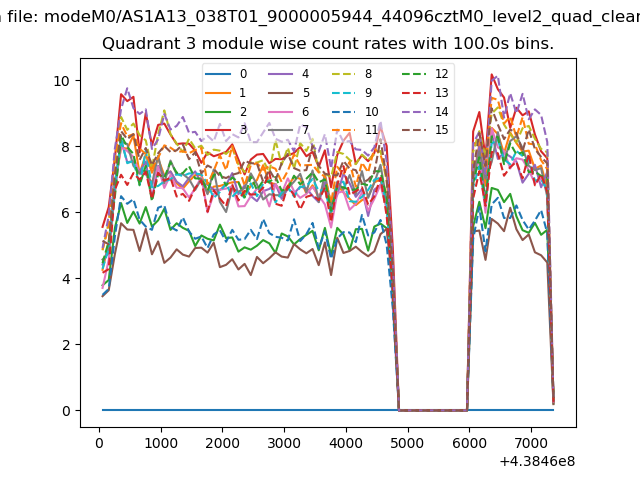
| Module-wise count rates for Quadrant C Data is divided into 100 sec bins |
 |
 |
| Module-wise count rates for Quadrant D Data is divided into 100 sec bins |
 |
 |
| Parameter | Plot |
|---|---|
| CZT HV Monitor | 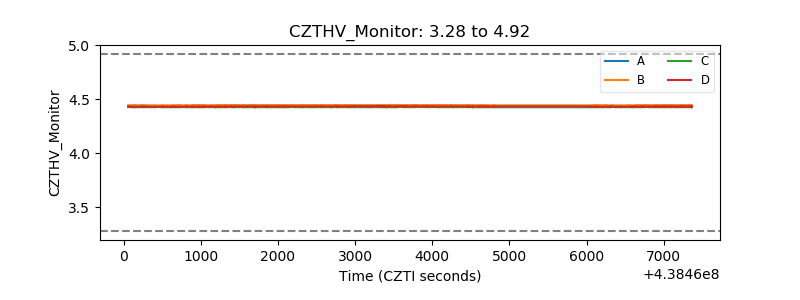 |
| D_VDD | 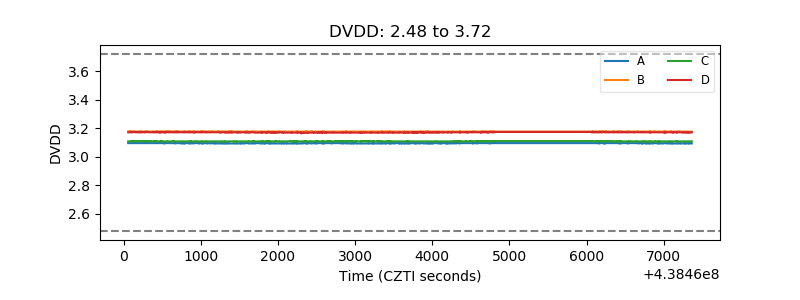 |
| Temperature 1 | 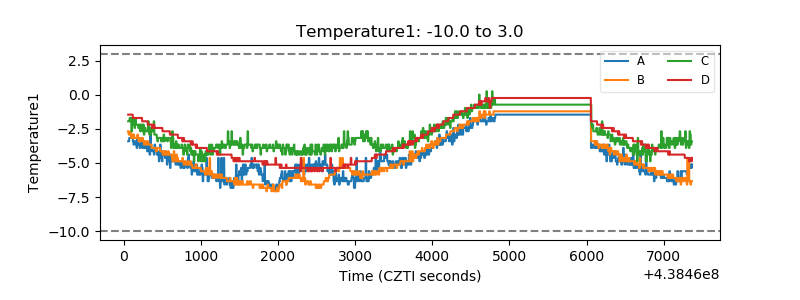 |
| Veto HV Monitor |  |
| Veto LLD | 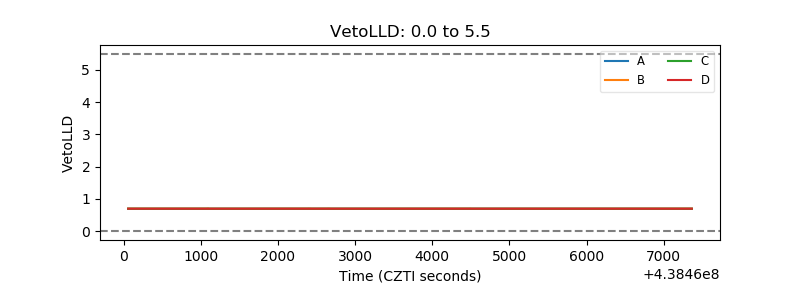 |
| Alpha Counter | 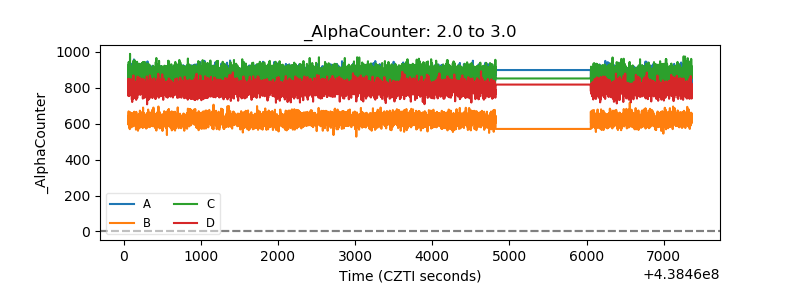 |
| _CPM_Rate | 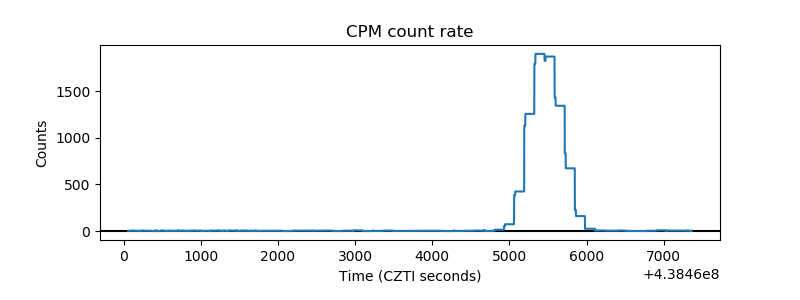 |
| CZT Counter |  |
| +2.5 Volts monitor | 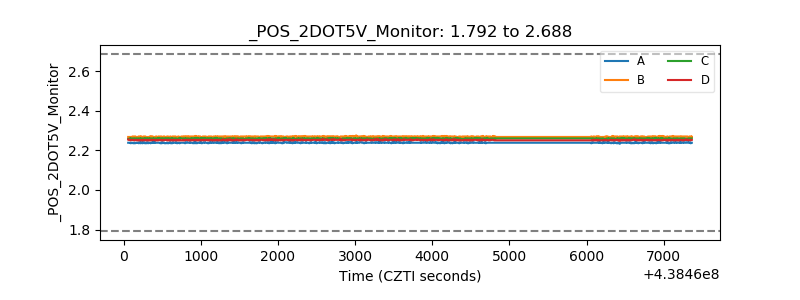 |
| +5 Volts monitor | 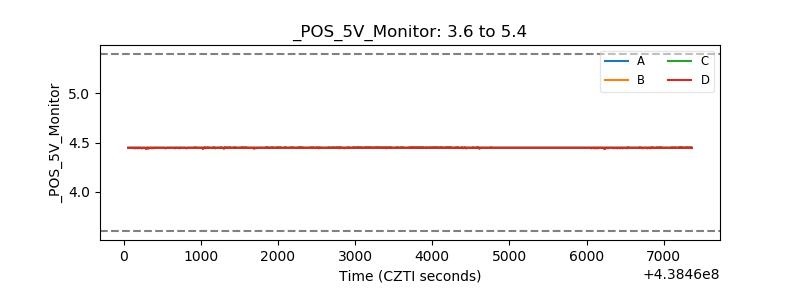 |
| _ROLL_ROT | 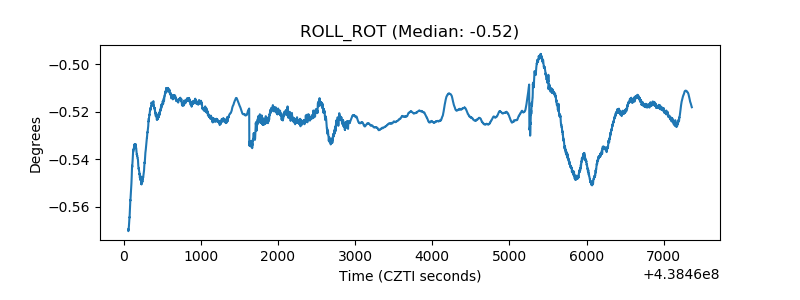 |
| _Roll_DEC | 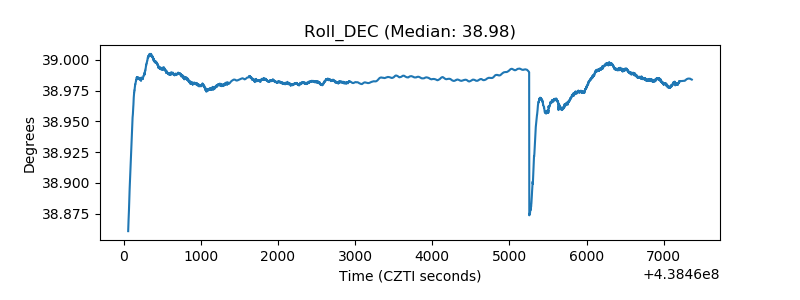 |
| _Roll_RA | 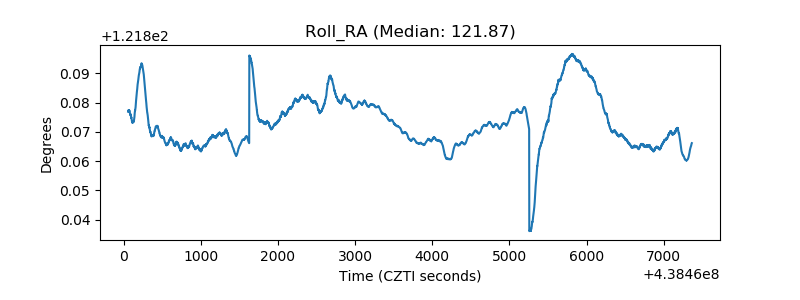 |
| Veto Counter | 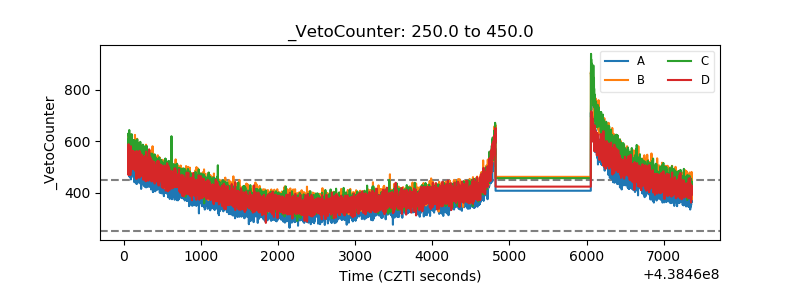 |