| Param | Original file | Final file |
|---|---|---|
| Filename | modeM0/AS1A13_038T01_9000005944_44097cztM0_level2.fits | modeM0/AS1A13_038T01_9000005944_44097cztM0_level2_quad_clean.evt |
| Size (bytes) | 716,855,040 | 85,259,520 |
| Size | 683.6 MB | 81.3 MB |
| Events in quadrant A | 12,353,952 | 90,255 |
| Events in quadrant B | 3,514,714 | 739,029 |
| Events in quadrant C | 2,932,369 | 725,841 |
| Events in quadrant D | 7,262,478 | 602,716 |
| Mode SS | |||
|---|---|---|---|
| Quadrant | BADHDUFLAG | Total packets | Discarded packets |
| A | 0 | 122 | 0 |
| B | 0 | 122 | 0 |
| C | 0 | 122 | 0 |
| D | 0 | 122 | 0 |
| Mode M9 | |||
|---|---|---|---|
| Quadrant | BADHDUFLAG | Total packets | Discarded packets |
| A | 0 | 13 | 0 |
| B | 0 | 13 | 0 |
| C | 0 | 13 | 0 |
| D | 0 | 13 | 0 |
| Mode M0 | |||
|---|---|---|---|
| Quadrant | BADHDUFLAG | Total packets | Discarded packets |
| A | 0 | 40885 | 6 |
| B | 0 | 14553 | 1 |
| C | 0 | 12840 | 1 |
| D | 0 | 25913 | 1 |
| Quadrant | Total seconds | Saturated seconds | Saturation percentage |
|---|---|---|---|
| A | 6072 | 5452 | 89.789196% |
| B | 6073 | 231 | 3.803721% |
| C | 6073 | 40 | 0.658653% |
| D | 6073 | 651 | 10.719578% |
Noise dominated data is calculated using 1-second bins in cleaned event files. If a bin has >2000 counts, and if more than 50% of those come from <1% of pixels, then it is considered to be noise-dominated and hence unusable.
| Quadrant | # 1 sec bins | Bins with >0 counts | Bins with >2000 counts | High rate bins dominated by noise | Noise dominated (total time) | Noise dominated (detector-on time) | Marked lightcurve |
|---|---|---|---|---|---|---|---|
| A | 7347 | 6068 | 3199 | 3199 | 43.54% | 52.72% | 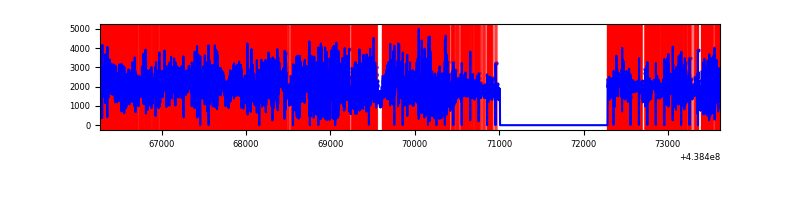 |
| B | 7348 | 6074 | 83 | 83 | 1.13% | 1.37% | 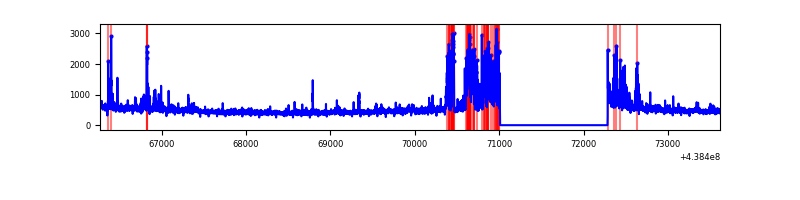 |
| C | 7348 | 6074 | 20 | 20 | 0.27% | 0.33% | 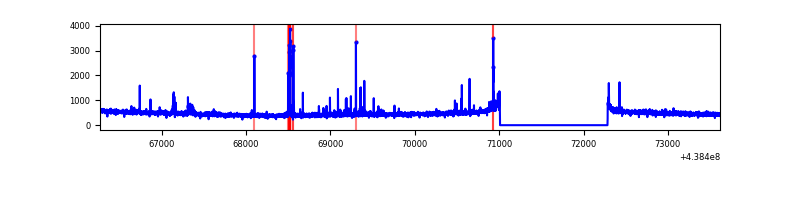 |
| D | 7348 | 6074 | 675 | 675 | 9.19% | 11.11% | 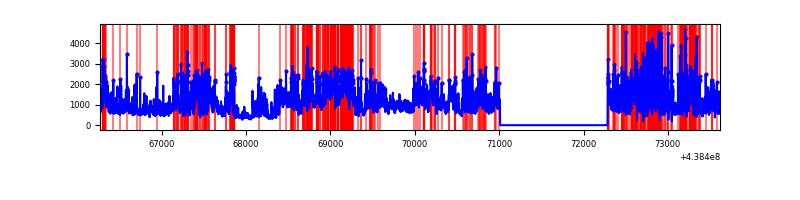 |
Top three noisy pixels from each quadrant. If the there are fewer than three noisy pixels in the level2.evt file, extra rows are filled as -1
| Pixel properties | Quadrant properties | ||||||
|---|---|---|---|---|---|---|---|
| Quadrant | DetID | PixID | Counts | Sigma | Mean | Median | Sigma |
| A | 15 | 223 | 10503373 | 172553.5 | 289 | 284 | 60.9 |
| A | 10 | 83 | 474649 | 7793.26 | 289 | 284 | 60.9 |
| A | 15 | 222 | 219225 | 3596.95 | 289 | 284 | 60.9 |
| B | 4 | 171 | 217425 | 1581.69 | 712 | 692 | 137.0 |
| B | 15 | 36 | 200333 | 1456.95 | 712 | 692 | 137.0 |
| B | 5 | 172 | 116531 | 845.38 | 712 | 692 | 137.0 |
| C | 14 | 254 | 104477 | 626.01 | 707 | 712 | 165.8 |
| C | 14 | 96 | 51179 | 304.46 | 707 | 712 | 165.8 |
| C | 3 | 233 | 11193 | 63.23 | 707 | 712 | 165.8 |
| D | 1 | 52 | 3333525 | 19208.05 | 674 | 651 | 173.5 |
| D | 5 | 222 | 726588 | 4183.73 | 674 | 651 | 173.5 |
| D | 5 | 235 | 123229 | 706.44 | 674 | 651 | 173.5 |
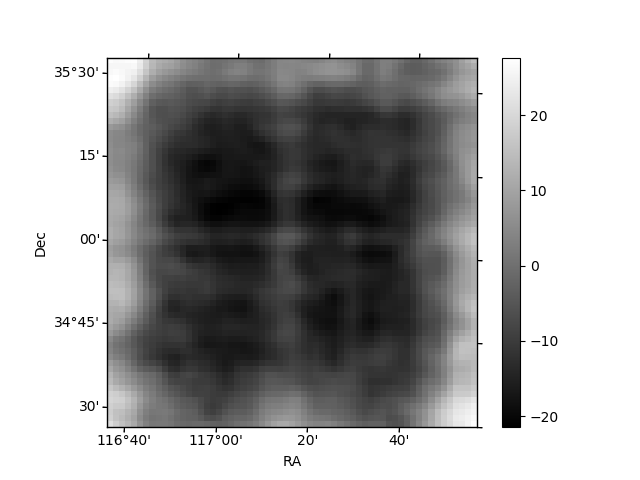
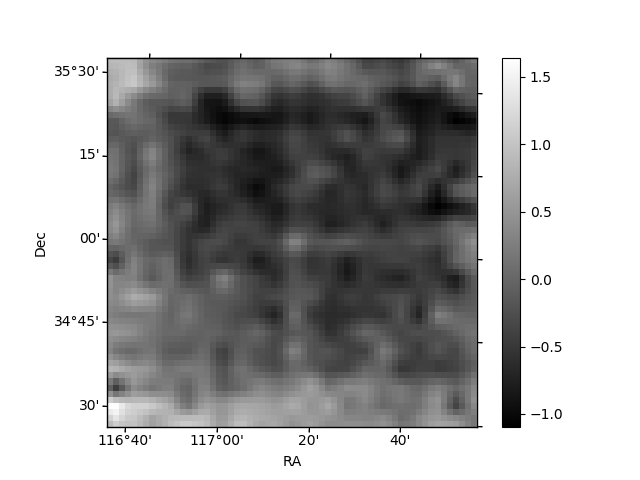
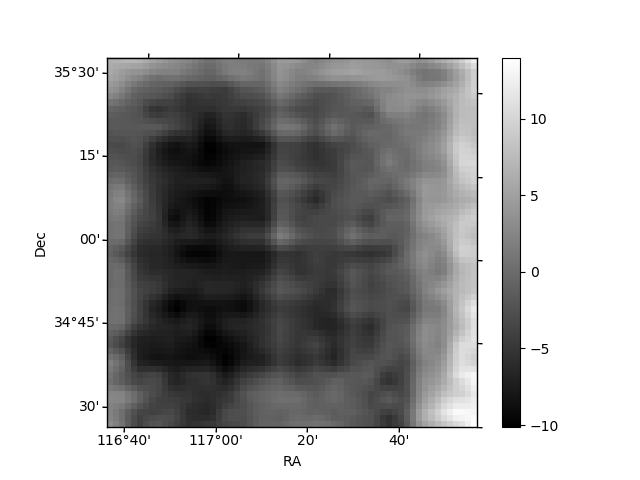
Histogram calculated using DETX and DETY for each event in the final _common_clean file
| Quadrant A | 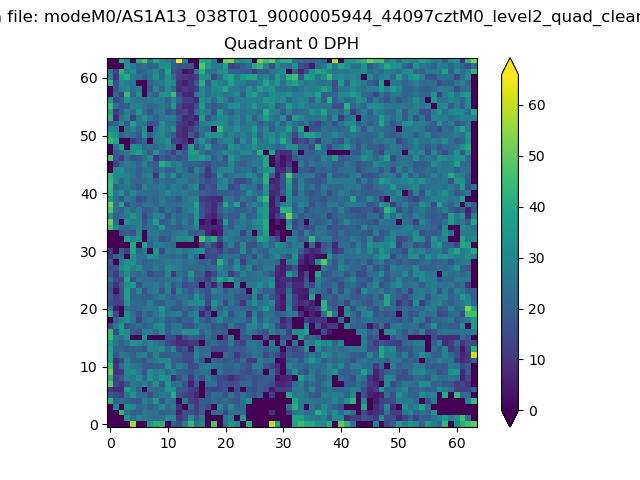 |
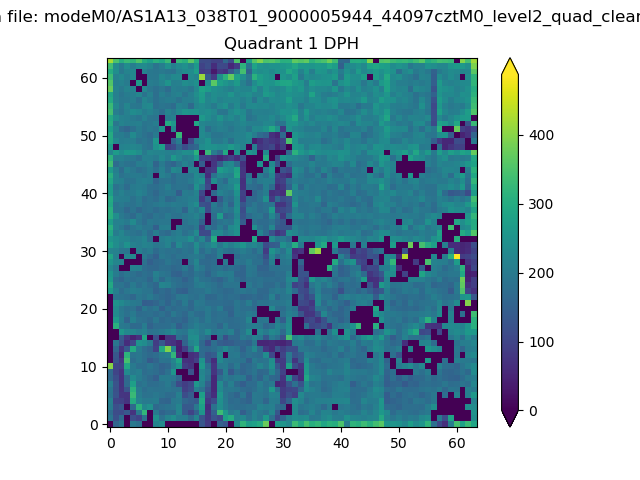 |
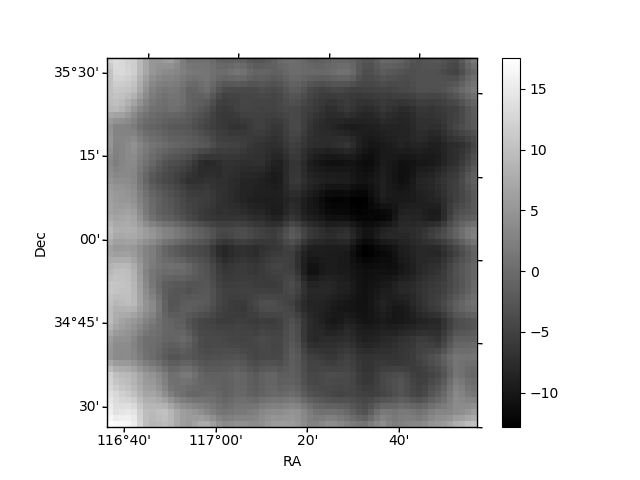
Quadrant B |
|---|---|---|---|
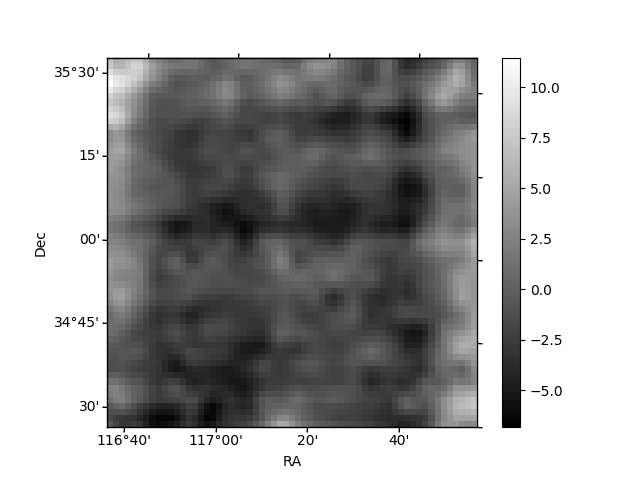
| Quadrant D | 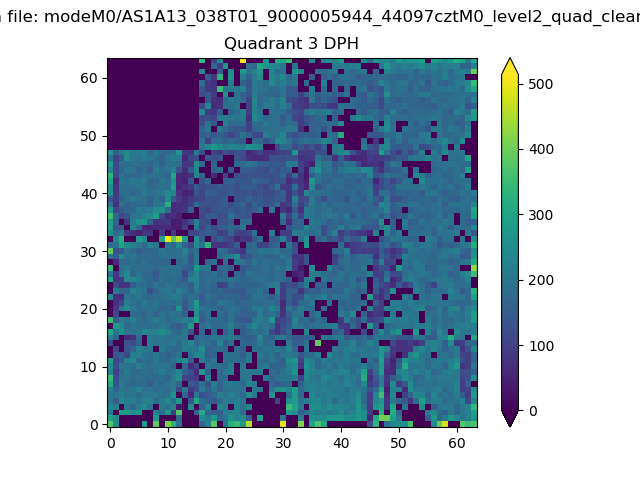 |
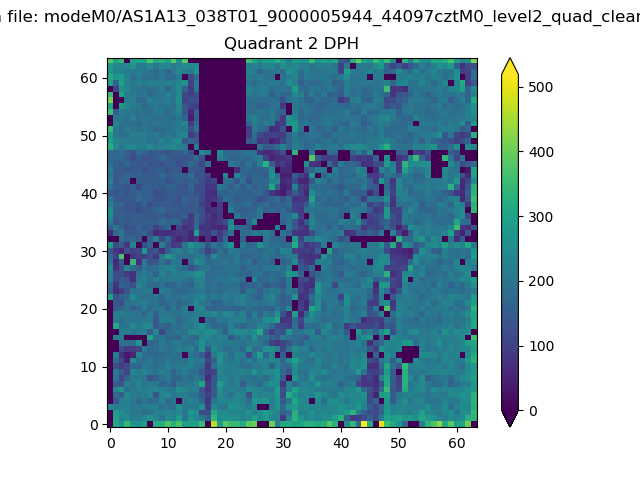 |
Quadrant C |
| Plot type | Count rate plots | Images |
|---|---|---|
| Comparison with Poisson distribution Blue bars denote a histogram of data divided into 1 sec bins. Red curve is a Poisson curve with rate = median count rate of data. |
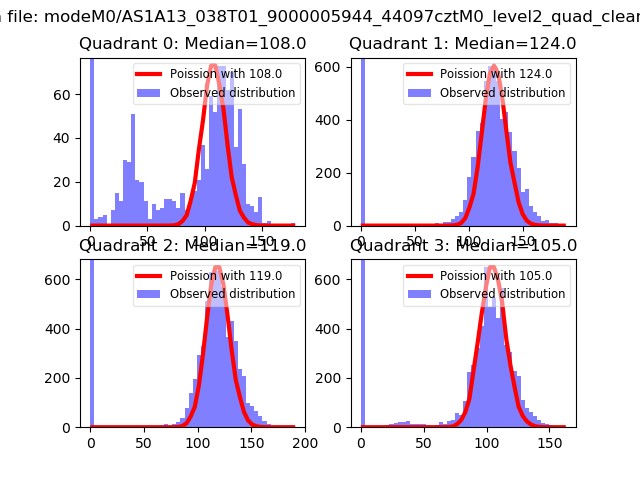 |
 |
| Quadrant-wise count rates Data is divided into 100 sec bins |
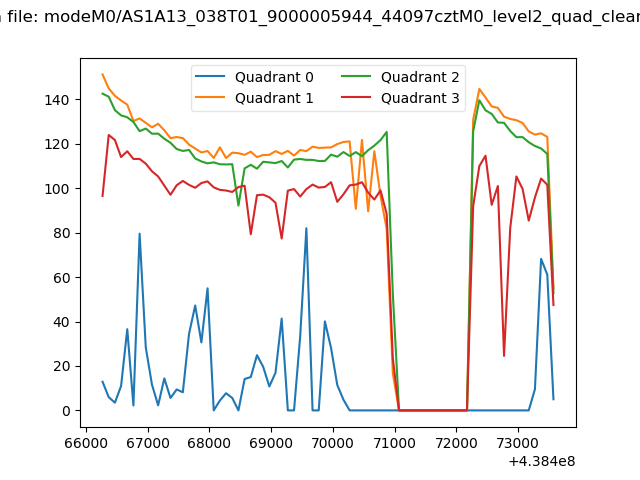 |
|
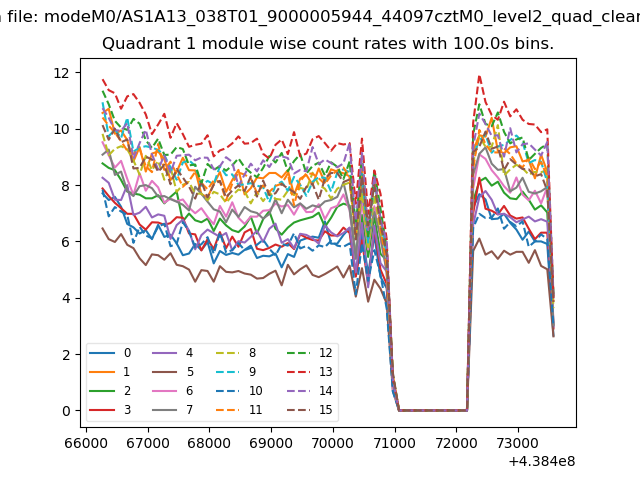
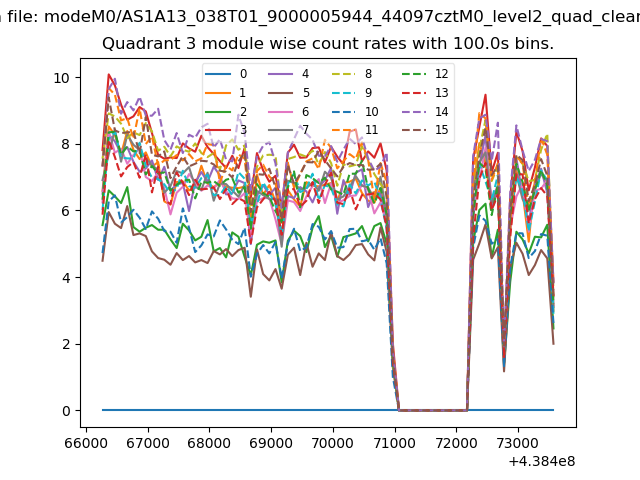
| Module-wise count rates for Quadrant A Data is divided into 100 sec bins |
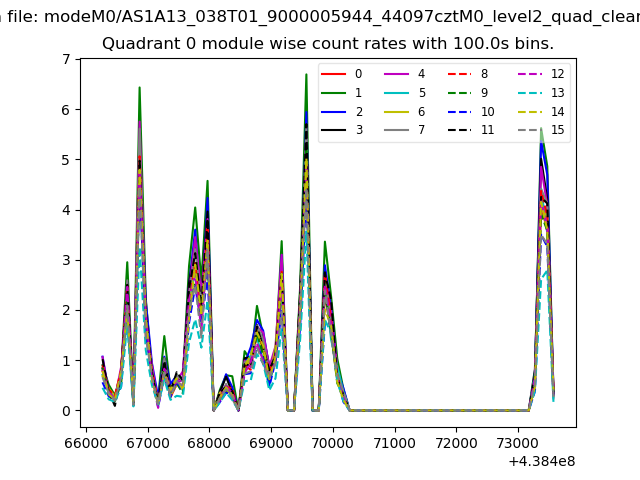 |
 |
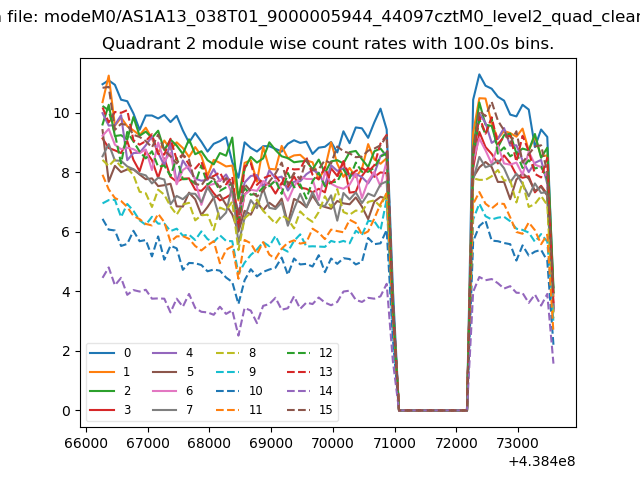
| Module-wise count rates for Quadrant B Data is divided into 100 sec bins |
 |
 |
| Module-wise count rates for Quadrant C Data is divided into 100 sec bins |
 |
 |
| Module-wise count rates for Quadrant D Data is divided into 100 sec bins |
 |
 |
| Parameter | Plot |
|---|---|
| CZT HV Monitor |  |
| D_VDD | 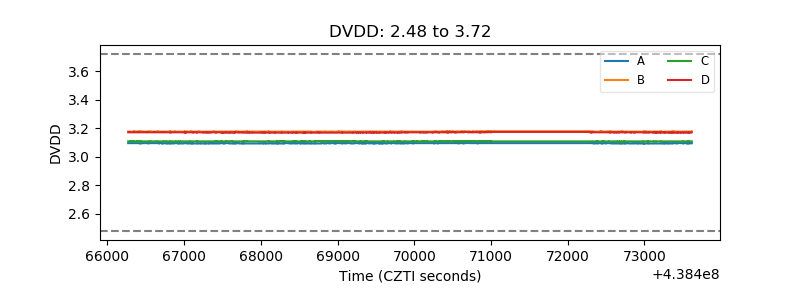 |
| Temperature 1 | 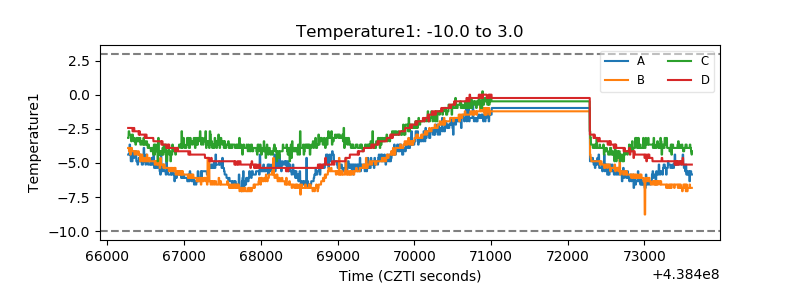 |
| Veto HV Monitor | 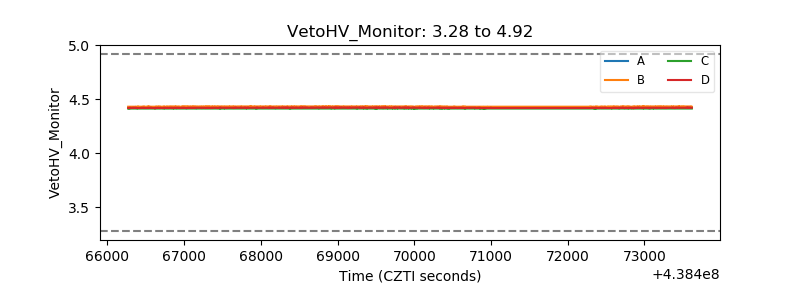 |
| Veto LLD | 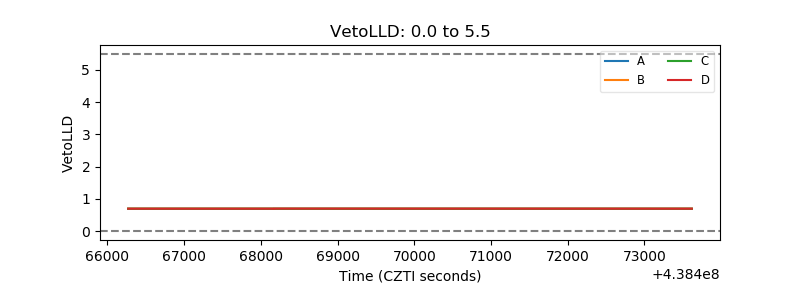 |
| Alpha Counter | 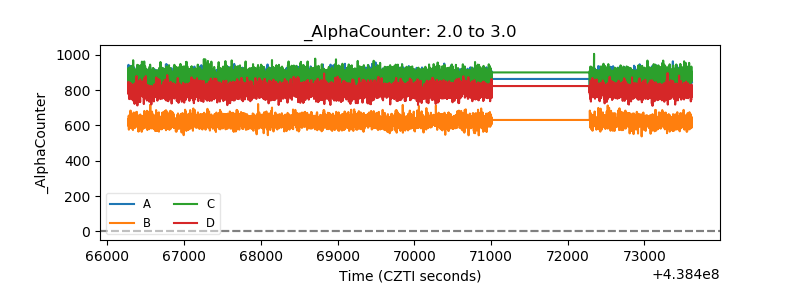 |
| _CPM_Rate | 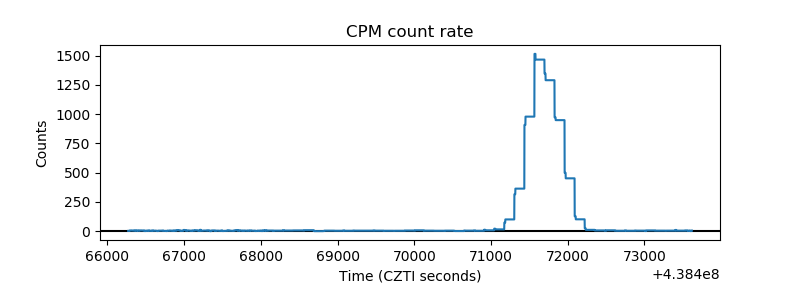 |
| CZT Counter |  |
| +2.5 Volts monitor | 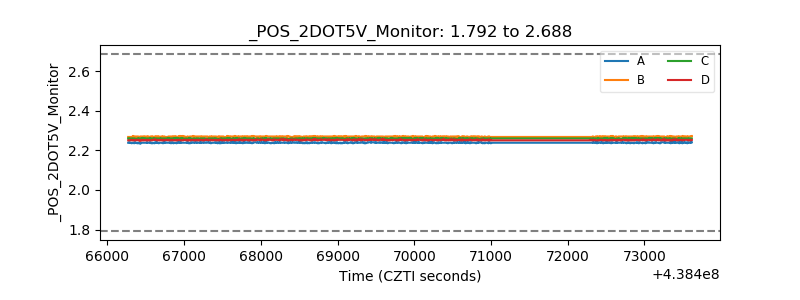 |
| +5 Volts monitor | 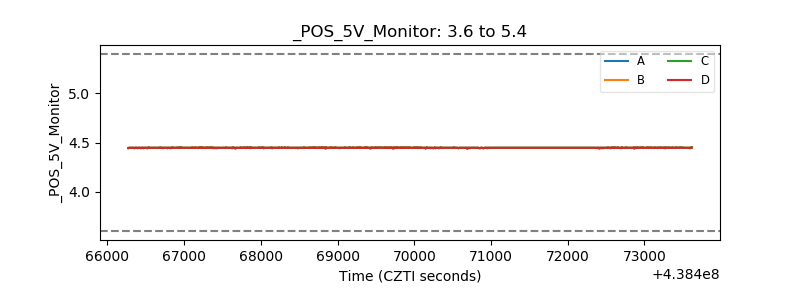 |
| _ROLL_ROT | 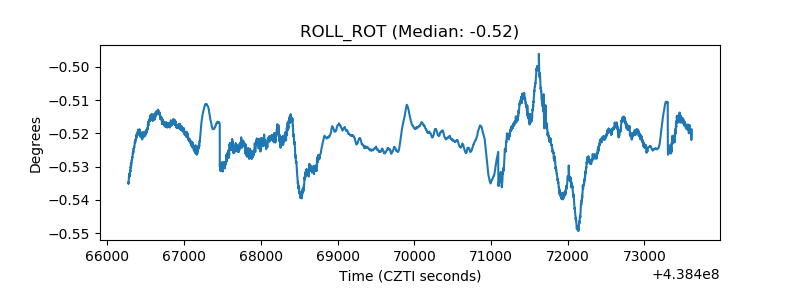 |
| _Roll_DEC | 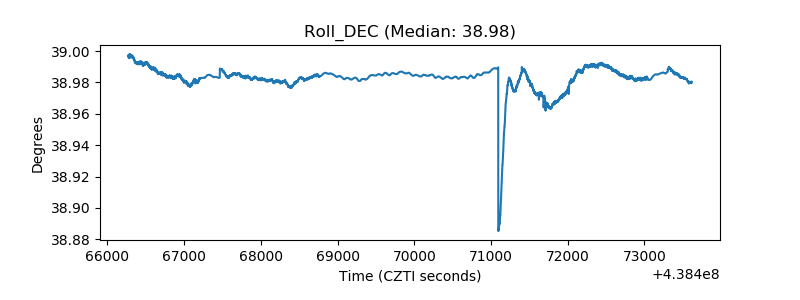 |
| _Roll_RA | 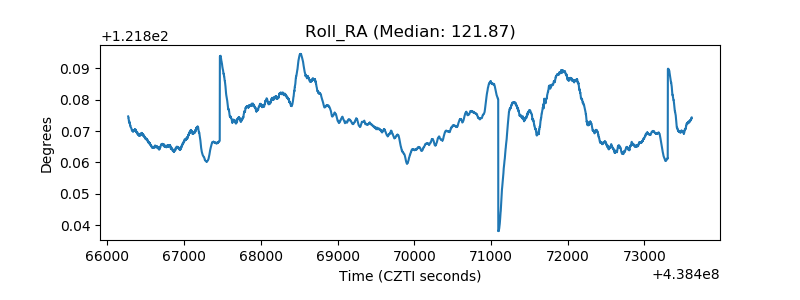 |
| Veto Counter | 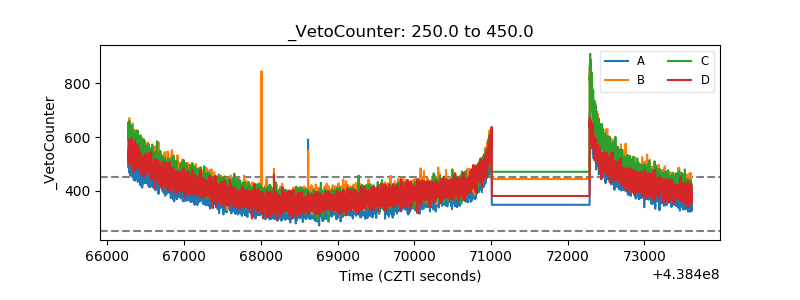 |