| Param | Original file | Final file |
|---|---|---|
| Filename | modeM0/AS1A13_038T01_9000005944_44098cztM0_level2.fits | modeM0/AS1A13_038T01_9000005944_44098cztM0_level2_quad_clean.evt |
| Size (bytes) | 721,460,160 | 85,740,480 |
| Size | 688.0 MB | 81.8 MB |
| Events in quadrant A | 13,094,505 | 23,166 |
| Events in quadrant B | 3,580,798 | 773,293 |
| Events in quadrant C | 3,041,301 | 747,243 |
| Events in quadrant D | 6,488,571 | 604,016 |
| Mode SS | |||
|---|---|---|---|
| Quadrant | BADHDUFLAG | Total packets | Discarded packets |
| A | 0 | 130 | 0 |
| B | 0 | 130 | 0 |
| C | 0 | 130 | 0 |
| D | 0 | 130 | 0 |
| Mode M9 | |||
|---|---|---|---|
| Quadrant | BADHDUFLAG | Total packets | Discarded packets |
| A | 0 | 20 | 0 |
| B | 0 | 21 | 0 |
| C | 0 | 21 | 0 |
| D | 0 | 21 | 0 |
| Mode M0 | |||
|---|---|---|---|
| Quadrant | BADHDUFLAG | Total packets | Discarded packets |
| A | 0 | 43348 | 5 |
| B | 0 | 15087 | 2 |
| C | 0 | 13588 | 2 |
| D | 0 | 23814 | 2 |
| Quadrant | Total seconds | Saturated seconds | Saturation percentage |
|---|---|---|---|
| A | 6427 | 6268 | 97.526062% |
| B | 6427 | 201 | 3.127431% |
| C | 6427 | 38 | 0.591256% |
| D | 6427 | 868 | 13.505524% |
Noise dominated data is calculated using 1-second bins in cleaned event files. If a bin has >2000 counts, and if more than 50% of those come from <1% of pixels, then it is considered to be noise-dominated and hence unusable.
| Quadrant | # 1 sec bins | Bins with >0 counts | Bins with >2000 counts | High rate bins dominated by noise | Noise dominated (total time) | Noise dominated (detector-on time) | Marked lightcurve |
|---|---|---|---|---|---|---|---|
| A | 7602 | 6425 | 3383 | 3383 | 44.50% | 52.65% | 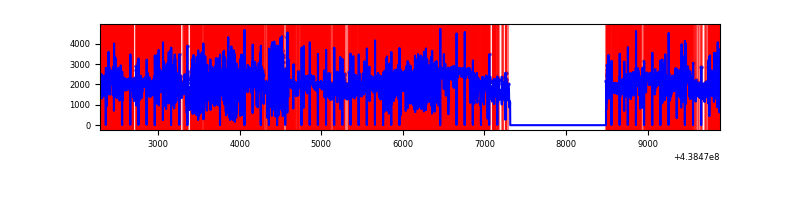 |
| B | 7602 | 6428 | 59 | 59 | 0.78% | 0.92% | 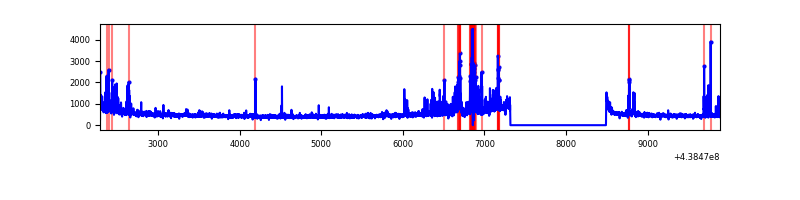 |
| C | 7602 | 6428 | 7 | 7 | 0.09% | 0.11% | 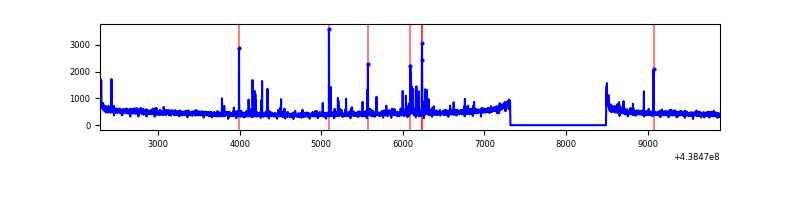 |
| D | 7602 | 6428 | 689 | 689 | 9.06% | 10.72% | 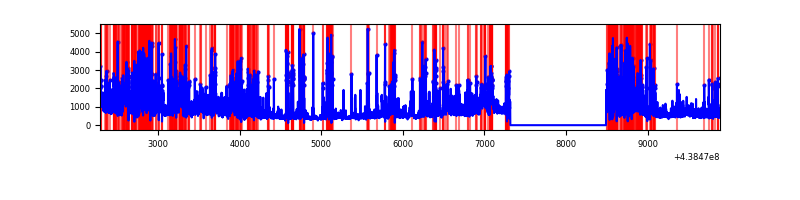 |
Top three noisy pixels from each quadrant. If the there are fewer than three noisy pixels in the level2.evt file, extra rows are filled as -1
| Pixel properties | Quadrant properties | ||||||
|---|---|---|---|---|---|---|---|
| Quadrant | DetID | PixID | Counts | Sigma | Mean | Median | Sigma |
| A | 15 | 223 | 12154509 | 354749.96 | 158 | 155 | 34.3 |
| A | 10 | 83 | 299871 | 8747.83 | 158 | 155 | 34.3 |
| A | 15 | 222 | 11400 | 328.21 | 158 | 155 | 34.3 |
| B | 4 | 171 | 417162 | 2849.8 | 748 | 725 | 146.1 |
| B | 15 | 36 | 63302 | 428.23 | 748 | 725 | 146.1 |
| B | 0 | 245 | 26934 | 179.36 | 748 | 725 | 146.1 |
| C | 14 | 96 | 76095 | 427.56 | 741 | 748 | 176.2 |
| C | 14 | 254 | 72319 | 406.13 | 741 | 748 | 176.2 |
| C | 3 | 233 | 5392 | 26.35 | 741 | 748 | 176.2 |
| D | 1 | 52 | 1966319 | 11375.1 | 683 | 664 | 172.8 |
| D | 5 | 222 | 633770 | 3663.74 | 683 | 664 | 172.8 |
| D | 13 | 249 | 413297 | 2387.88 | 683 | 664 | 172.8 |
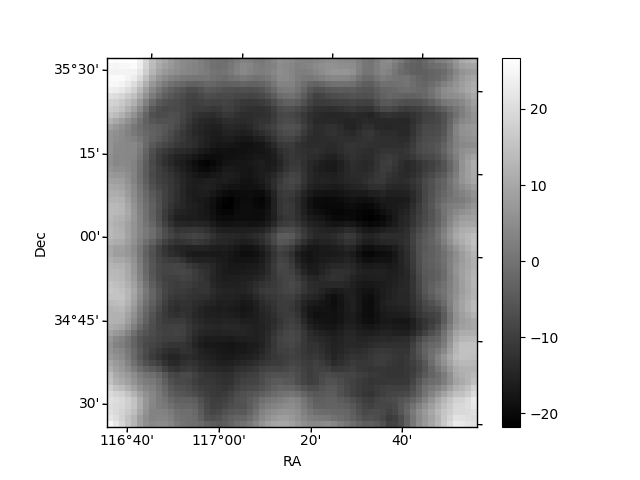
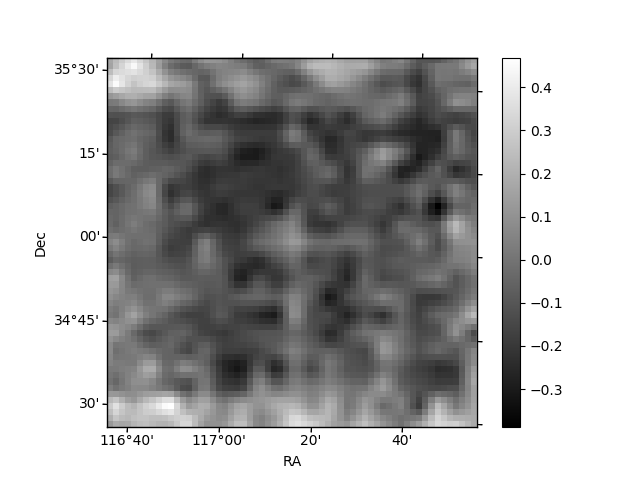
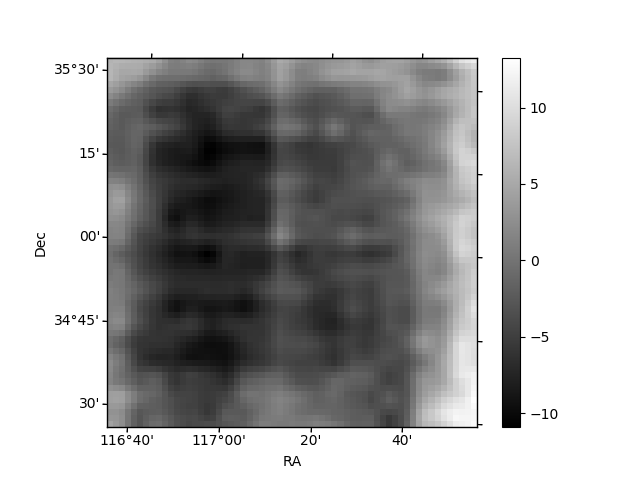
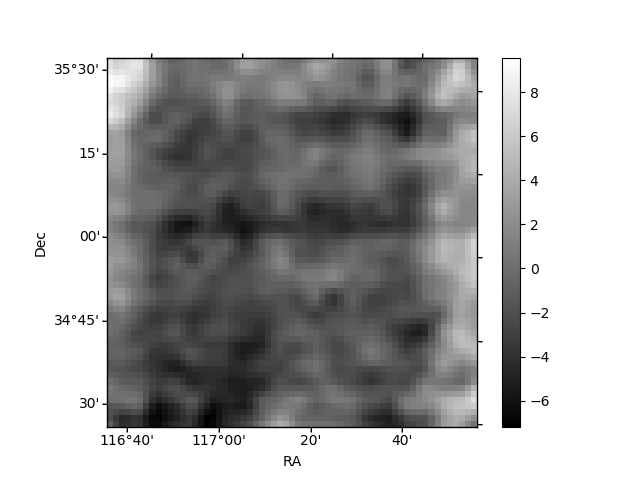
Histogram calculated using DETX and DETY for each event in the final _common_clean file
| Quadrant A | 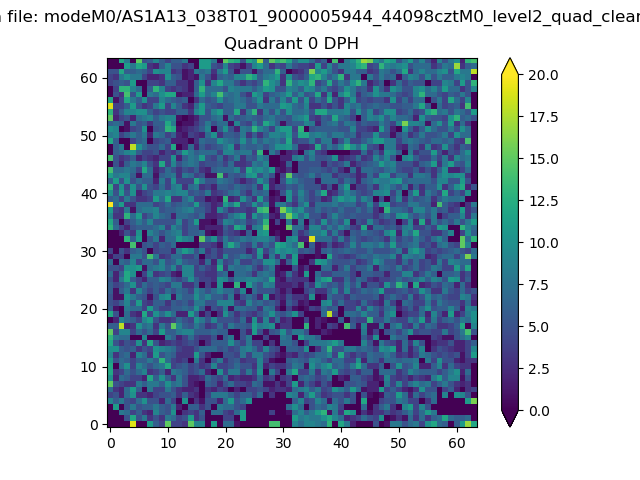 |
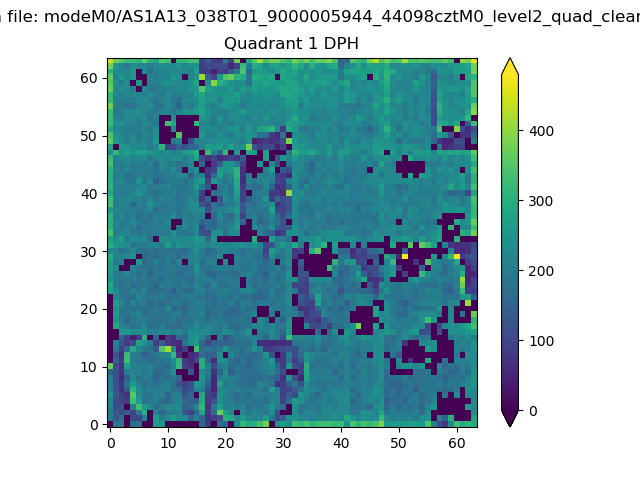 |
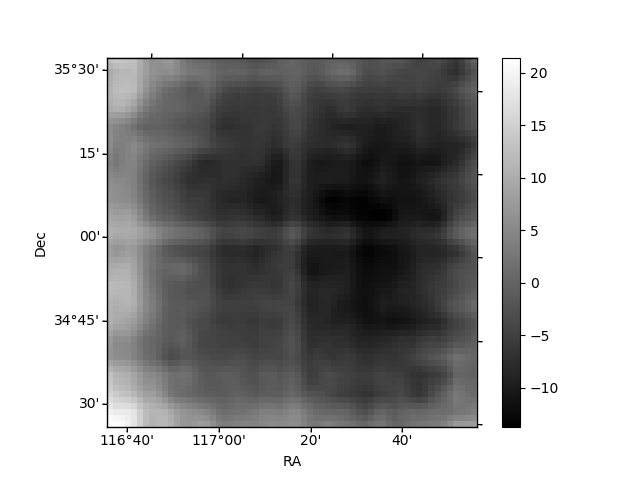
Quadrant B |
|---|---|---|---|
| Quadrant D | 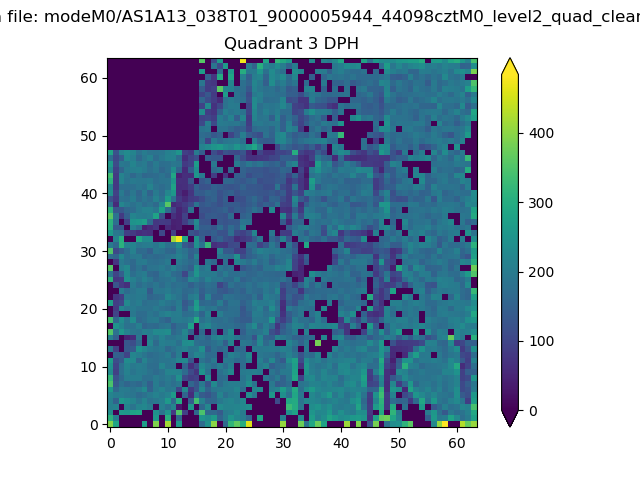 |
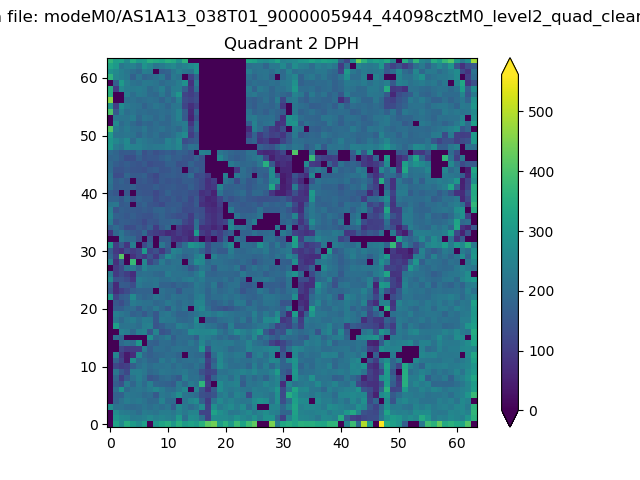 |
Quadrant C |
| Plot type | Count rate plots | Images |
|---|---|---|
| Comparison with Poisson distribution Blue bars denote a histogram of data divided into 1 sec bins. Red curve is a Poisson curve with rate = median count rate of data. |
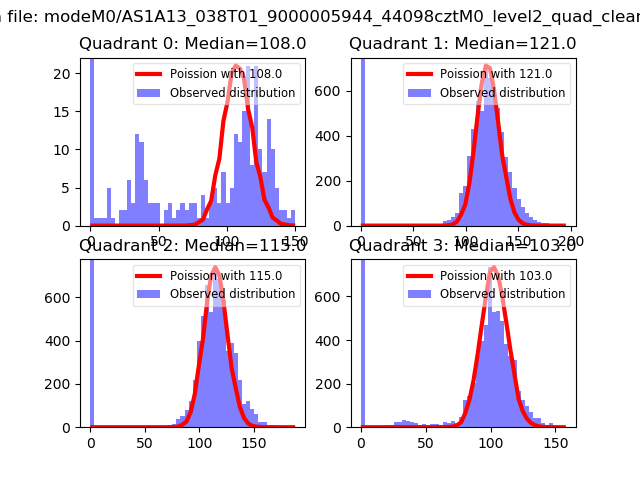 |
 |
| Quadrant-wise count rates Data is divided into 100 sec bins |
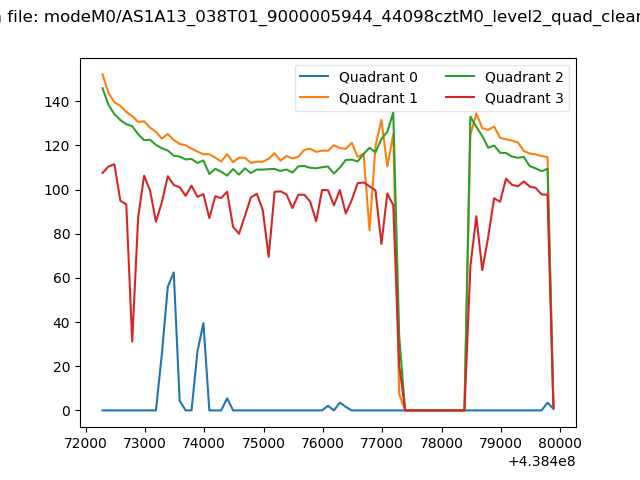 |
|
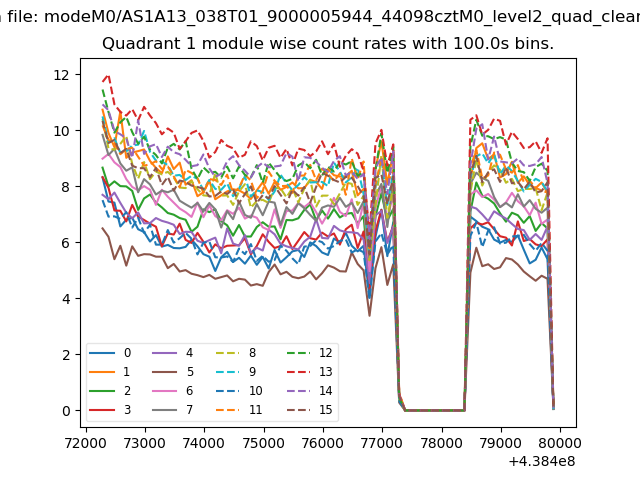
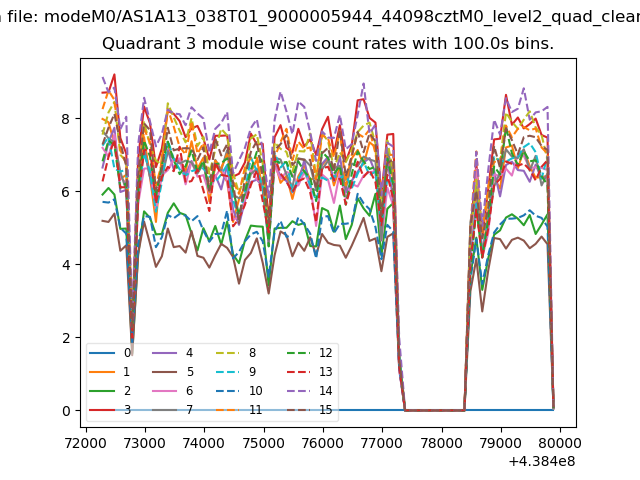
| Module-wise count rates for Quadrant A Data is divided into 100 sec bins |
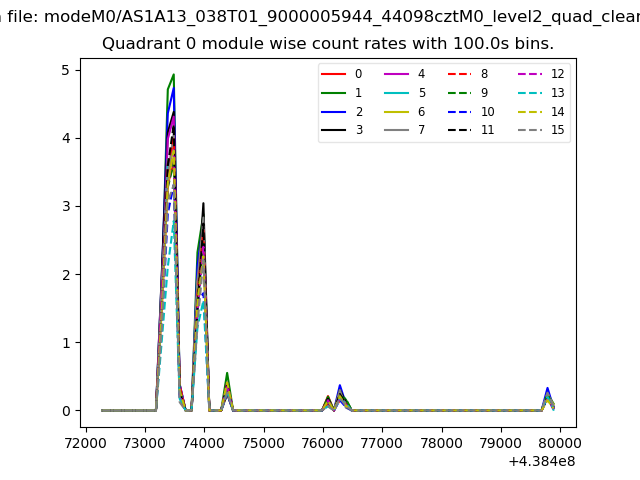 |
 |
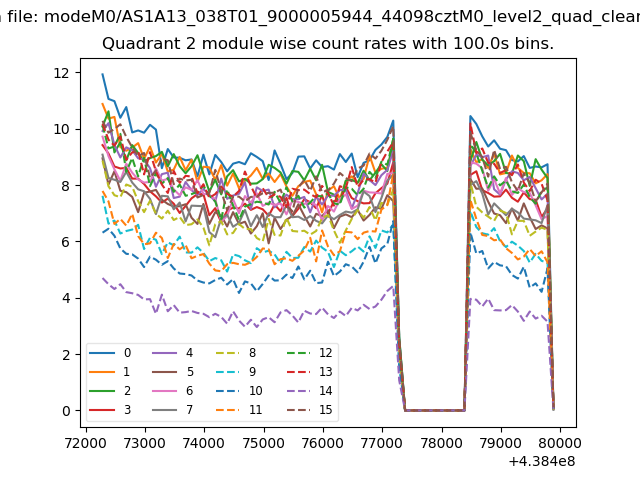
| Module-wise count rates for Quadrant B Data is divided into 100 sec bins |
 |
 |
| Module-wise count rates for Quadrant C Data is divided into 100 sec bins |
 |
 |
| Module-wise count rates for Quadrant D Data is divided into 100 sec bins |
 |
 |
| Parameter | Plot |
|---|---|
| CZT HV Monitor | 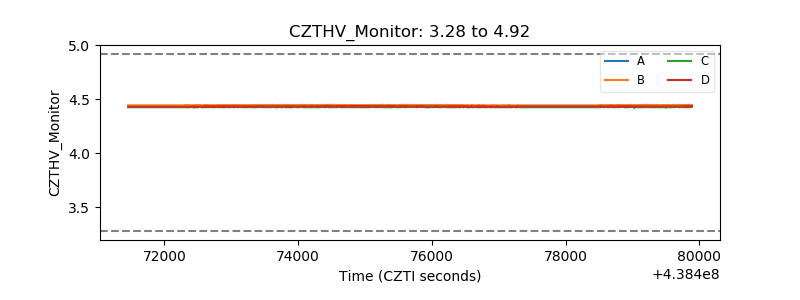 |
| D_VDD | 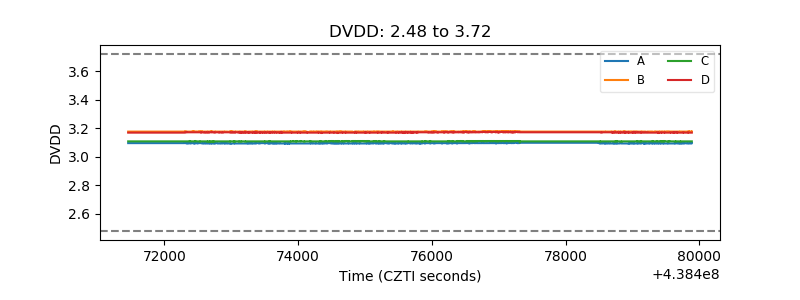 |
| Temperature 1 | 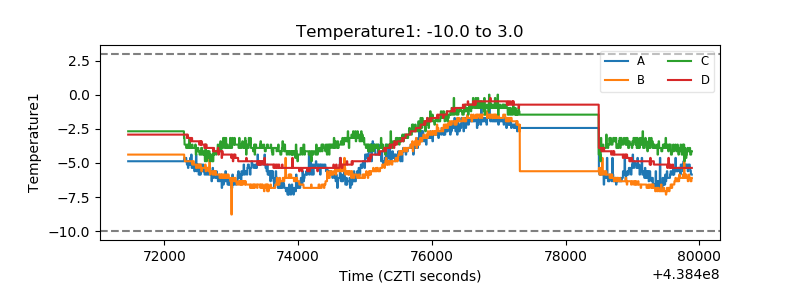 |
| Veto HV Monitor | 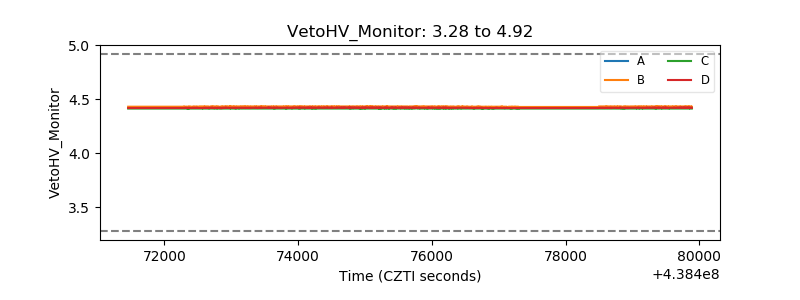 |
| Veto LLD | 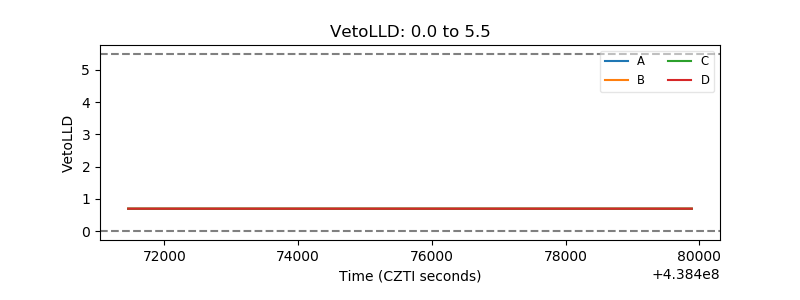 |
| Alpha Counter | 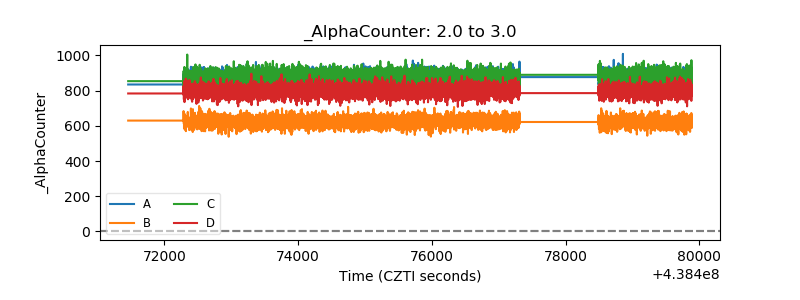 |
| _CPM_Rate | 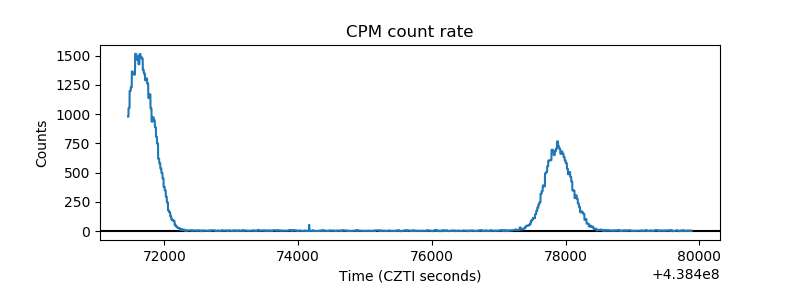 |
| CZT Counter | 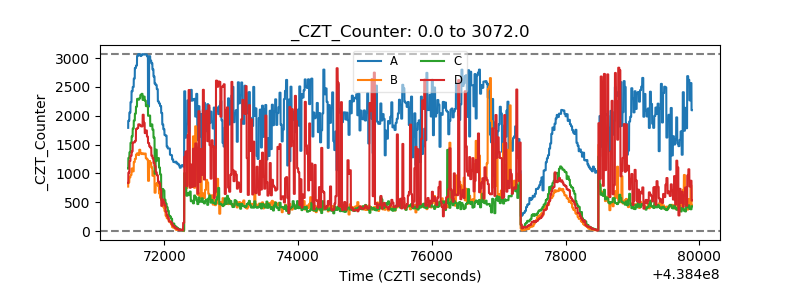 |
| +2.5 Volts monitor | 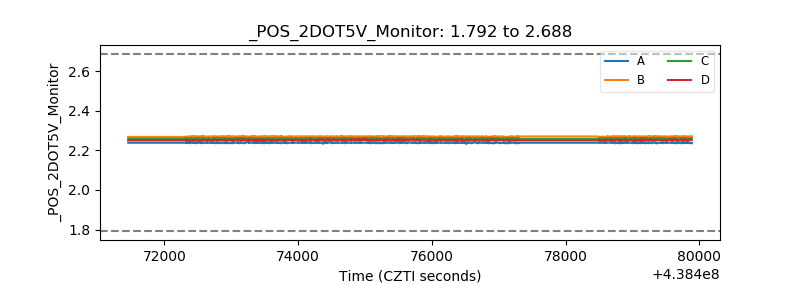 |
| +5 Volts monitor | 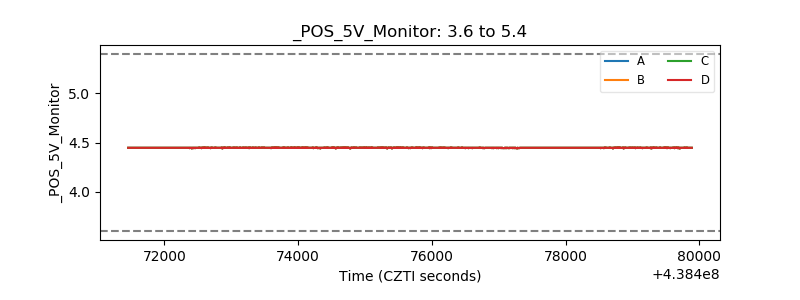 |
| _ROLL_ROT | 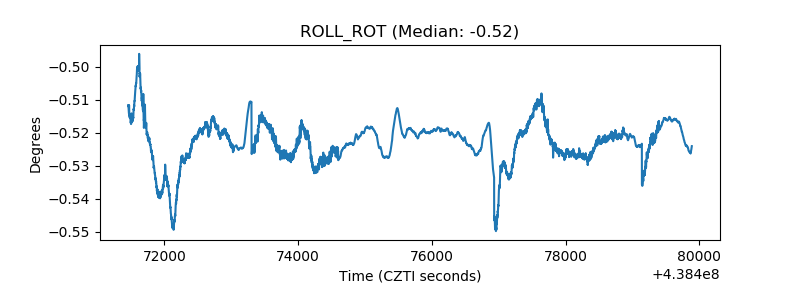 |
| _Roll_DEC | 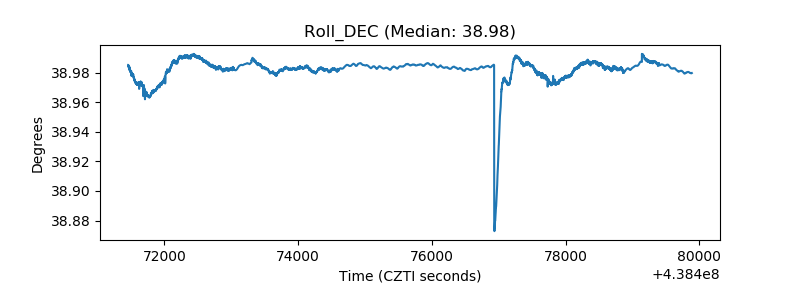 |
| _Roll_RA | 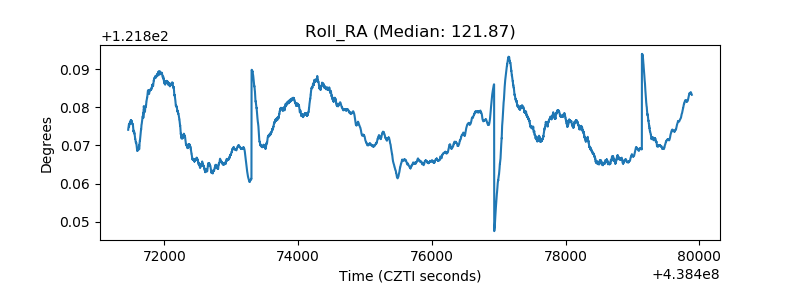 |
| Veto Counter | 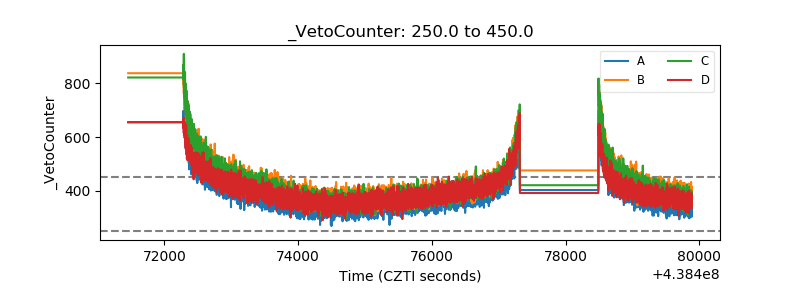 |