| Param | Original file | Final file |
|---|---|---|
| Filename | modeM0/AS1A13_038T01_9000005944_44099cztM0_level2.fits | modeM0/AS1A13_038T01_9000005944_44099cztM0_level2_quad_clean.evt |
| Size (bytes) | 737,654,400 | 91,362,240 |
| Size | 703.5 MB | 87.1 MB |
| Events in quadrant A | 13,524,935 | 44,564 |
| Events in quadrant B | 3,809,730 | 812,116 |
| Events in quadrant C | 3,145,182 | 778,219 |
| Events in quadrant D | 6,278,008 | 642,557 |
| Mode SS | |||
|---|---|---|---|
| Quadrant | BADHDUFLAG | Total packets | Discarded packets |
| A | 0 | 142 | 0 |
| B | 0 | 142 | 0 |
| C | 0 | 142 | 0 |
| D | 0 | 142 | 0 |
| Mode M9 | |||
|---|---|---|---|
| Quadrant | BADHDUFLAG | Total packets | Discarded packets |
| A | 0 | 18 | 0 |
| B | 0 | 19 | 0 |
| C | 0 | 19 | 0 |
| D | 0 | 19 | 0 |
| Mode M0 | |||
|---|---|---|---|
| Quadrant | BADHDUFLAG | Total packets | Discarded packets |
| A | 0 | 45063 | 3 |
| B | 0 | 16345 | 2 |
| C | 0 | 14567 | 2 |
| D | 0 | 23638 | 2 |
| Quadrant | Total seconds | Saturated seconds | Saturation percentage |
|---|---|---|---|
| A | 7021 | 6675 | 95.071927% |
| B | 7021 | 154 | 2.193420% |
| C | 7021 | 17 | 0.242131% |
| D | 7021 | 794 | 11.308930% |
Noise dominated data is calculated using 1-second bins in cleaned event files. If a bin has >2000 counts, and if more than 50% of those come from <1% of pixels, then it is considered to be noise-dominated and hence unusable.
| Quadrant | # 1 sec bins | Bins with >0 counts | Bins with >2000 counts | High rate bins dominated by noise | Noise dominated (total time) | Noise dominated (detector-on time) | Marked lightcurve |
|---|---|---|---|---|---|---|---|
| A | 8035 | 7019 | 3283 | 3283 | 40.86% | 46.77% | 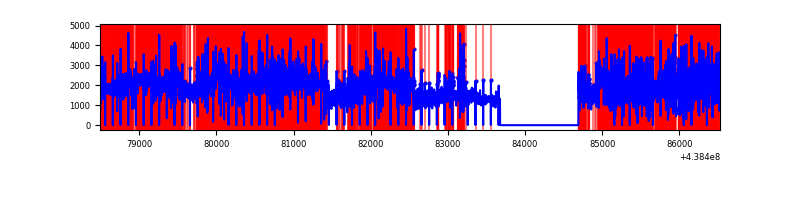 |
| B | 8036 | 7022 | 25 | 25 | 0.31% | 0.36% | 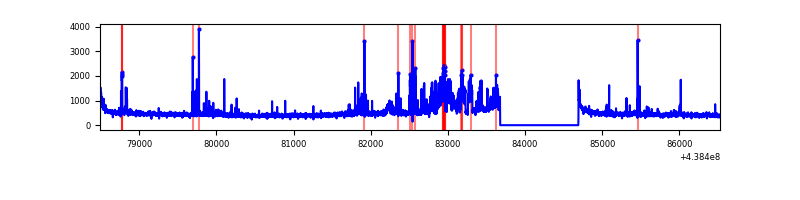 |
| C | 8036 | 7022 | 3 | 3 | 0.04% | 0.04% | 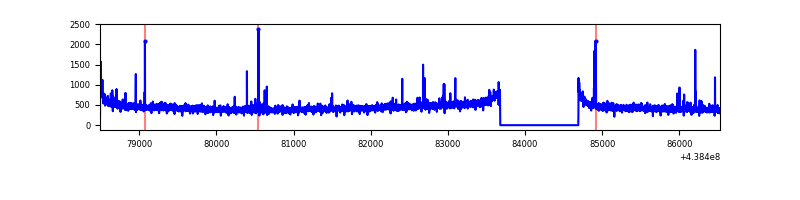 |
| D | 8036 | 7021 | 643 | 643 | 8.00% | 9.16% | 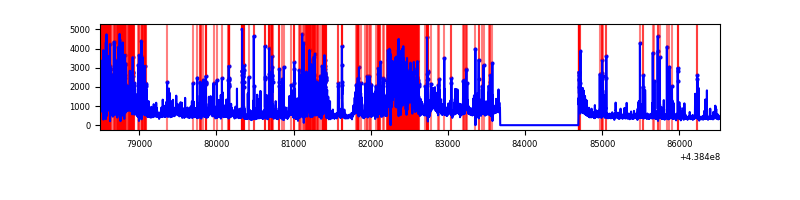 |
Top three noisy pixels from each quadrant. If the there are fewer than three noisy pixels in the level2.evt file, extra rows are filled as -1
| Pixel properties | Quadrant properties | ||||||
|---|---|---|---|---|---|---|---|
| Quadrant | DetID | PixID | Counts | Sigma | Mean | Median | Sigma |
| A | 15 | 223 | 12538198 | 366525.81 | 157 | 154 | 34.2 |
| A | 10 | 83 | 351403 | 10268.09 | 157 | 154 | 34.2 |
| A | 15 | 239 | 15569 | 450.63 | 157 | 154 | 34.2 |
| B | 15 | 36 | 273278 | 1742.11 | 797 | 772 | 156.4 |
| B | 4 | 171 | 216114 | 1376.67 | 797 | 772 | 156.4 |
| B | 0 | 200 | 66290 | 418.85 | 797 | 772 | 156.4 |
| C | 14 | 254 | 48268 | 259.0 | 781 | 787 | 183.3 |
| C | 14 | 96 | 33255 | 177.1 | 781 | 787 | 183.3 |
| C | 3 | 233 | 15466 | 80.07 | 781 | 787 | 183.3 |
| D | 1 | 52 | 1328989 | 7175.99 | 732 | 708 | 185.1 |
| D | 5 | 235 | 702754 | 3792.78 | 732 | 708 | 185.1 |
| D | 13 | 249 | 544464 | 2937.62 | 732 | 708 | 185.1 |
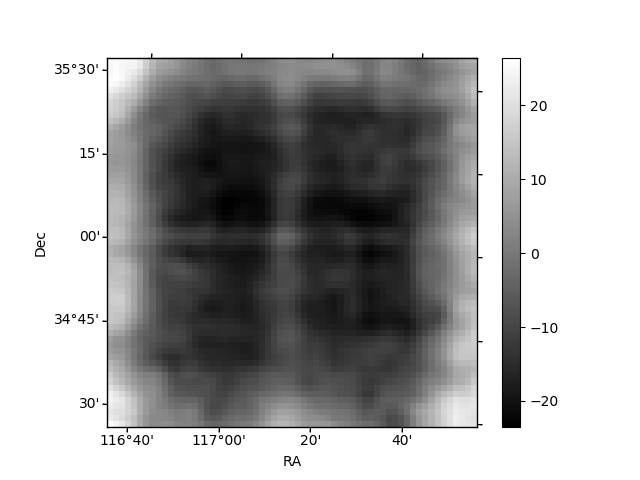
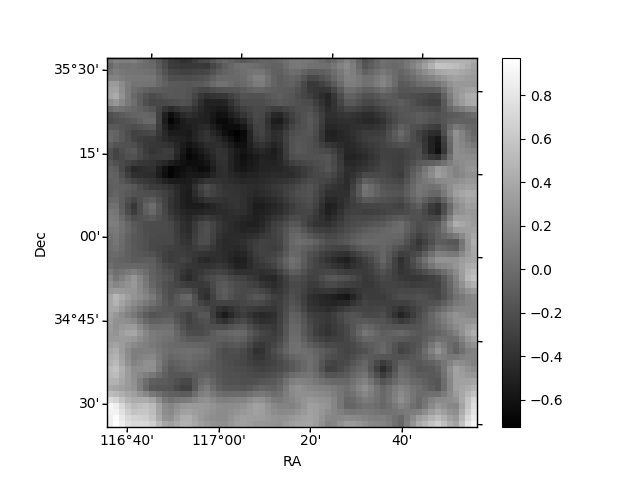
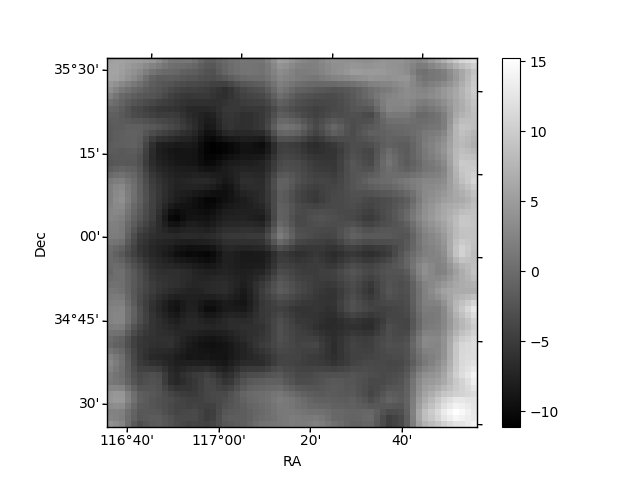
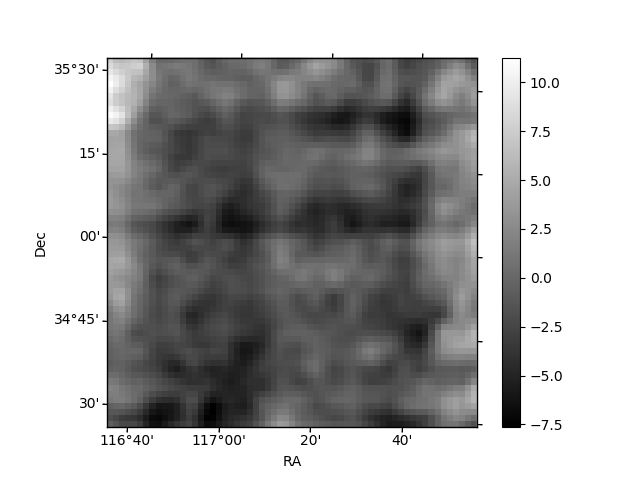
Histogram calculated using DETX and DETY for each event in the final _common_clean file
| Quadrant A | 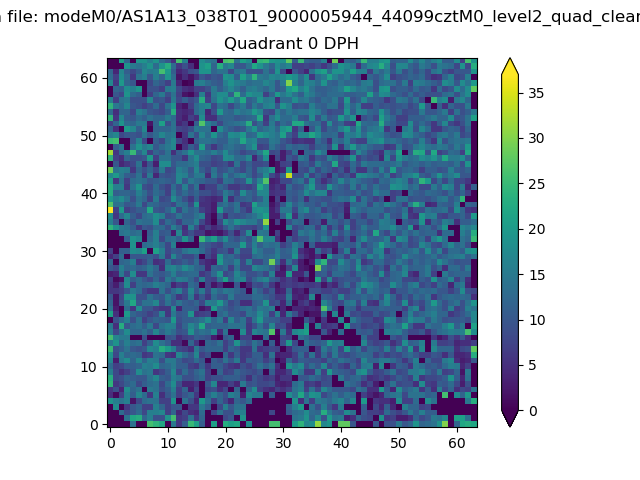 |
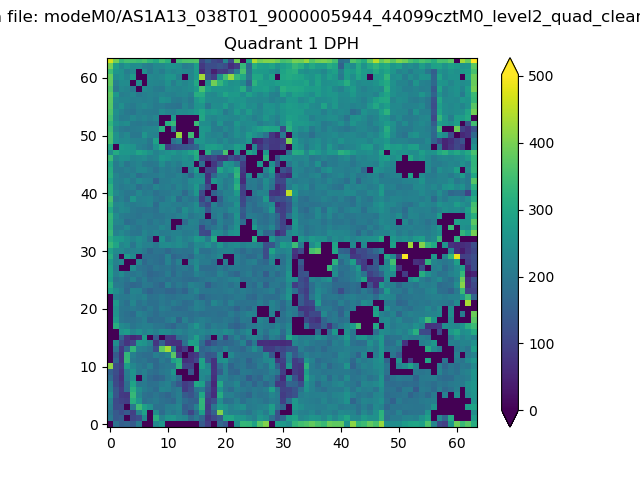 |
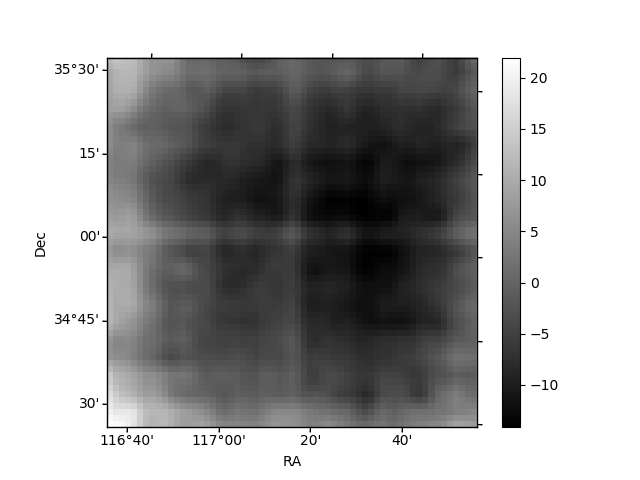
Quadrant B |
|---|---|---|---|
| Quadrant D | 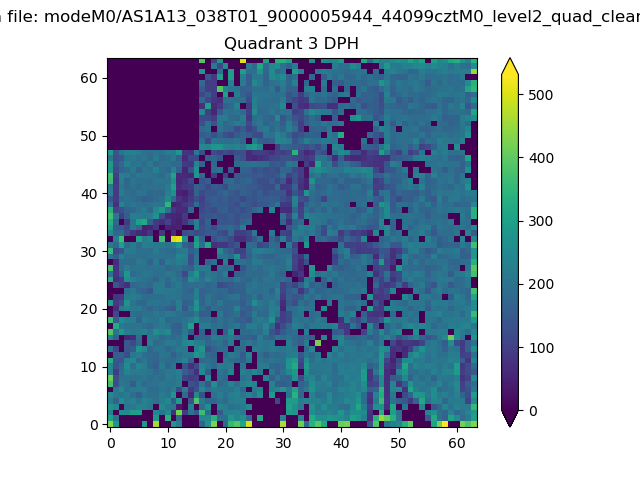 |
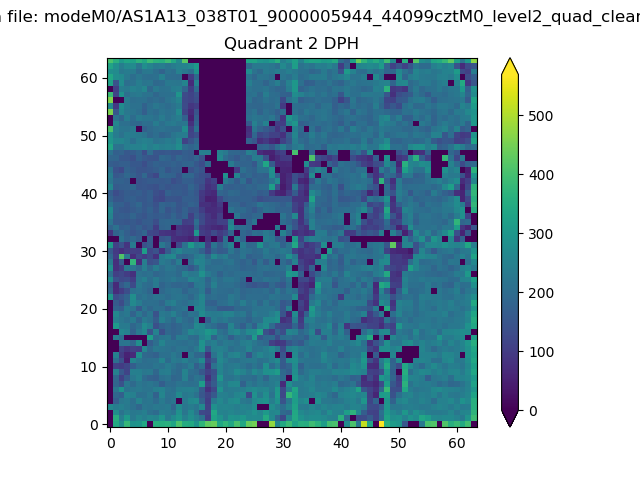 |
Quadrant C |
| Plot type | Count rate plots | Images |
|---|---|---|
| Comparison with Poisson distribution Blue bars denote a histogram of data divided into 1 sec bins. Red curve is a Poisson curve with rate = median count rate of data. |
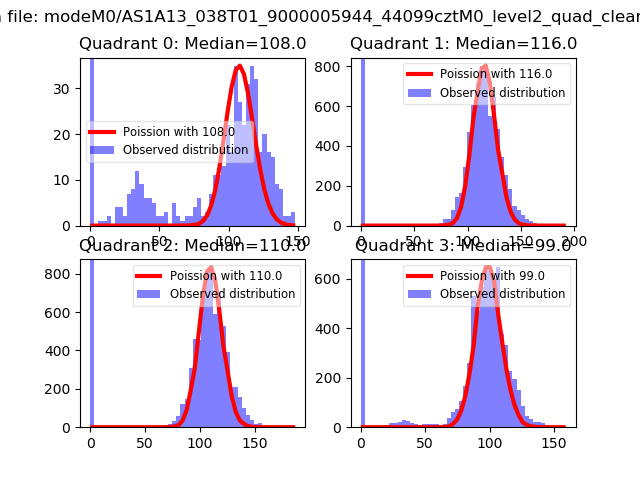 |
 |
| Quadrant-wise count rates Data is divided into 100 sec bins |
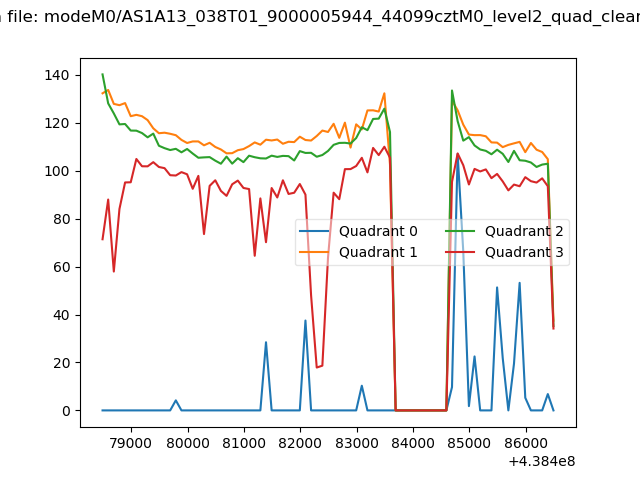 |
|
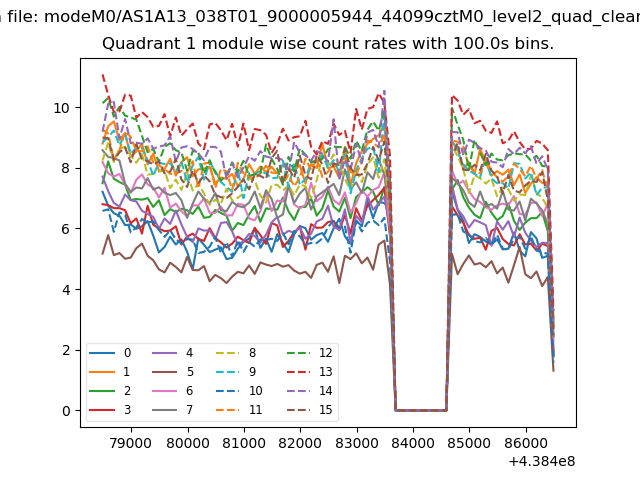
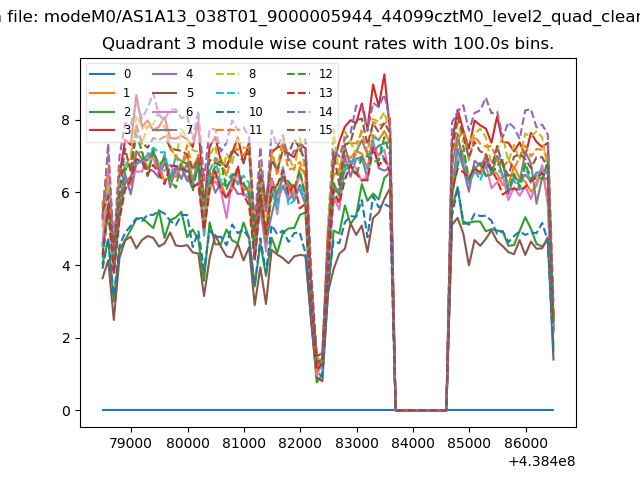
| Module-wise count rates for Quadrant A Data is divided into 100 sec bins |
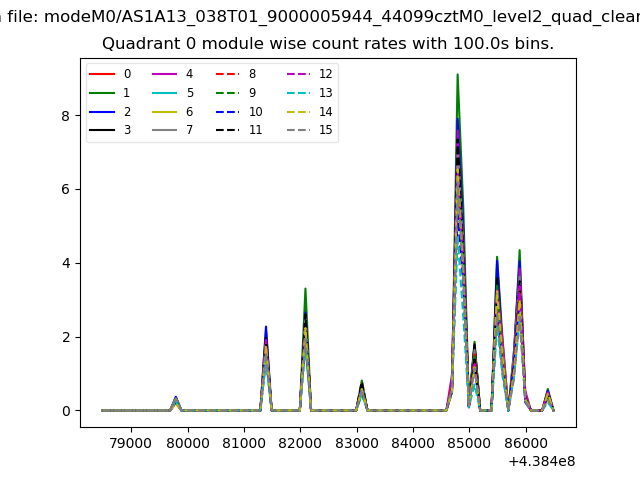 |
 |
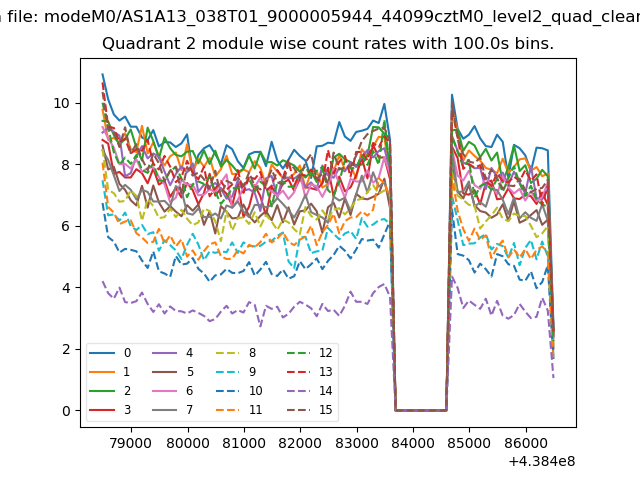
| Module-wise count rates for Quadrant B Data is divided into 100 sec bins |
 |
 |
| Module-wise count rates for Quadrant C Data is divided into 100 sec bins |
 |
 |
| Module-wise count rates for Quadrant D Data is divided into 100 sec bins |
 |
 |
| Parameter | Plot |
|---|---|
| CZT HV Monitor | 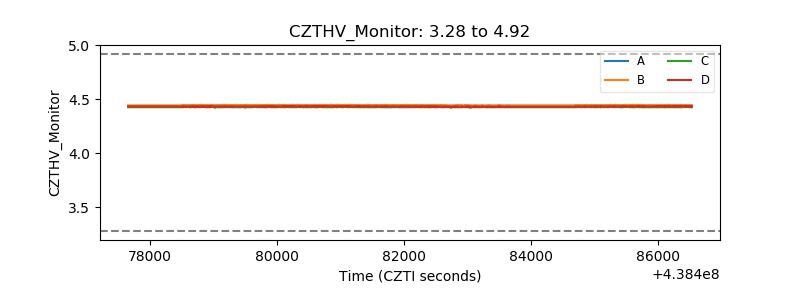 |
| D_VDD | 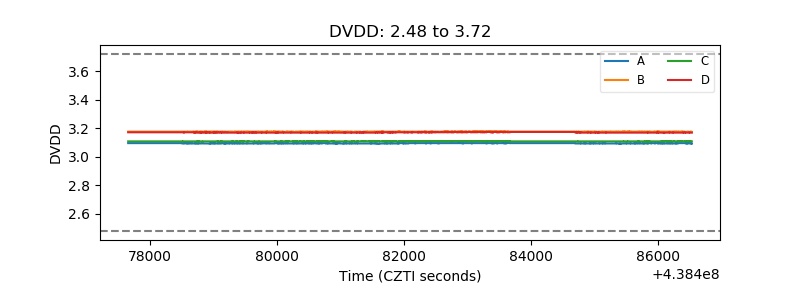 |
| Temperature 1 | 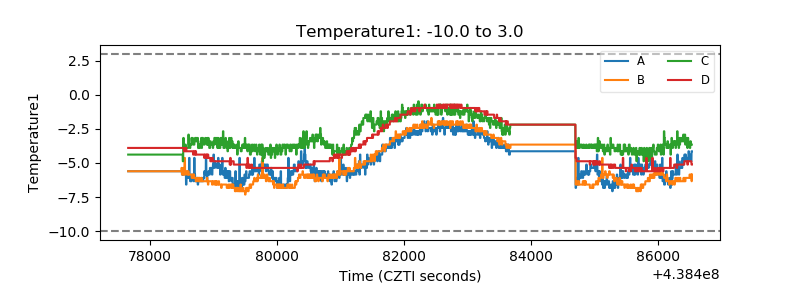 |
| Veto HV Monitor |  |
| Veto LLD | 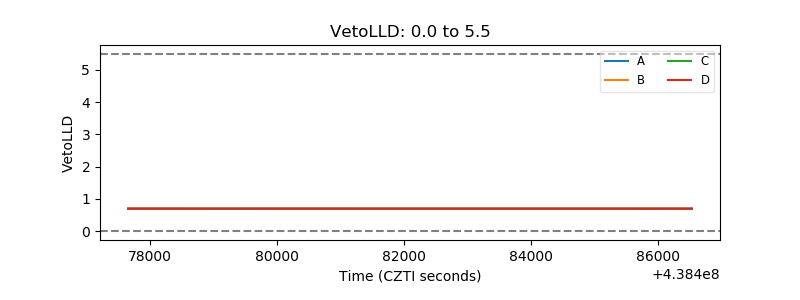 |
| Alpha Counter | 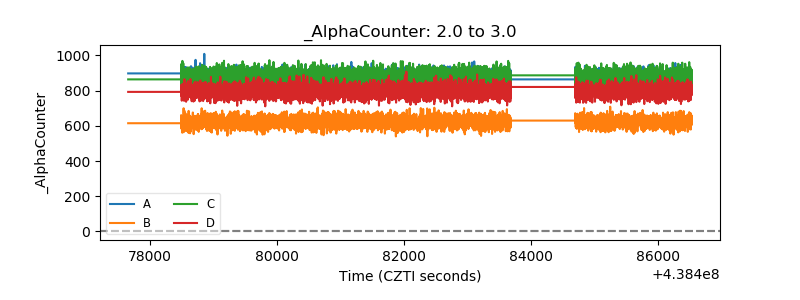 |
| _CPM_Rate | 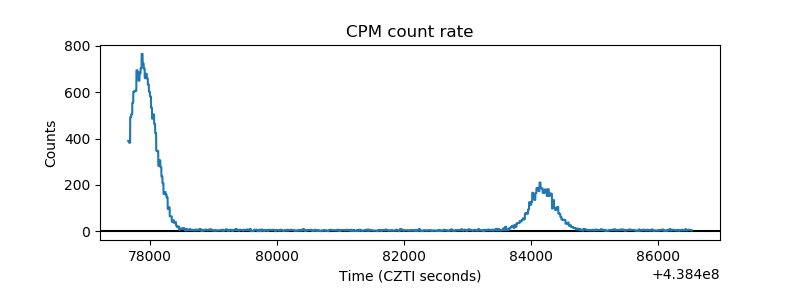 |
| CZT Counter | 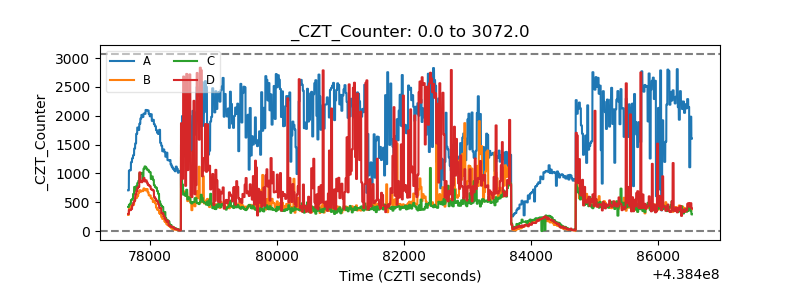 |
| +2.5 Volts monitor | 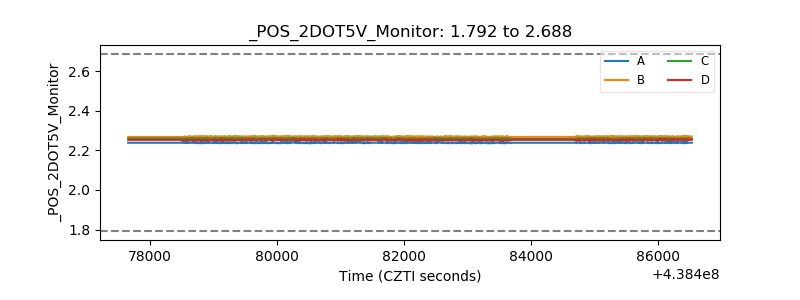 |
| +5 Volts monitor | 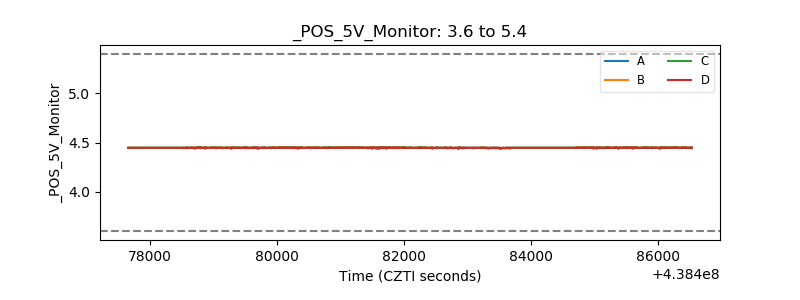 |
| _ROLL_ROT | 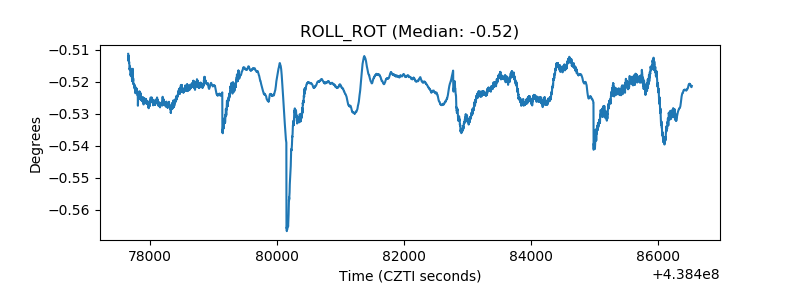 |
| _Roll_DEC | 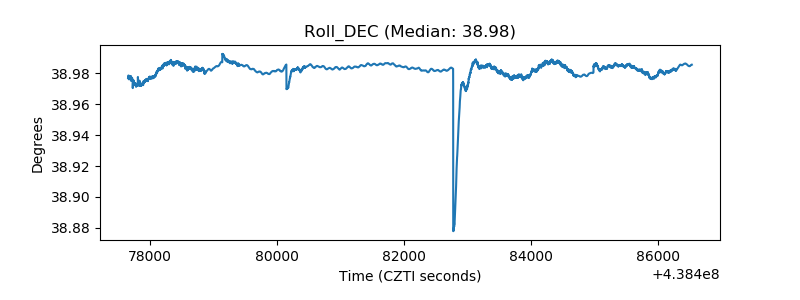 |
| _Roll_RA | 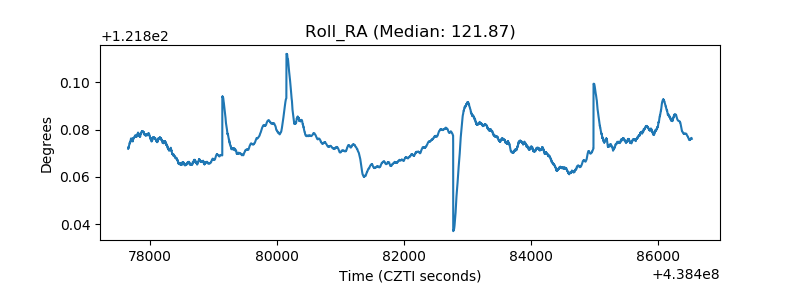 |
| Veto Counter | 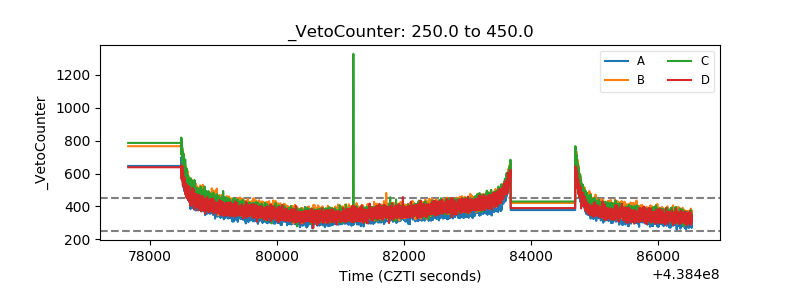 |