| Param | Original file | Final file |
|---|---|---|
| Filename | modeM0/AS1A13_038T01_9000005944_44100cztM0_level2.fits | modeM0/AS1A13_038T01_9000005944_44100cztM0_level2_quad_clean.evt |
| Size (bytes) | 678,323,520 | 92,324,160 |
| Size | 646.9 MB | 88.0 MB |
| Events in quadrant A | 12,908,893 | 228,493 |
| Events in quadrant B | 3,462,716 | 749,445 |
| Events in quadrant C | 3,069,801 | 724,604 |
| Events in quadrant D | 5,140,208 | 620,245 |
| Mode SS | |||
|---|---|---|---|
| Quadrant | BADHDUFLAG | Total packets | Discarded packets |
| A | 0 | 138 | 0 |
| B | 0 | 138 | 0 |
| C | 0 | 138 | 0 |
| D | 0 | 138 | 0 |
| Mode M9 | |||
|---|---|---|---|
| Quadrant | BADHDUFLAG | Total packets | Discarded packets |
| A | 0 | 5 | 0 |
| B | 0 | 5 | 0 |
| C | 0 | 5 | 0 |
| D | 0 | 5 | 0 |
| Mode M0 | |||
|---|---|---|---|
| Quadrant | BADHDUFLAG | Total packets | Discarded packets |
| A | 0 | 43060 | 3 |
| B | 0 | 15161 | 1 |
| C | 0 | 14240 | 1 |
| D | 0 | 20238 | 1 |
| Quadrant | Total seconds | Saturated seconds | Saturation percentage |
|---|---|---|---|
| A | 6779 | 4888 | 72.105030% |
| B | 6780 | 192 | 2.831858% |
| C | 6780 | 32 | 0.471976% |
| D | 6780 | 509 | 7.507375% |
Noise dominated data is calculated using 1-second bins in cleaned event files. If a bin has >2000 counts, and if more than 50% of those come from <1% of pixels, then it is considered to be noise-dominated and hence unusable.
| Quadrant | # 1 sec bins | Bins with >0 counts | Bins with >2000 counts | High rate bins dominated by noise | Noise dominated (total time) | Noise dominated (detector-on time) | Marked lightcurve |
|---|---|---|---|---|---|---|---|
| A | 7334 | 6779 | 3372 | 3372 | 45.98% | 49.74% | 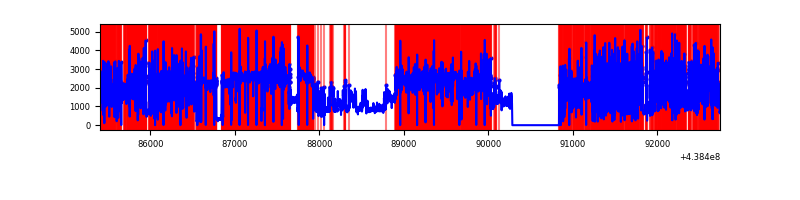 |
| B | 7335 | 6781 | 65 | 65 | 0.89% | 0.96% | 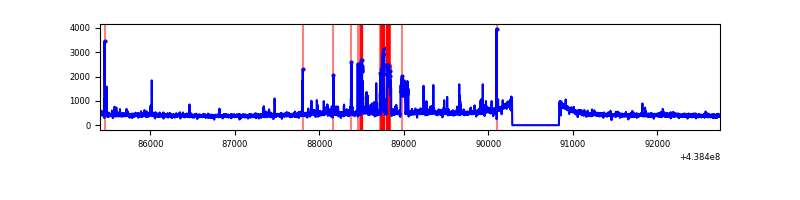 |
| C | 7335 | 6781 | 5 | 5 | 0.07% | 0.07% | 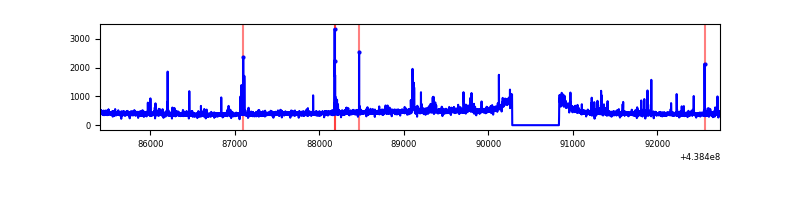 |
| D | 7335 | 6781 | 390 | 390 | 5.32% | 5.75% |  |
Top three noisy pixels from each quadrant. If the there are fewer than three noisy pixels in the level2.evt file, extra rows are filled as -1
| Pixel properties | Quadrant properties | ||||||
|---|---|---|---|---|---|---|---|
| Quadrant | DetID | PixID | Counts | Sigma | Mean | Median | Sigma |
| A | 15 | 223 | 10719448 | 128166.63 | 395 | 386 | 83.6 |
| A | 10 | 83 | 617994 | 7384.67 | 395 | 386 | 83.6 |
| A | 14 | 238 | 18359 | 214.9 | 395 | 386 | 83.6 |
| B | 15 | 36 | 255891 | 1691.86 | 760 | 737 | 150.8 |
| B | 4 | 171 | 109796 | 723.14 | 760 | 737 | 150.8 |
| B | 4 | 173 | 34988 | 227.11 | 760 | 737 | 150.8 |
| C | 14 | 254 | 74814 | 415.43 | 746 | 749 | 178.3 |
| C | 14 | 96 | 41625 | 229.27 | 746 | 749 | 178.3 |
| C | 3 | 233 | 26352 | 143.61 | 746 | 749 | 178.3 |
| D | 13 | 171 | 638902 | 3504.61 | 722 | 699 | 182.1 |
| D | 1 | 52 | 475775 | 2608.82 | 722 | 699 | 182.1 |
| D | 2 | 249 | 280663 | 1537.38 | 722 | 699 | 182.1 |
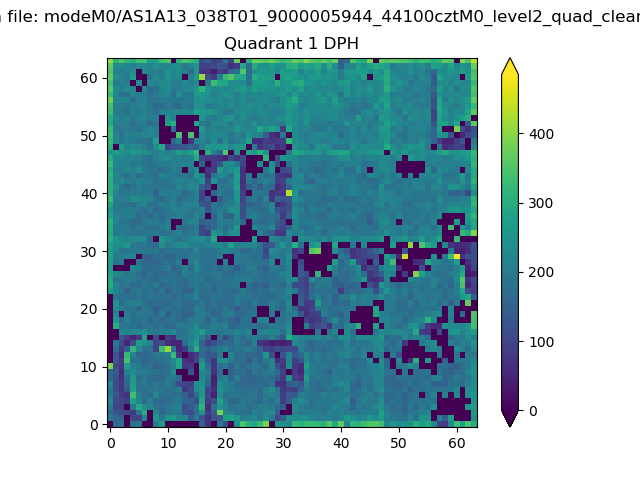
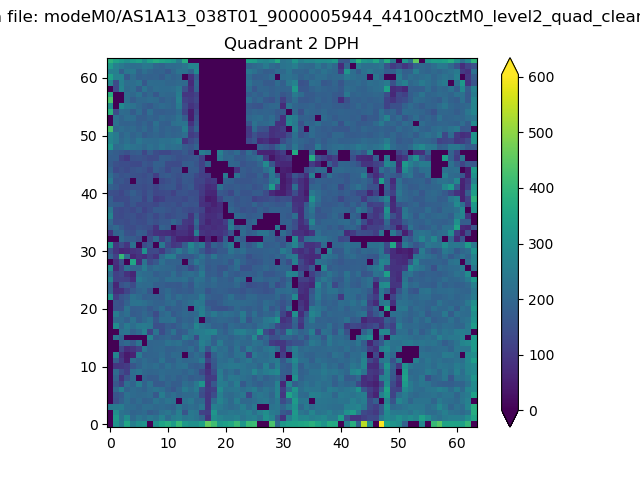
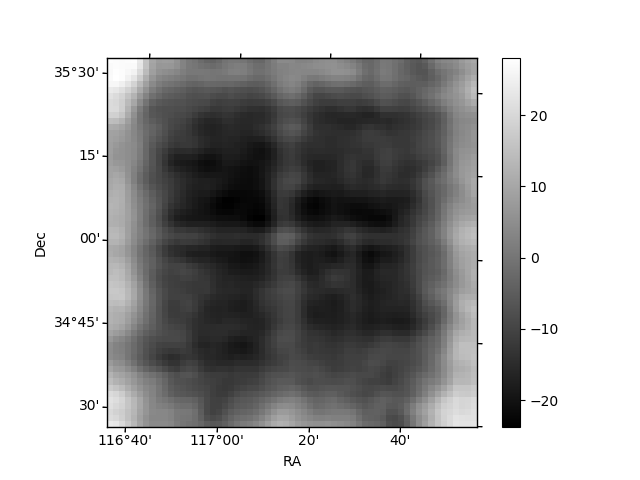
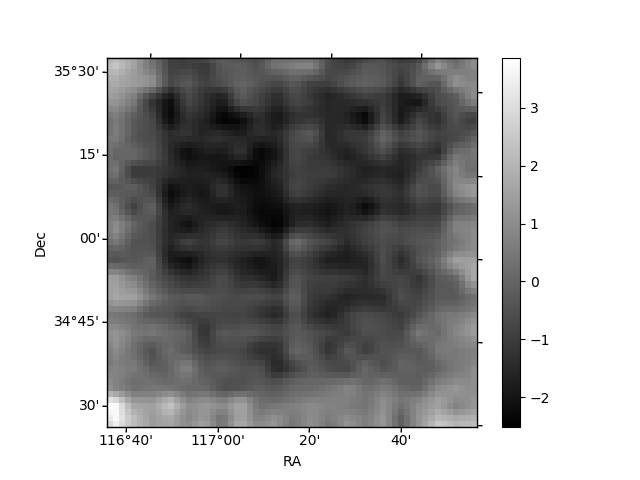
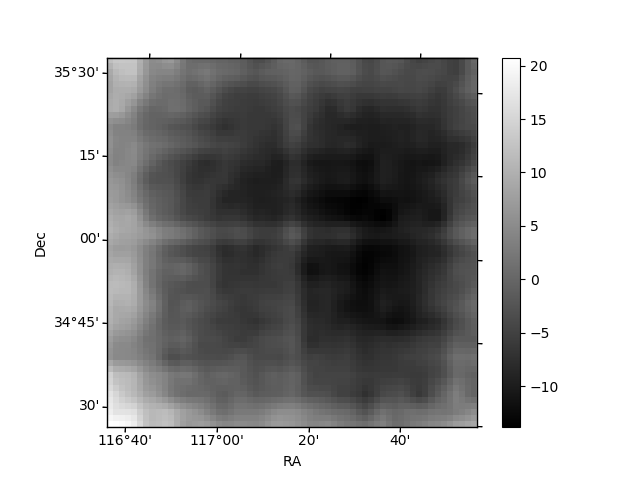
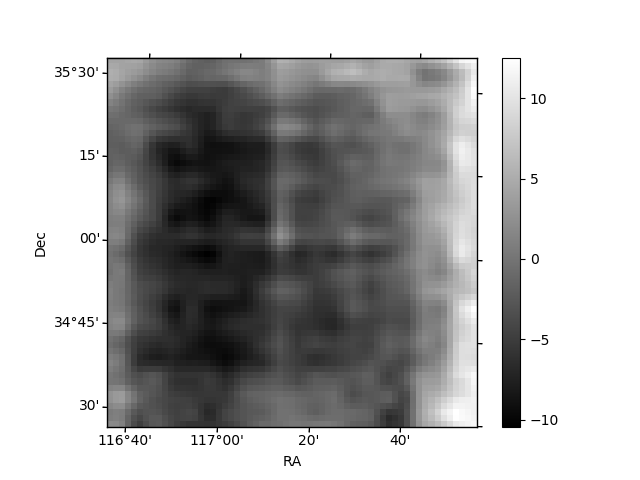
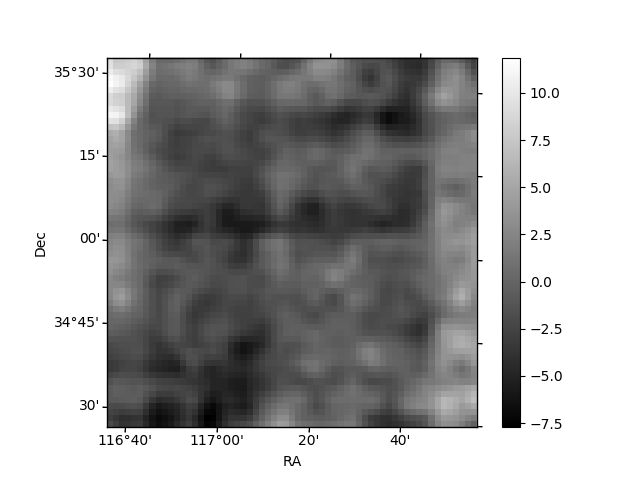
Histogram calculated using DETX and DETY for each event in the final _common_clean file
| Quadrant A | 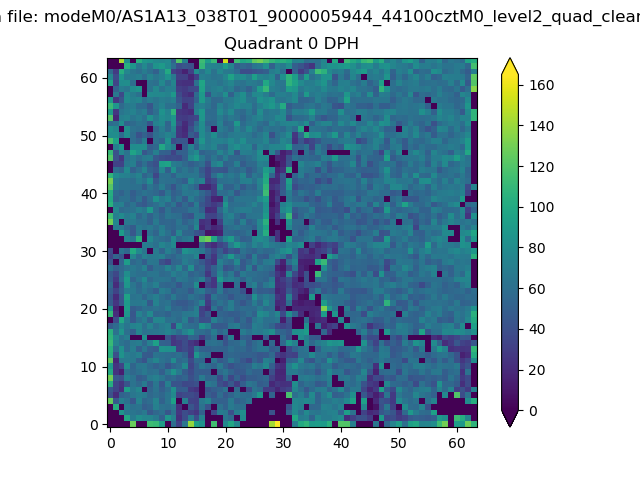 |
 |
Quadrant B |
|---|---|---|---|
| Quadrant D | 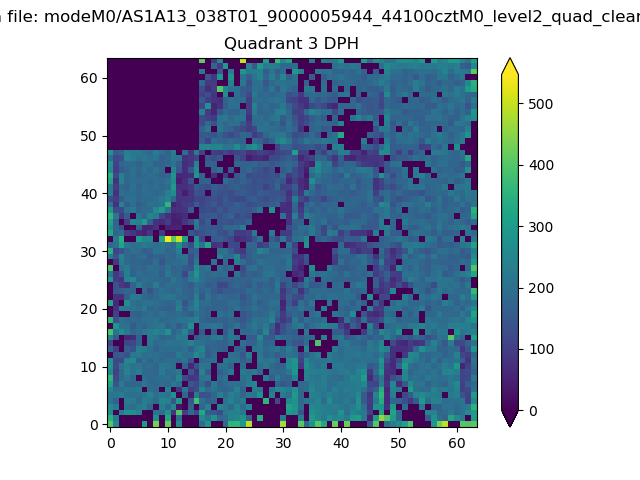 |
 |
Quadrant C |
| Plot type | Count rate plots | Images |
|---|---|---|
| Comparison with Poisson distribution Blue bars denote a histogram of data divided into 1 sec bins. Red curve is a Poisson curve with rate = median count rate of data. |
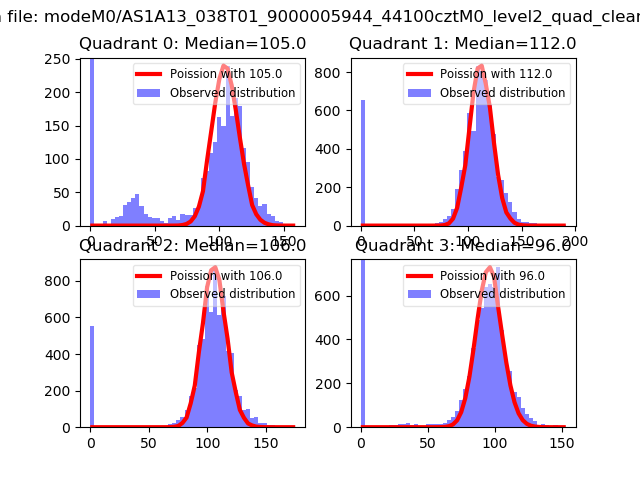 |
 |
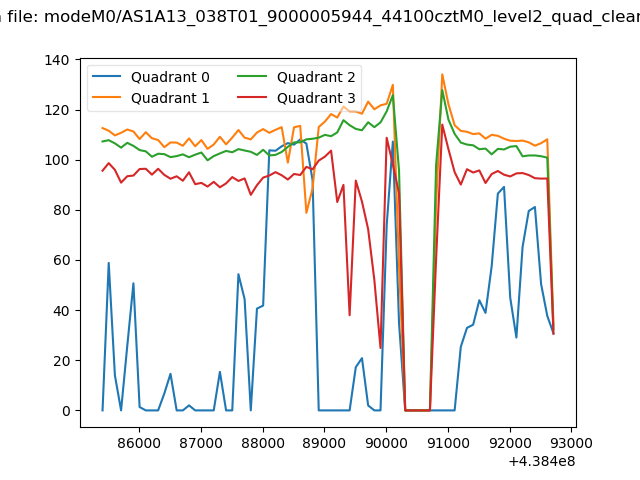
| Quadrant-wise count rates Data is divided into 100 sec bins |
 |
|
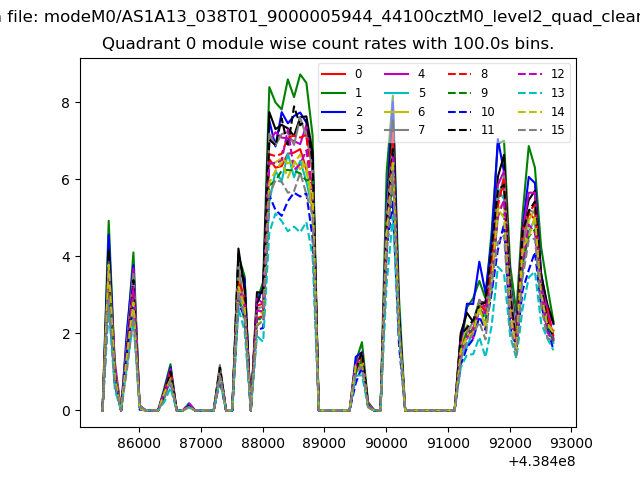
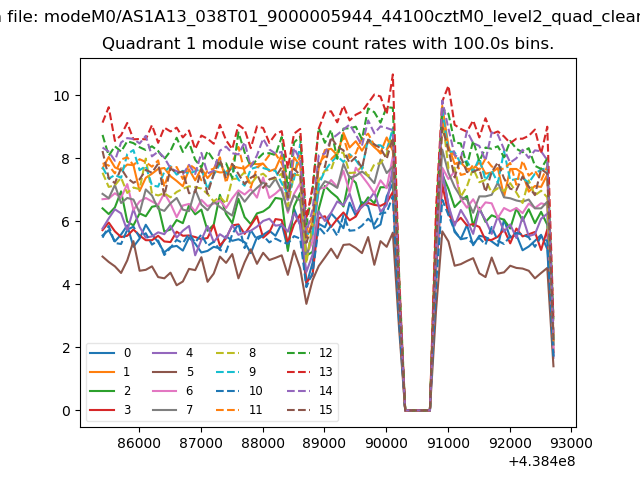
| Module-wise count rates for Quadrant A Data is divided into 100 sec bins |
 |
 |
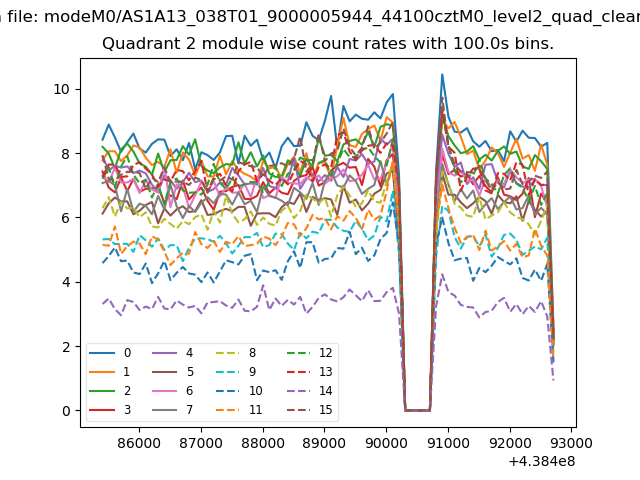
| Module-wise count rates for Quadrant B Data is divided into 100 sec bins |
 |
 |
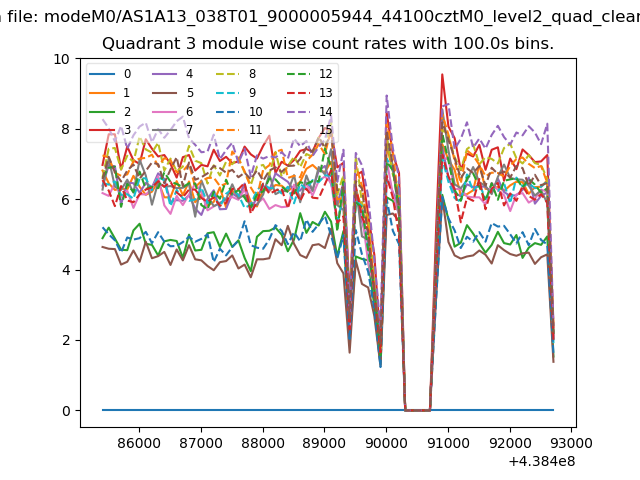
| Module-wise count rates for Quadrant C Data is divided into 100 sec bins |
 |
 |
| Module-wise count rates for Quadrant D Data is divided into 100 sec bins |
 |
 |
| Parameter | Plot |
|---|---|
| CZT HV Monitor | 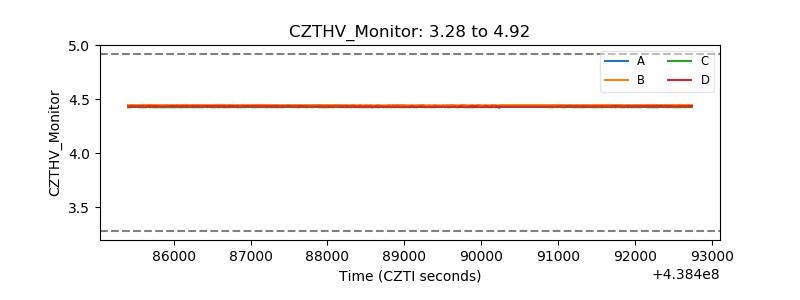 |
| D_VDD | 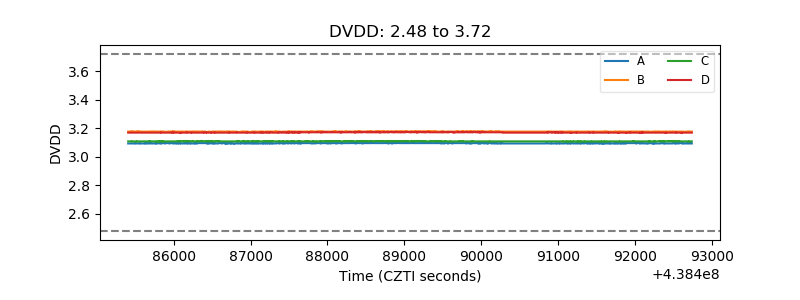 |
| Temperature 1 | 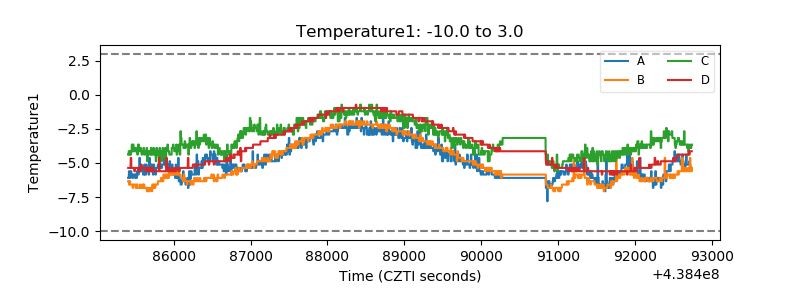 |
| Veto HV Monitor | 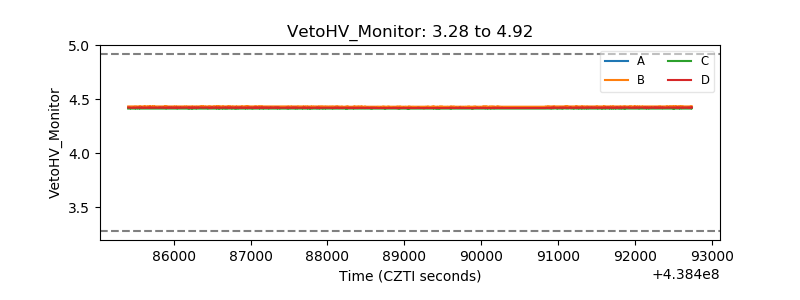 |
| Veto LLD | 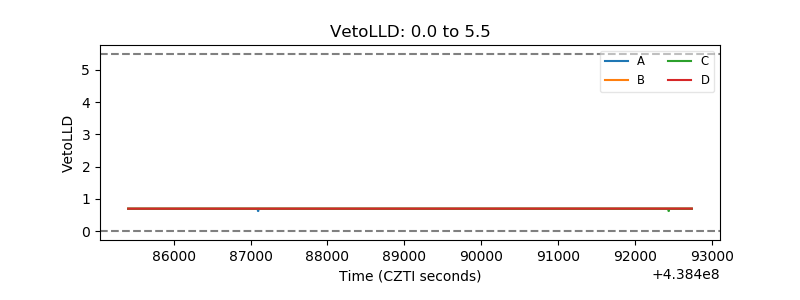 |
| Alpha Counter | 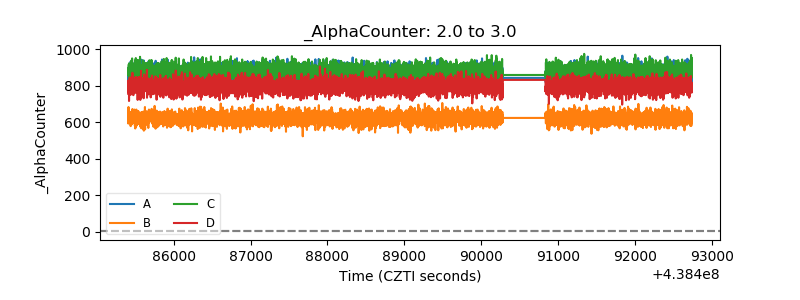 |
| _CPM_Rate | 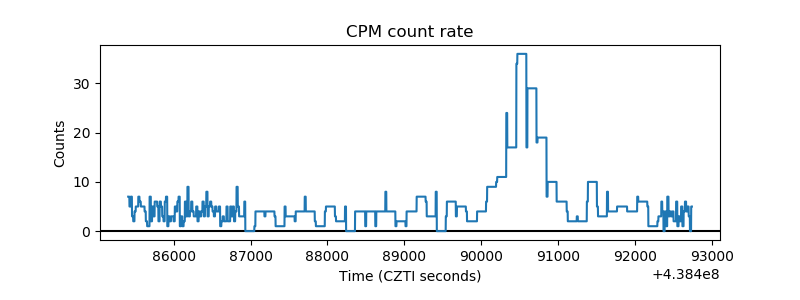 |
| CZT Counter | 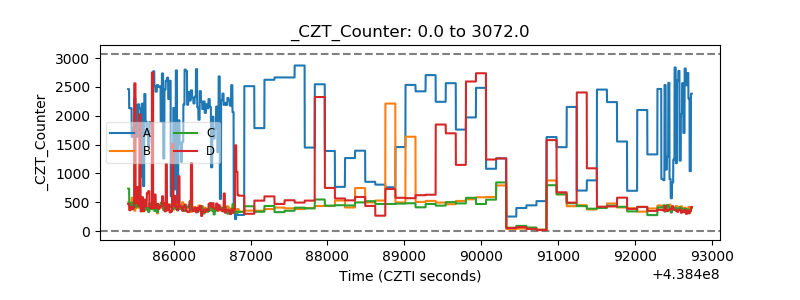 |
| +2.5 Volts monitor | 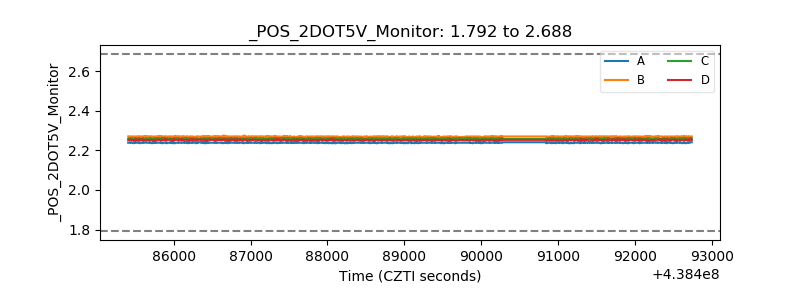 |
| +5 Volts monitor | 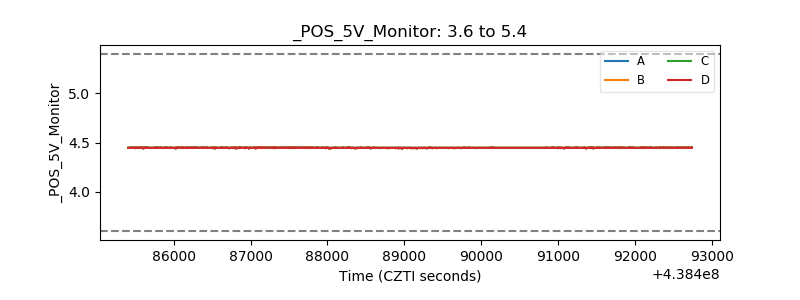 |
| _ROLL_ROT | 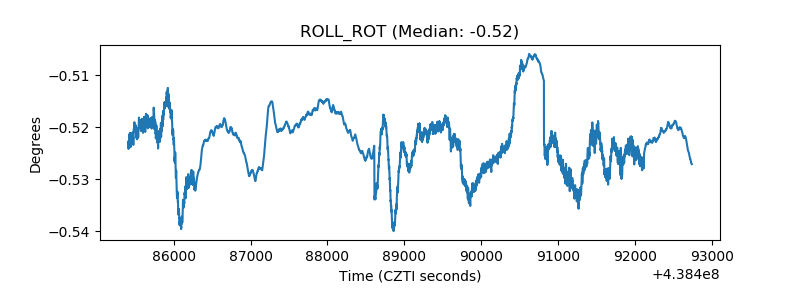 |
| _Roll_DEC | 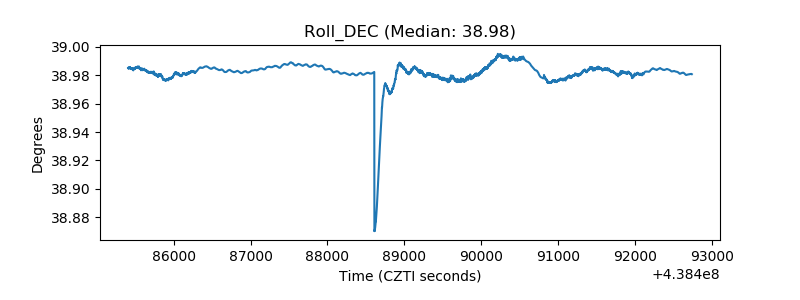 |
| _Roll_RA | 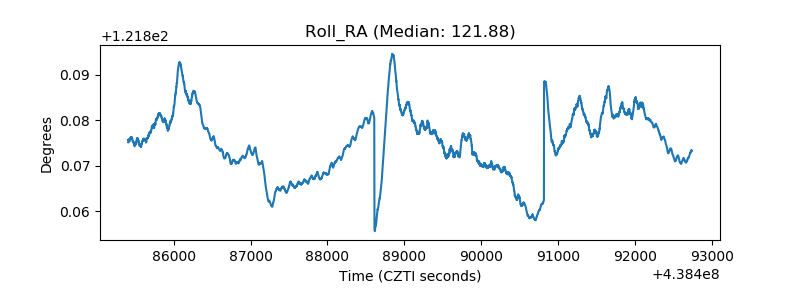 |
| Veto Counter | 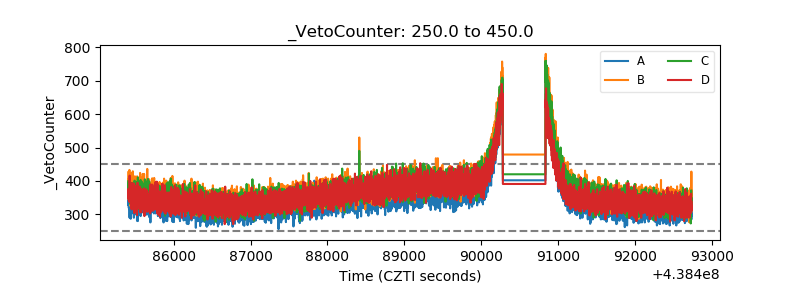 |