| Param | Original file | Final file |
|---|---|---|
| Filename | modeM0/AS1A13_038T01_9000005944_44101cztM0_level2.fits | modeM0/AS1A13_038T01_9000005944_44101cztM0_level2_quad_clean.evt |
| Size (bytes) | 693,080,640 | 101,067,840 |
| Size | 661.0 MB | 96.4 MB |
| Events in quadrant A | 13,070,866 | 354,715 |
| Events in quadrant B | 3,736,429 | 784,719 |
| Events in quadrant C | 3,177,349 | 755,042 |
| Events in quadrant D | 5,115,557 | 667,491 |
| Mode SS | |||
|---|---|---|---|
| Quadrant | BADHDUFLAG | Total packets | Discarded packets |
| A | 0 | 144 | 0 |
| B | 0 | 144 | 0 |
| C | 0 | 144 | 0 |
| D | 0 | 144 | 0 |
| Mode M0 | |||
|---|---|---|---|
| Quadrant | BADHDUFLAG | Total packets | Discarded packets |
| A | 0 | 43804 | 8 |
| B | 0 | 16190 | 0 |
| C | 0 | 14859 | 2 |
| D | 0 | 20313 | 5 |
| Quadrant | Total seconds | Saturated seconds | Saturation percentage |
|---|---|---|---|
| A | 7146 | 4260 | 59.613770% |
| B | 7147 | 137 | 1.916888% |
| C | 7147 | 14 | 0.195886% |
| D | 7146 | 333 | 4.659950% |
Noise dominated data is calculated using 1-second bins in cleaned event files. If a bin has >2000 counts, and if more than 50% of those come from <1% of pixels, then it is considered to be noise-dominated and hence unusable.
| Quadrant | # 1 sec bins | Bins with >0 counts | Bins with >2000 counts | High rate bins dominated by noise | Noise dominated (total time) | Noise dominated (detector-on time) | Marked lightcurve |
|---|---|---|---|---|---|---|---|
| A | 7147 | 7145 | 2928 | 2928 | 40.97% | 40.98% | 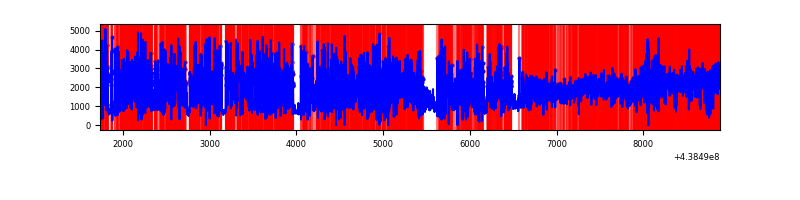 |
| B | 7147 | 7147 | 29 | 29 | 0.41% | 0.41% | 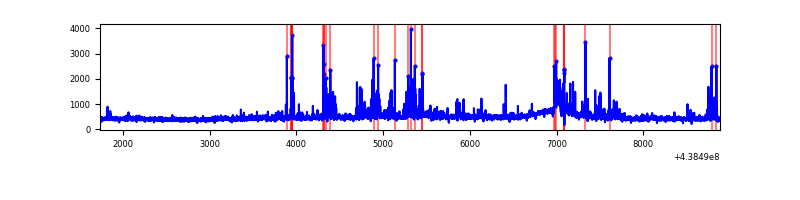 |
| C | 7148 | 7148 | 9 | 9 | 0.13% | 0.13% | 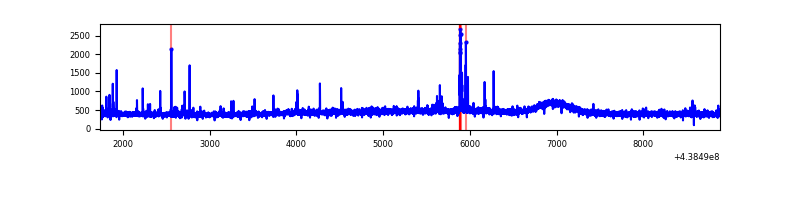 |
| D | 7148 | 7148 | 239 | 239 | 3.34% | 3.34% | 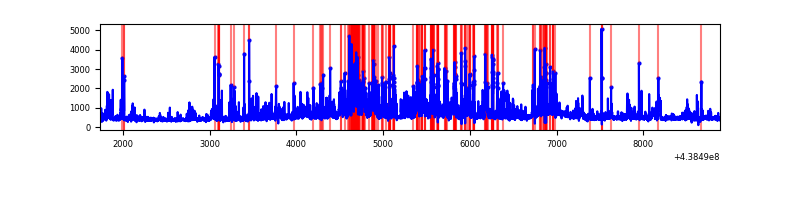 |
Top three noisy pixels from each quadrant. If the there are fewer than three noisy pixels in the level2.evt file, extra rows are filled as -1
| Pixel properties | Quadrant properties | ||||||
|---|---|---|---|---|---|---|---|
| Quadrant | DetID | PixID | Counts | Sigma | Mean | Median | Sigma |
| A | 15 | 223 | 9701210 | 77450.96 | 598 | 585 | 125.2 |
| A | 10 | 83 | 872717 | 6963.21 | 598 | 585 | 125.2 |
| A | 15 | 222 | 181286 | 1442.74 | 598 | 585 | 125.2 |
| B | 4 | 171 | 188896 | 1186.8 | 800 | 776 | 158.5 |
| B | 5 | 235 | 180325 | 1132.73 | 800 | 776 | 158.5 |
| B | 0 | 155 | 63239 | 394.06 | 800 | 776 | 158.5 |
| C | 14 | 254 | 86269 | 455.87 | 786 | 788 | 187.5 |
| C | 14 | 96 | 24960 | 128.91 | 786 | 788 | 187.5 |
| C | 13 | 61 | 5230 | 23.69 | 786 | 788 | 187.5 |
| D | 1 | 52 | 726002 | 3766.84 | 770 | 747 | 192.5 |
| D | 2 | 249 | 348653 | 1806.96 | 770 | 747 | 192.5 |
| D | 5 | 222 | 236792 | 1225.97 | 770 | 747 | 192.5 |
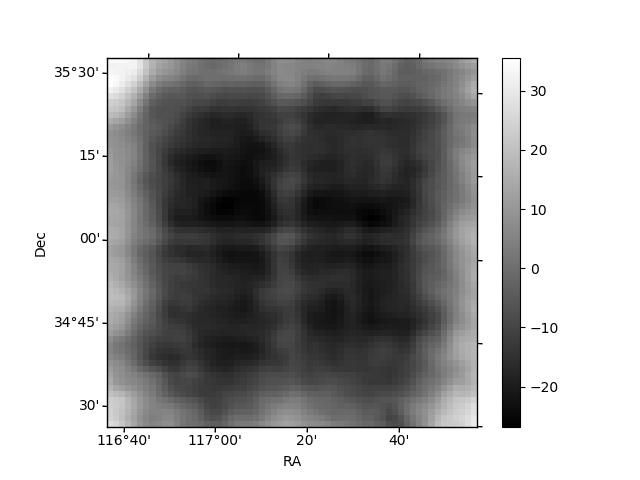
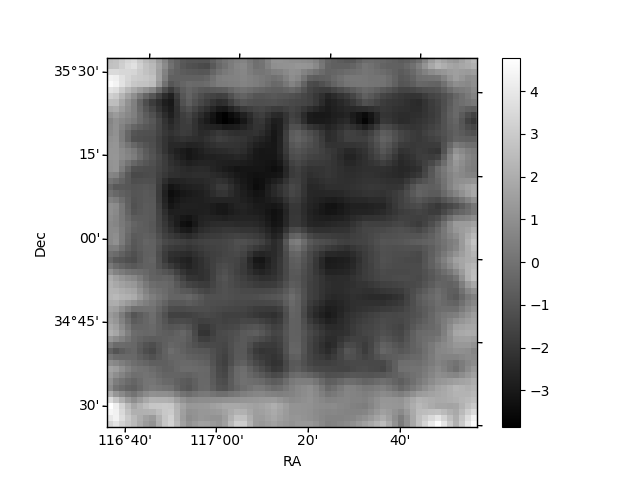
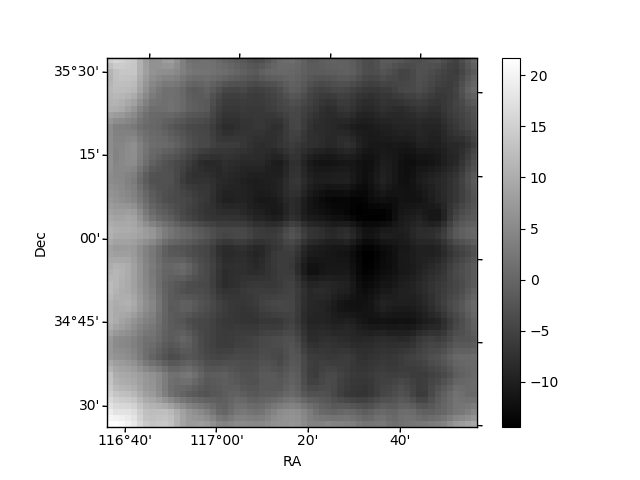
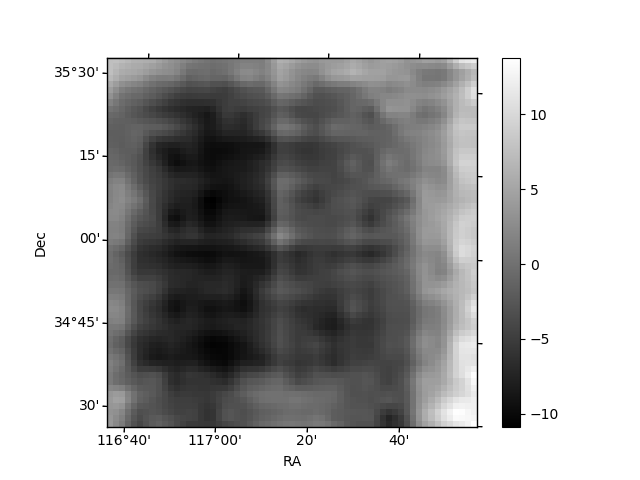
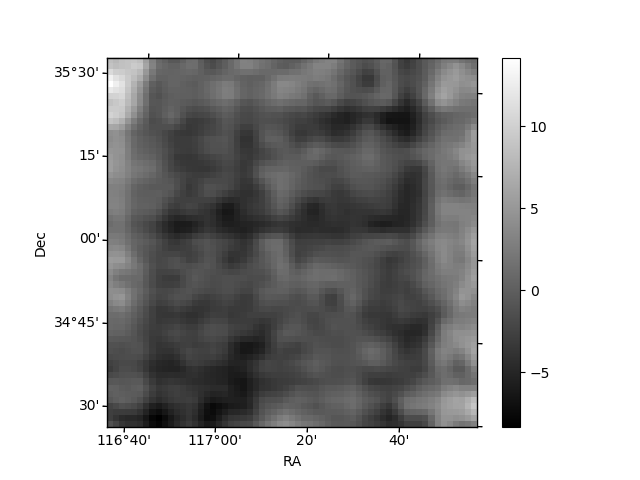
Histogram calculated using DETX and DETY for each event in the final _common_clean file
| Quadrant A | 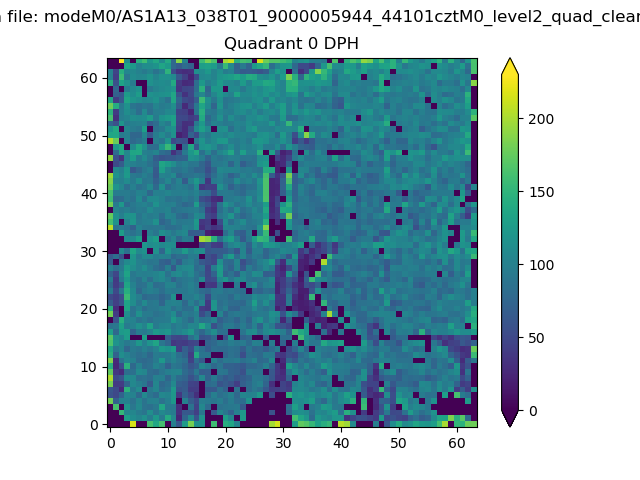 |
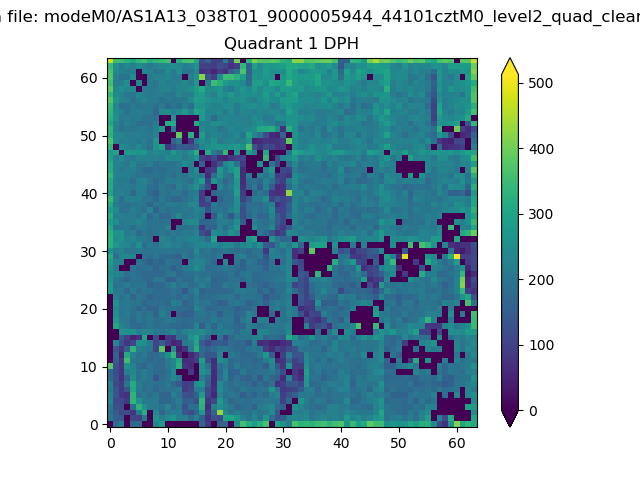 |
Quadrant B |
|---|---|---|---|
| Quadrant D | 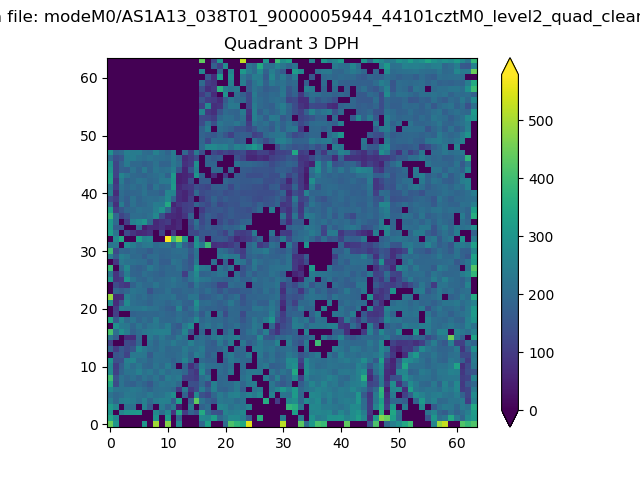 |
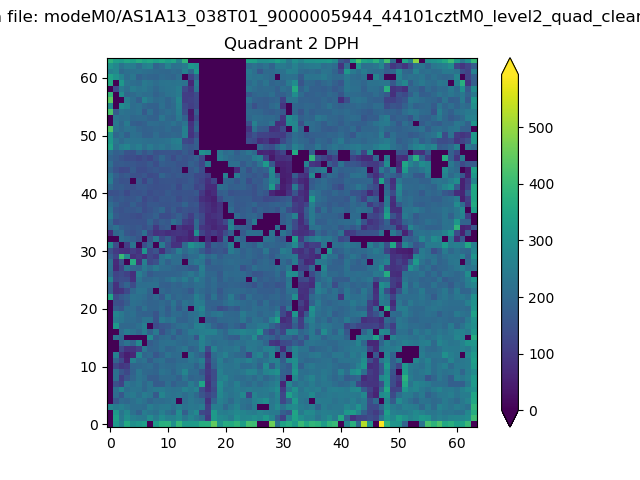 |
Quadrant C |
| Plot type | Count rate plots | Images |
|---|---|---|
| Comparison with Poisson distribution Blue bars denote a histogram of data divided into 1 sec bins. Red curve is a Poisson curve with rate = median count rate of data. |
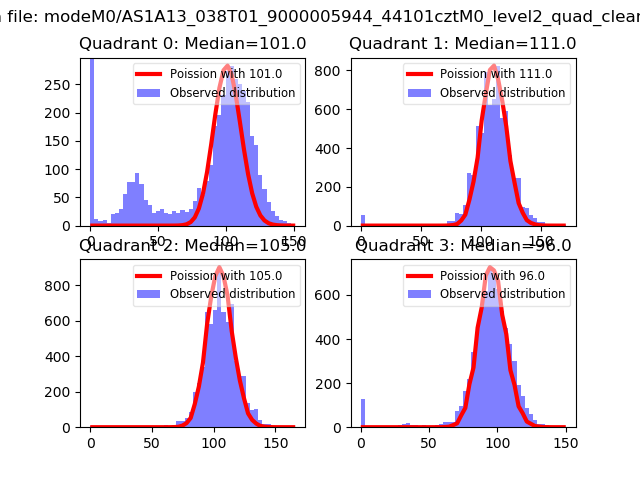 |
 |
| Quadrant-wise count rates Data is divided into 100 sec bins |
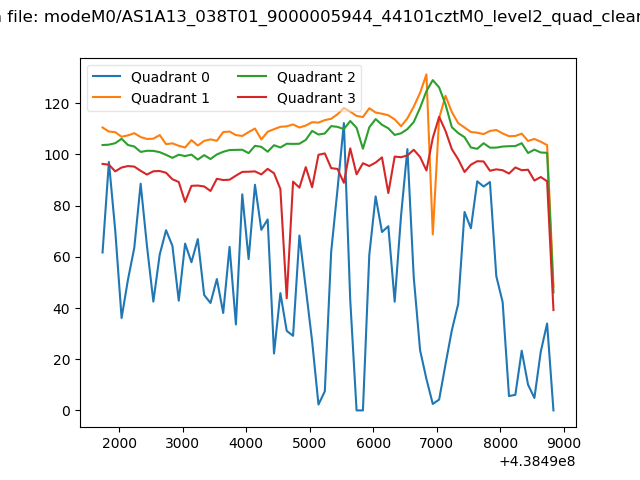 |
|
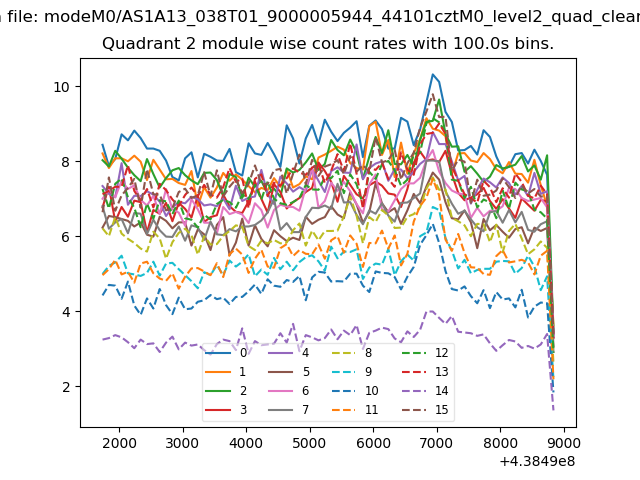
| Module-wise count rates for Quadrant A Data is divided into 100 sec bins |
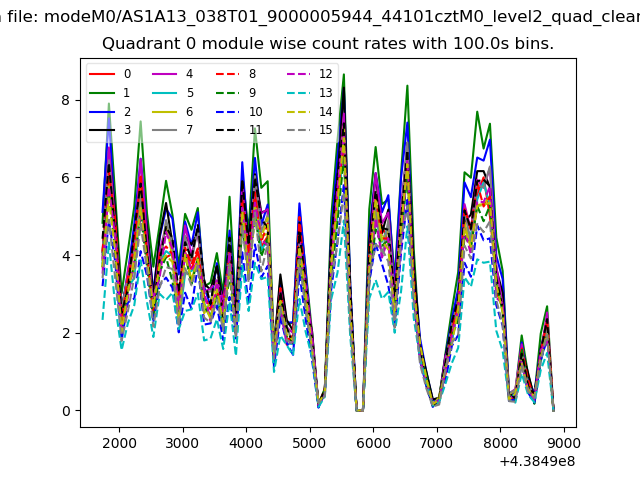 |
 |
| Module-wise count rates for Quadrant B Data is divided into 100 sec bins |
 |
 |
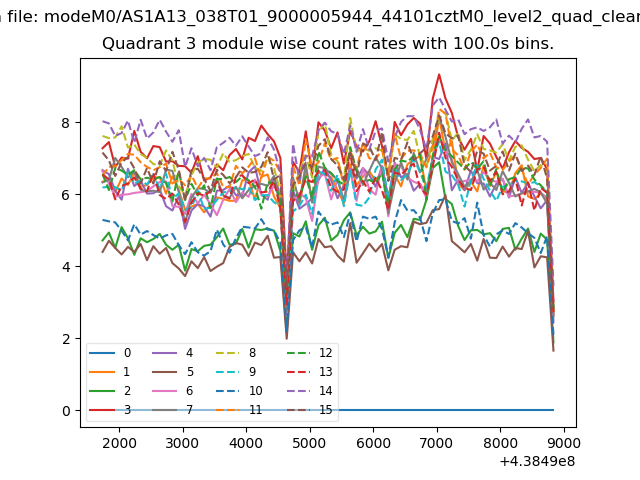
| Module-wise count rates for Quadrant C Data is divided into 100 sec bins |
 |
 |
| Module-wise count rates for Quadrant D Data is divided into 100 sec bins |
 |
 |
| Parameter | Plot |
|---|---|
| CZT HV Monitor |  |
| D_VDD | 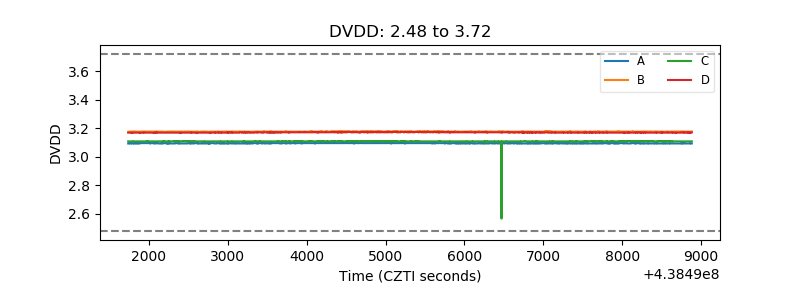 |
| Temperature 1 | 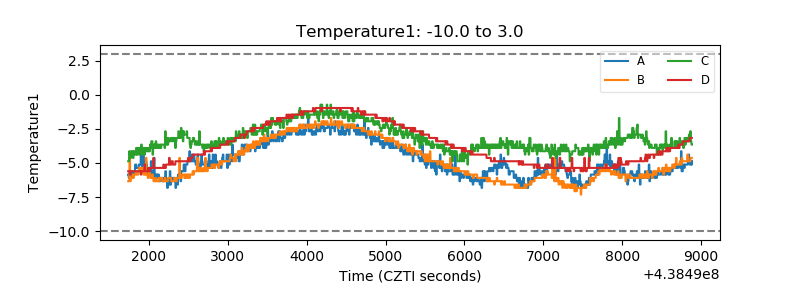 |
| Veto HV Monitor | 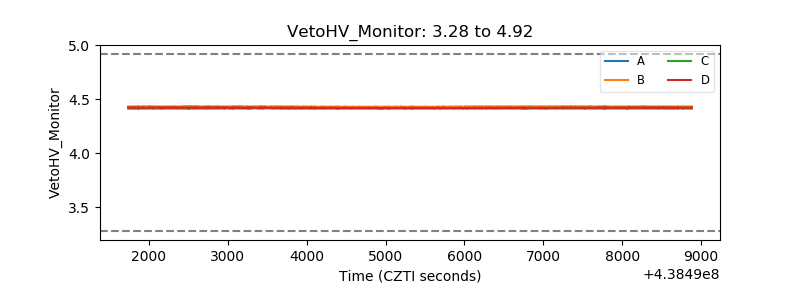 |
| Veto LLD | 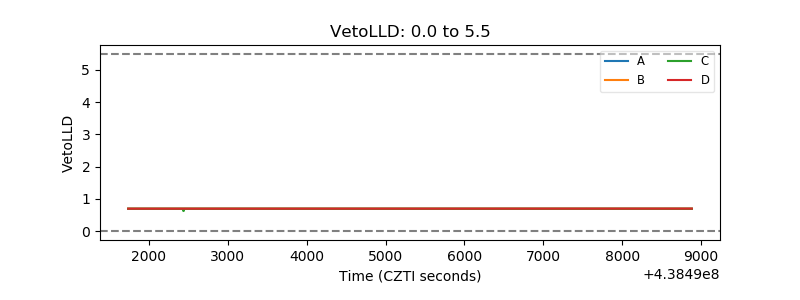 |
| Alpha Counter | 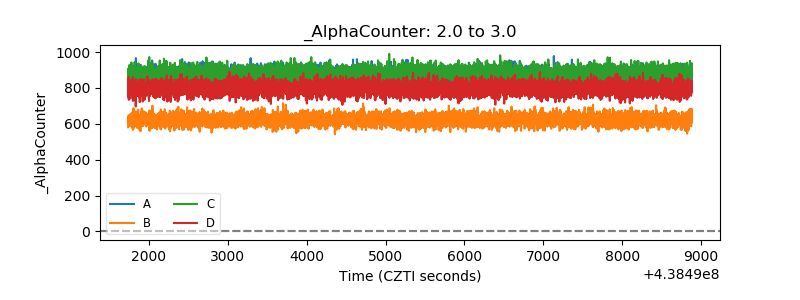 |
| _CPM_Rate | 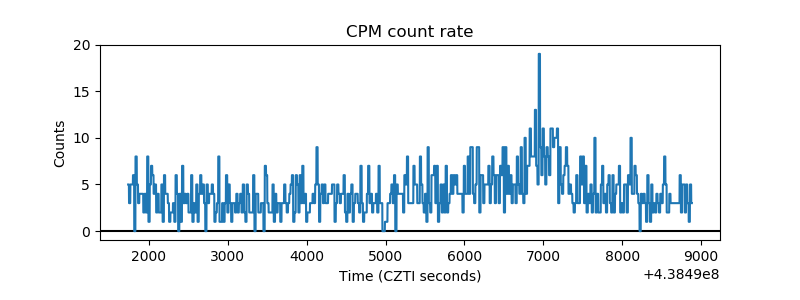 |
| CZT Counter | 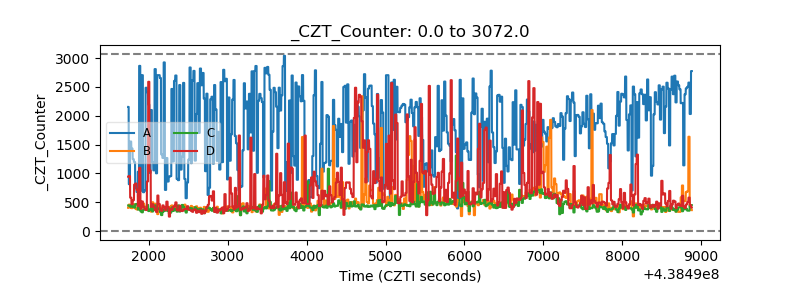 |
| +2.5 Volts monitor | 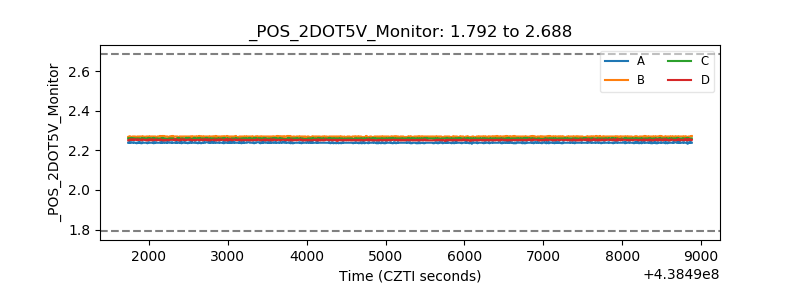 |
| +5 Volts monitor | 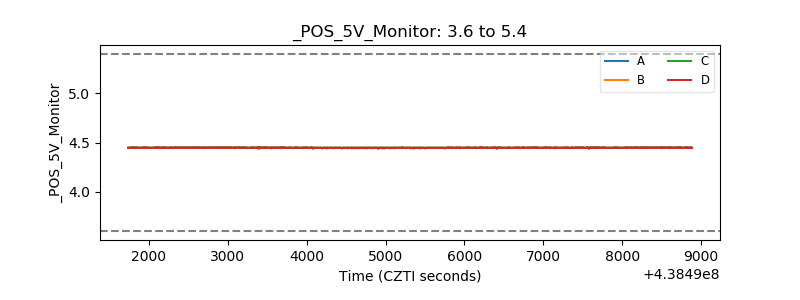 |
| _ROLL_ROT | 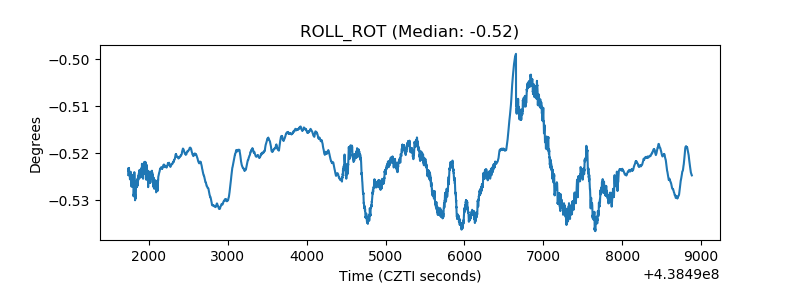 |
| _Roll_DEC | 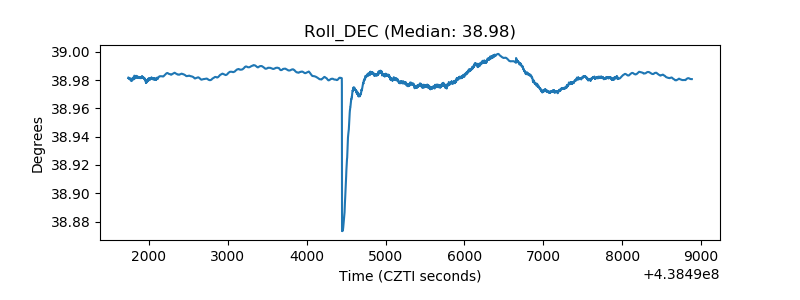 |
| _Roll_RA | 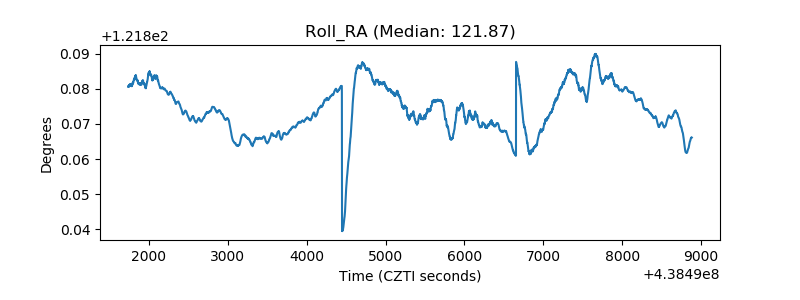 |
| Veto Counter | 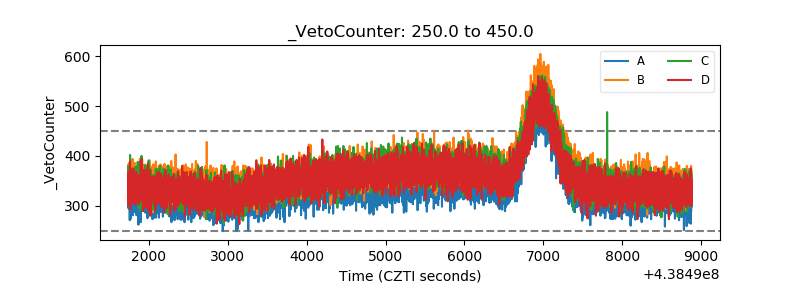 |