| Param | Original file | Final file |
|---|---|---|
| Filename | modeM0/AS1A13_012T02_9000005950_44121cztM0_level2.fits | modeM0/AS1A13_012T02_9000005950_44121cztM0_level2_quad_clean.evt |
| Size (bytes) | 450,213,120 | 101,773,440 |
| Size | 429.4 MB | 97.1 MB |
| Events in quadrant A | 5,481,442 | 634,784 |
| Events in quadrant B | 3,183,164 | 709,060 |
| Events in quadrant C | 3,354,218 | 673,150 |
| Events in quadrant D | 4,139,808 | 609,993 |
| Mode M9 | |||
|---|---|---|---|
| Quadrant | BADHDUFLAG | Total packets | Discarded packets |
| A | 0 | 8 | 0 |
| B | 0 | 8 | 0 |
| C | 0 | 8 | 0 |
| D | 0 | 8 | 0 |
| Mode SS | |||
|---|---|---|---|
| Quadrant | BADHDUFLAG | Total packets | Discarded packets |
| A | 0 | 132 | 0 |
| B | 0 | 132 | 0 |
| C | 0 | 132 | 0 |
| D | 0 | 132 | 0 |
| Mode M0 | |||
|---|---|---|---|
| Quadrant | BADHDUFLAG | Total packets | Discarded packets |
| A | 0 | 21372 | 1 |
| B | 0 | 13836 | 1 |
| C | 0 | 14573 | 2 |
| D | 0 | 16780 | 1 |
| Quadrant | Total seconds | Saturated seconds | Saturation percentage |
|---|---|---|---|
| A | 6516 | 665 | 10.205648% |
| B | 6517 | 122 | 1.872027% |
| C | 6516 | 167 | 2.562922% |
| D | 6516 | 258 | 3.959484% |
Noise dominated data is calculated using 1-second bins in cleaned event files. If a bin has >2000 counts, and if more than 50% of those come from <1% of pixels, then it is considered to be noise-dominated and hence unusable.
| Quadrant | # 1 sec bins | Bins with >0 counts | Bins with >2000 counts | High rate bins dominated by noise | Noise dominated (total time) | Noise dominated (detector-on time) | Marked lightcurve |
|---|---|---|---|---|---|---|---|
| A | 7341 | 6517 | 402 | 402 | 5.48% | 6.17% | 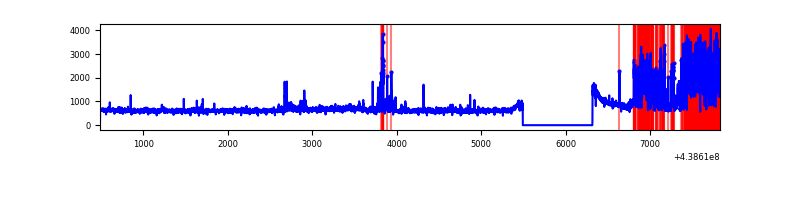 |
| B | 7342 | 6518 | 12 | 12 | 0.16% | 0.18% | 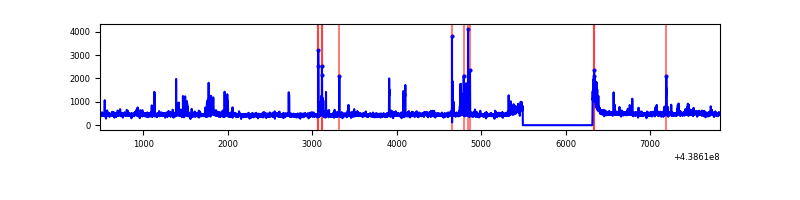 |
| C | 7341 | 6517 | 65 | 65 | 0.89% | 1.00% | 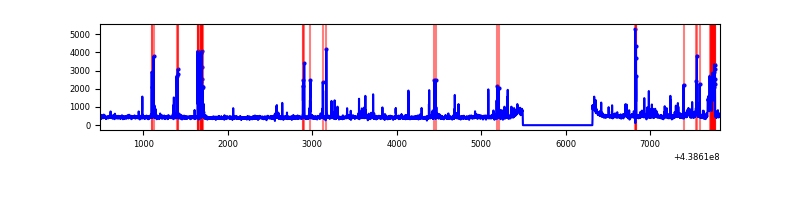 |
| D | 7341 | 6517 | 126 | 126 | 1.72% | 1.93% | 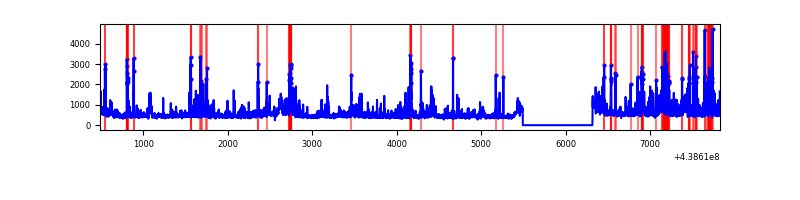 |
Top three noisy pixels from each quadrant. If the there are fewer than three noisy pixels in the level2.evt file, extra rows are filled as -1
| Pixel properties | Quadrant properties | ||||||
|---|---|---|---|---|---|---|---|
| Quadrant | DetID | PixID | Counts | Sigma | Mean | Median | Sigma |
| A | 15 | 223 | 1423382 | 9574.99 | 714 | 698 | 148.6 |
| A | 10 | 83 | 1180172 | 7938.13 | 714 | 698 | 148.6 |
| A | 7 | 3 | 42015 | 278.07 | 714 | 698 | 148.6 |
| B | 5 | 172 | 112087 | 765.44 | 734 | 711 | 145.5 |
| B | 5 | 235 | 67081 | 456.13 | 734 | 711 | 145.5 |
| B | 0 | 213 | 34896 | 234.94 | 734 | 711 | 145.5 |
| C | 14 | 254 | 266187 | 1555.39 | 723 | 728 | 170.7 |
| C | 1 | 241 | 131756 | 767.72 | 723 | 728 | 170.7 |
| C | 0 | 207 | 109129 | 635.15 | 723 | 728 | 170.7 |
| D | 5 | 235 | 327447 | 1797.84 | 721 | 697 | 181.7 |
| D | 1 | 52 | 245588 | 1347.44 | 721 | 697 | 181.7 |
| D | 2 | 249 | 233247 | 1279.53 | 721 | 697 | 181.7 |
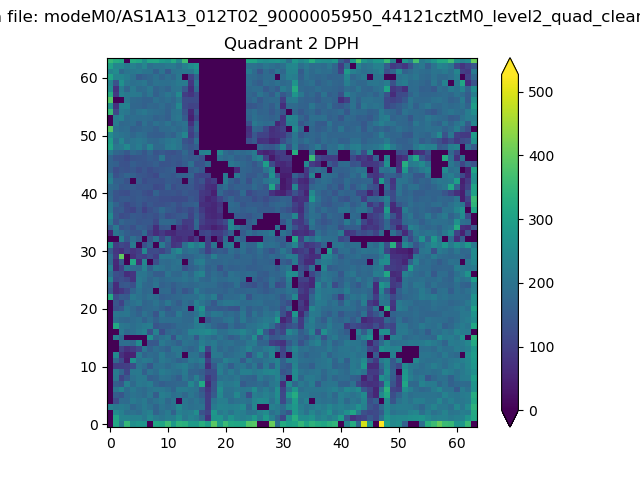
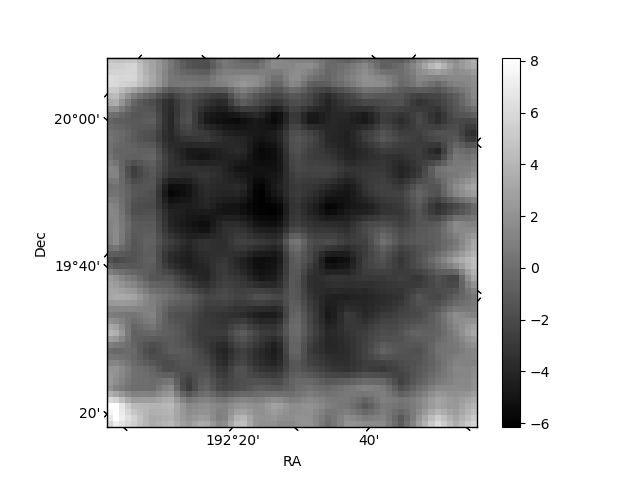
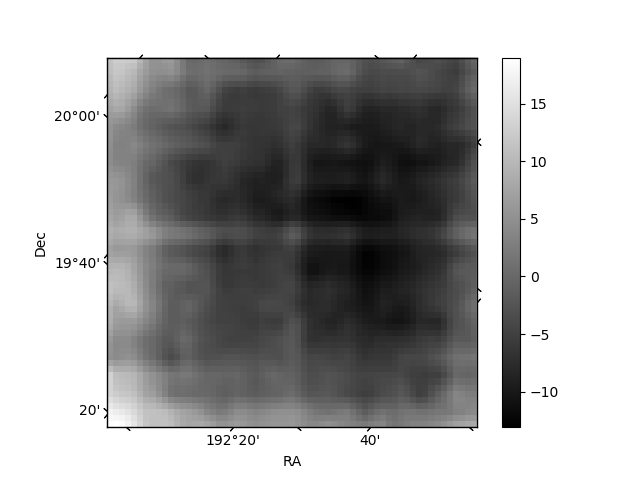
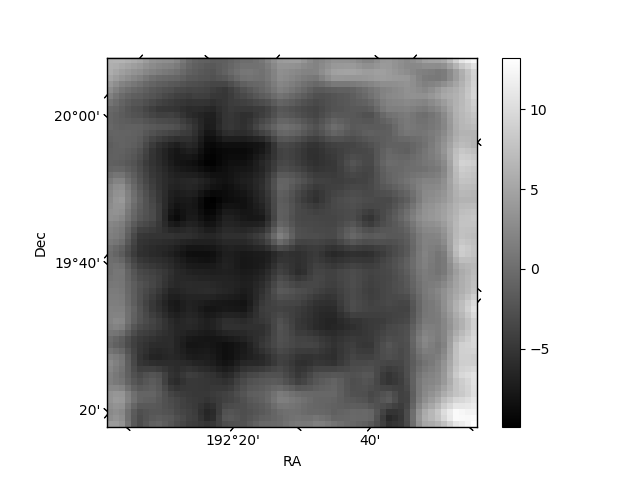
Histogram calculated using DETX and DETY for each event in the final _common_clean file
| Quadrant A | 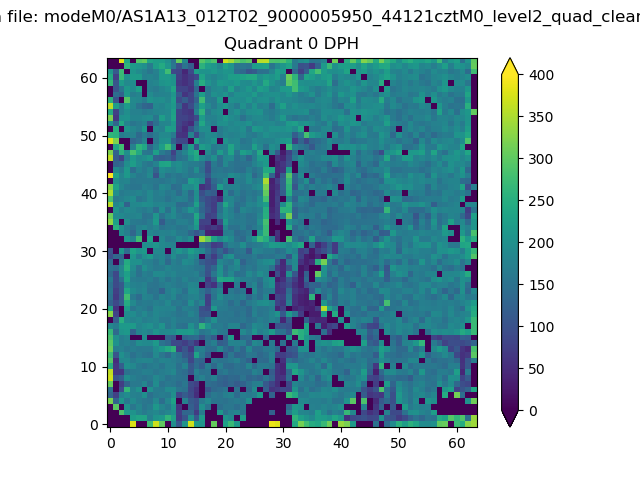 |
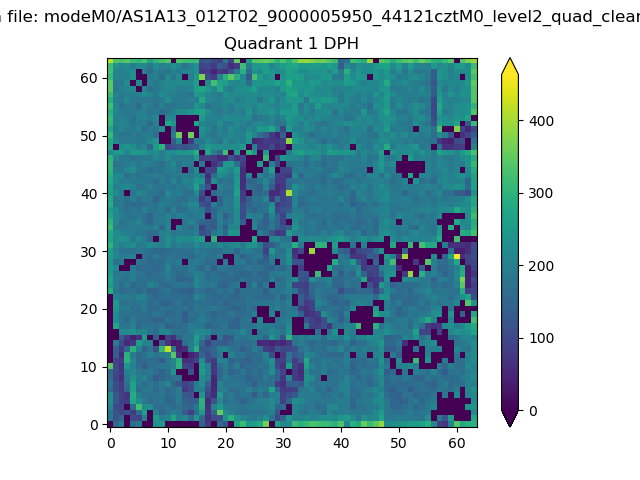 |
Quadrant B |
|---|---|---|---|
| Quadrant D | 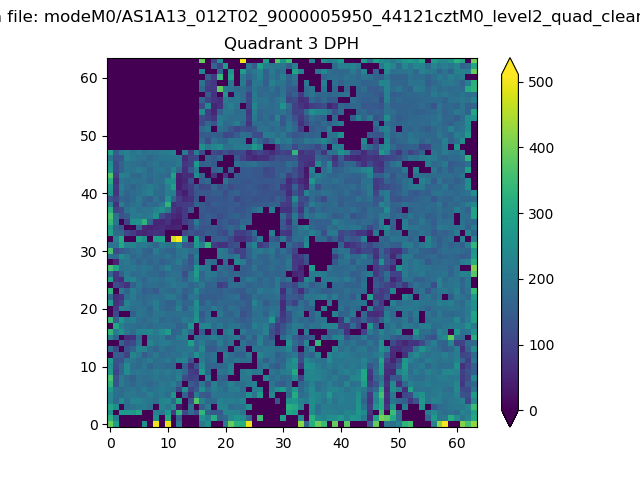 |
 |
Quadrant C |
| Plot type | Count rate plots | Images |
|---|---|---|
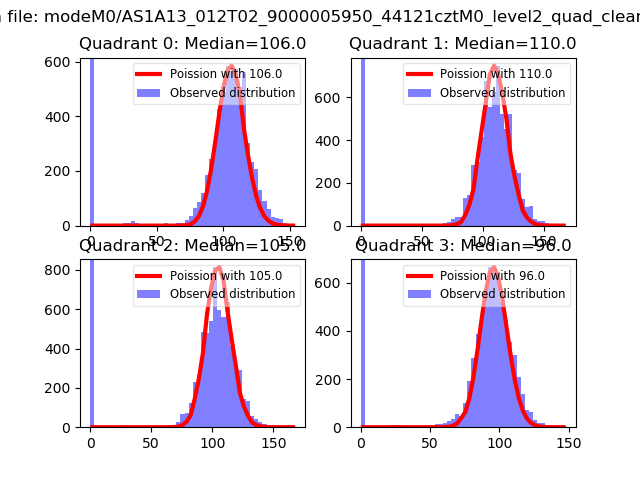
| Comparison with Poisson distribution Blue bars denote a histogram of data divided into 1 sec bins. Red curve is a Poisson curve with rate = median count rate of data. |
 |
 |
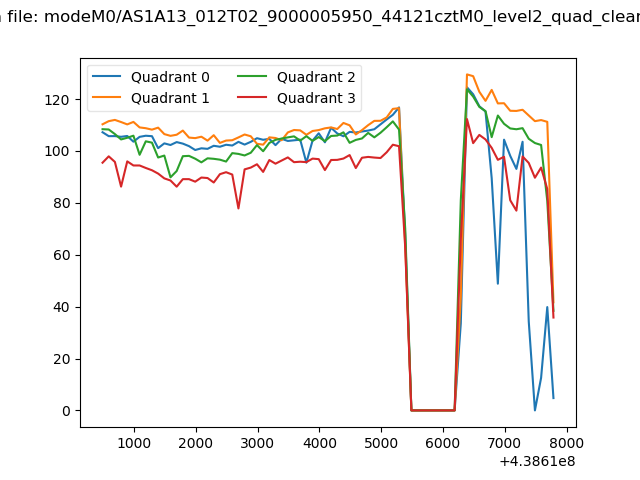
| Quadrant-wise count rates Data is divided into 100 sec bins |
 |
|
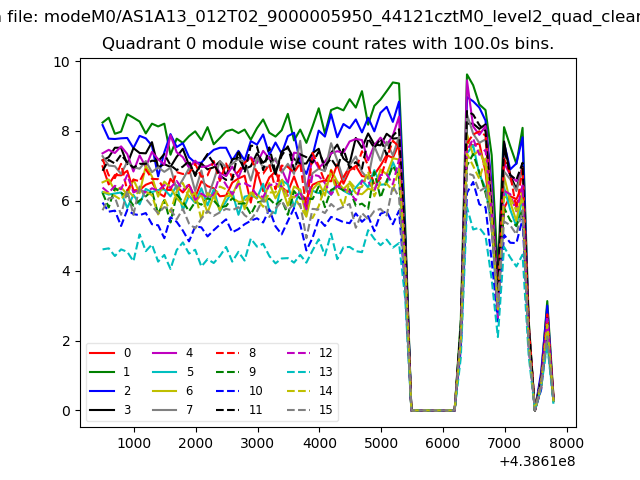
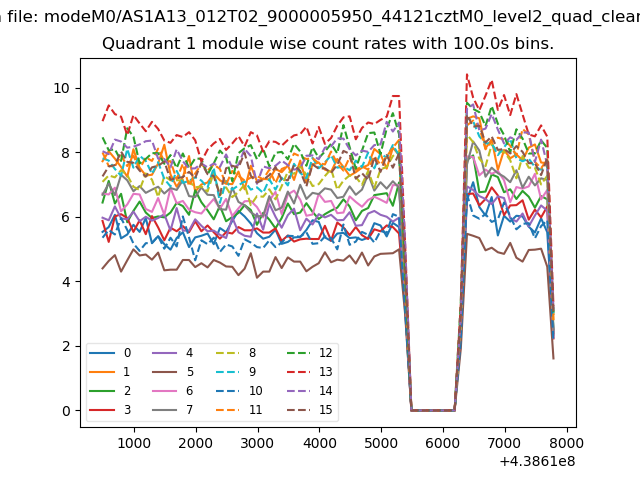
| Module-wise count rates for Quadrant A Data is divided into 100 sec bins |
 |
 |
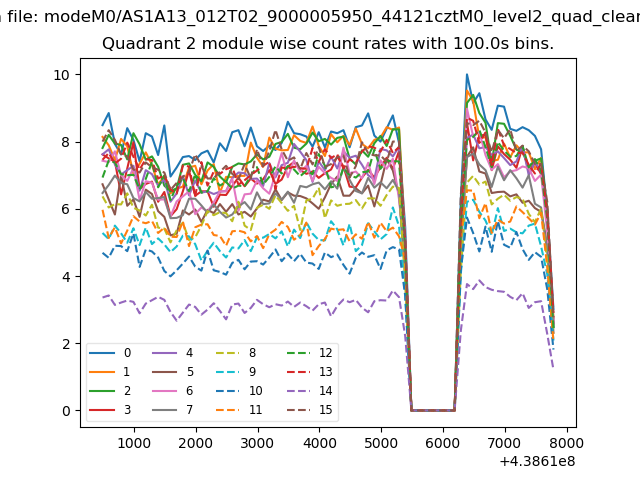
| Module-wise count rates for Quadrant B Data is divided into 100 sec bins |
 |
 |
| Module-wise count rates for Quadrant C Data is divided into 100 sec bins |
 |
 |
| Module-wise count rates for Quadrant D Data is divided into 100 sec bins |
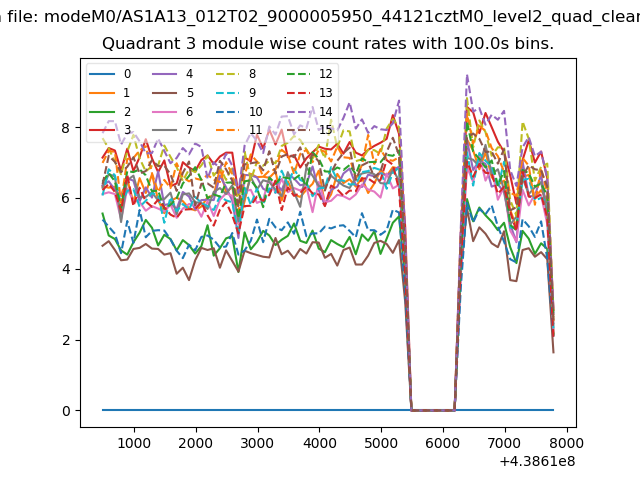 |
 |
| Parameter | Plot |
|---|---|
| CZT HV Monitor |  |
| D_VDD | 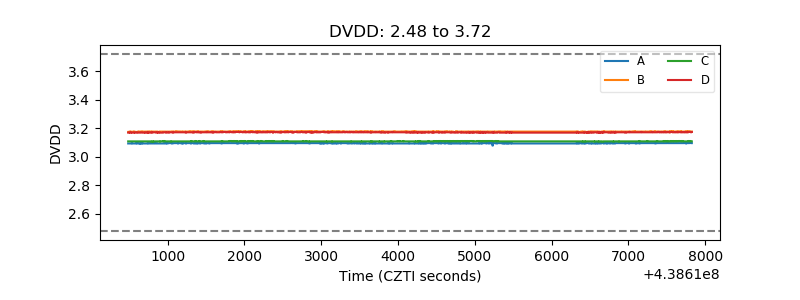 |
| Temperature 1 | 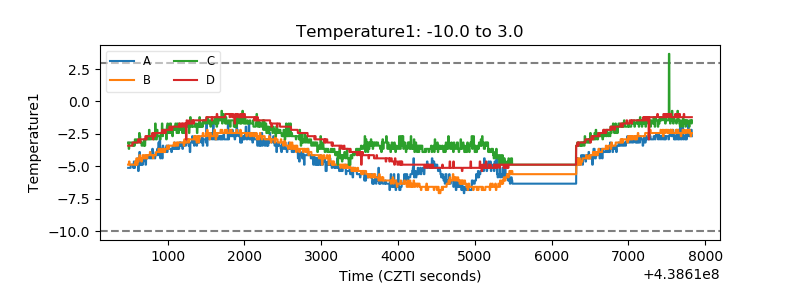 |
| Veto HV Monitor | 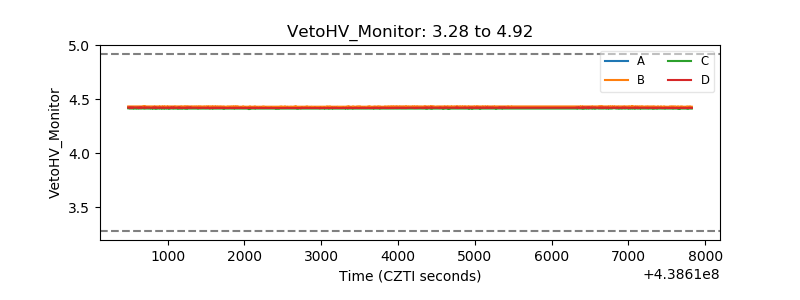 |
| Veto LLD | 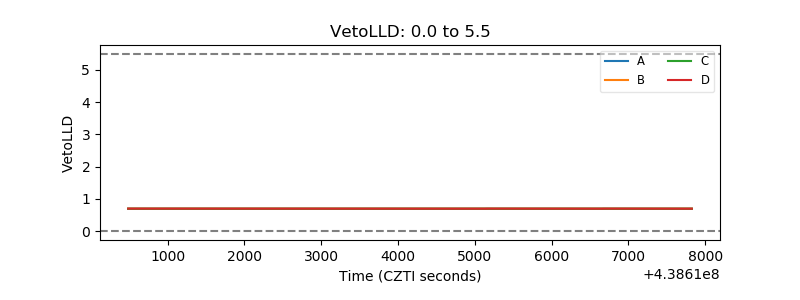 |
| Alpha Counter | 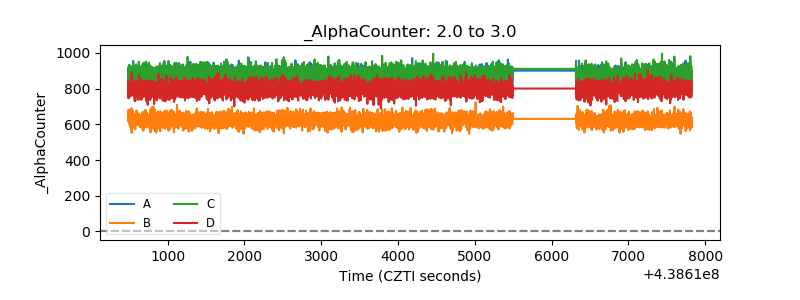 |
| _CPM_Rate | 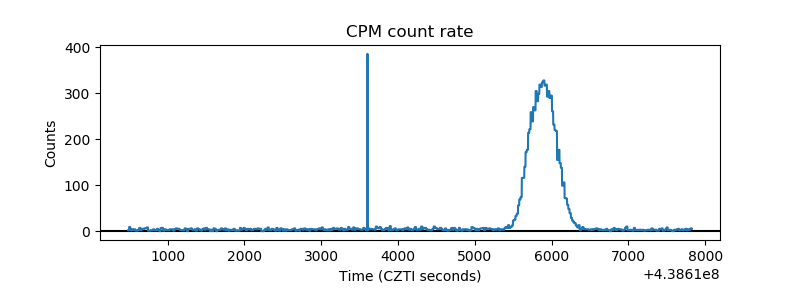 |
| CZT Counter | 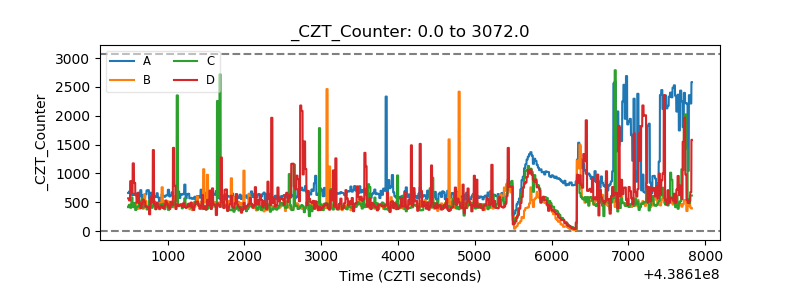 |
| +2.5 Volts monitor | 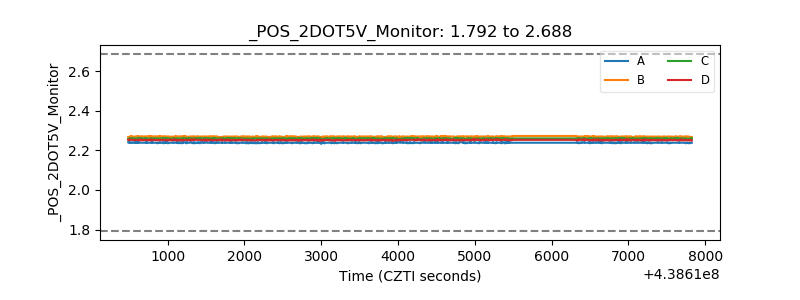 |
| +5 Volts monitor |  |
| _ROLL_ROT | 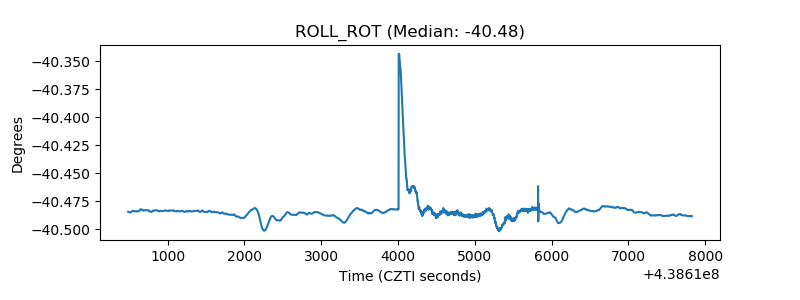 |
| _Roll_DEC | 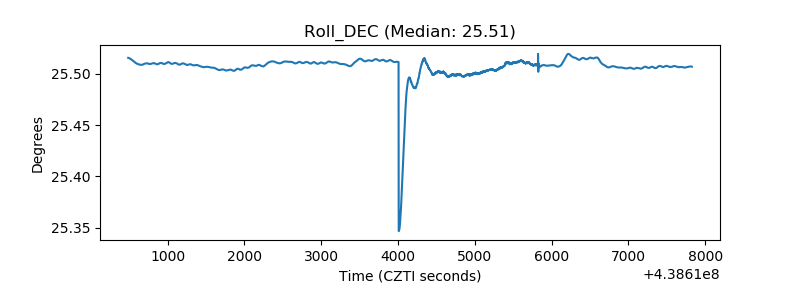 |
| _Roll_RA | 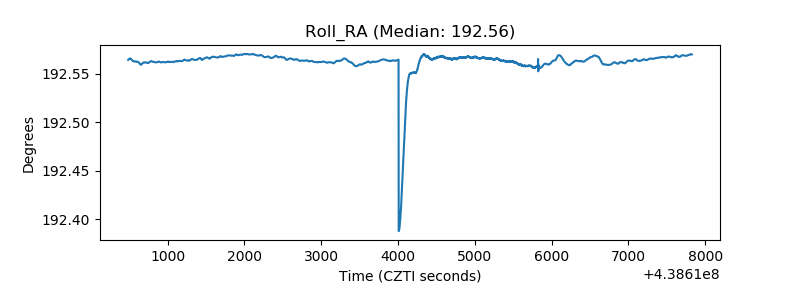 |
| Veto Counter |  |