| Param | Original file | Final file |
|---|---|---|
| Filename | modeM0/AS1A13_012T02_9000005950_44123cztM0_level2.fits | modeM0/AS1A13_012T02_9000005950_44123cztM0_level2_quad_clean.evt |
| Size (bytes) | 585,691,200 | 94,106,880 |
| Size | 558.6 MB | 89.7 MB |
| Events in quadrant A | 8,611,007 | 508,606 |
| Events in quadrant B | 3,056,394 | 700,178 |
| Events in quadrant C | 3,481,783 | 659,078 |
| Events in quadrant D | 6,055,018 | 552,496 |
| Mode M9 | |||
|---|---|---|---|
| Quadrant | BADHDUFLAG | Total packets | Discarded packets |
| A | 0 | 10 | 0 |
| B | 0 | 10 | 0 |
| C | 0 | 10 | 0 |
| D | 0 | 10 | 0 |
| Mode SS | |||
|---|---|---|---|
| Quadrant | BADHDUFLAG | Total packets | Discarded packets |
| A | 0 | 126 | 0 |
| B | 0 | 126 | 0 |
| C | 0 | 126 | 0 |
| D | 0 | 126 | 0 |
| Mode M0 | |||
|---|---|---|---|
| Quadrant | BADHDUFLAG | Total packets | Discarded packets |
| A | 0 | 30006 | 1 |
| B | 0 | 13135 | 1 |
| C | 0 | 14423 | 1 |
| D | 0 | 22249 | 1 |
| Quadrant | Total seconds | Saturated seconds | Saturation percentage |
|---|---|---|---|
| A | 6139 | 1837 | 29.923440% |
| B | 6139 | 94 | 1.531194% |
| C | 6140 | 175 | 2.850163% |
| D | 6140 | 756 | 12.312704% |
Noise dominated data is calculated using 1-second bins in cleaned event files. If a bin has >2000 counts, and if more than 50% of those come from <1% of pixels, then it is considered to be noise-dominated and hence unusable.
| Quadrant | # 1 sec bins | Bins with >0 counts | Bins with >2000 counts | High rate bins dominated by noise | Noise dominated (total time) | Noise dominated (detector-on time) | Marked lightcurve |
|---|---|---|---|---|---|---|---|
| A | 7129 | 6140 | 1237 | 1237 | 17.35% | 20.15% | 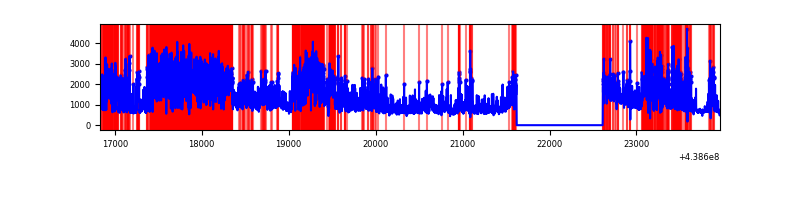 |
| B | 7129 | 6140 | 9 | 9 | 0.13% | 0.15% | 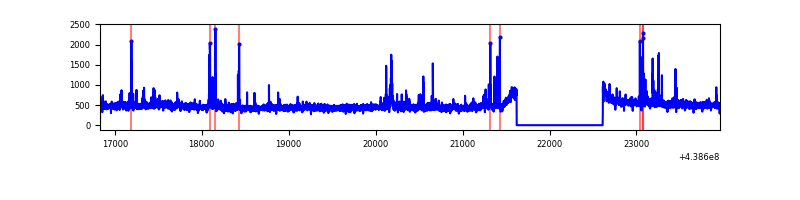 |
| C | 7130 | 6141 | 86 | 86 | 1.21% | 1.40% | 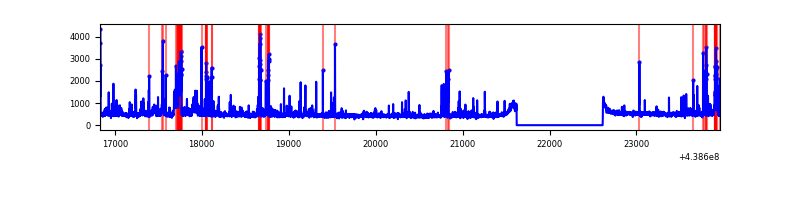 |
| D | 7130 | 6141 | 585 | 585 | 8.20% | 9.53% | 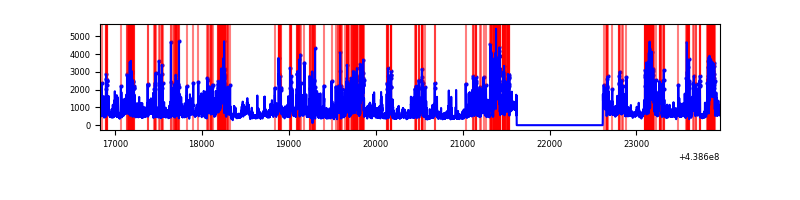 |
Top three noisy pixels from each quadrant. If the there are fewer than three noisy pixels in the level2.evt file, extra rows are filled as -1
| Pixel properties | Quadrant properties | ||||||
|---|---|---|---|---|---|---|---|
| Quadrant | DetID | PixID | Counts | Sigma | Mean | Median | Sigma |
| A | 15 | 223 | 4999034 | 38317.26 | 631 | 618 | 130.4 |
| A | 10 | 83 | 1091547 | 8362.93 | 631 | 618 | 130.4 |
| A | 12 | 227 | 30241 | 227.09 | 631 | 618 | 130.4 |
| B | 5 | 172 | 107850 | 764.41 | 710 | 689 | 140.2 |
| B | 5 | 235 | 47227 | 331.97 | 710 | 689 | 140.2 |
| B | 4 | 173 | 37449 | 262.22 | 710 | 689 | 140.2 |
| C | 1 | 241 | 323338 | 1950.62 | 699 | 704 | 165.4 |
| C | 14 | 254 | 213501 | 1286.55 | 699 | 704 | 165.4 |
| C | 0 | 207 | 113615 | 682.65 | 699 | 704 | 165.4 |
| D | 1 | 52 | 1994721 | 11792.64 | 668 | 649 | 169.1 |
| D | 5 | 235 | 638552 | 3772.46 | 668 | 649 | 169.1 |
| D | 2 | 249 | 227008 | 1338.65 | 668 | 649 | 169.1 |
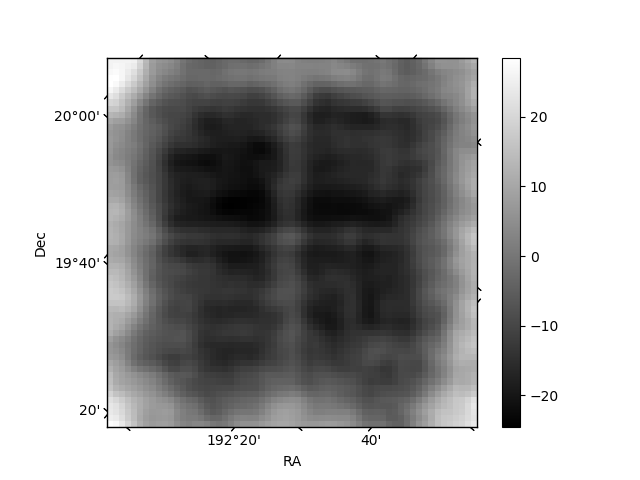
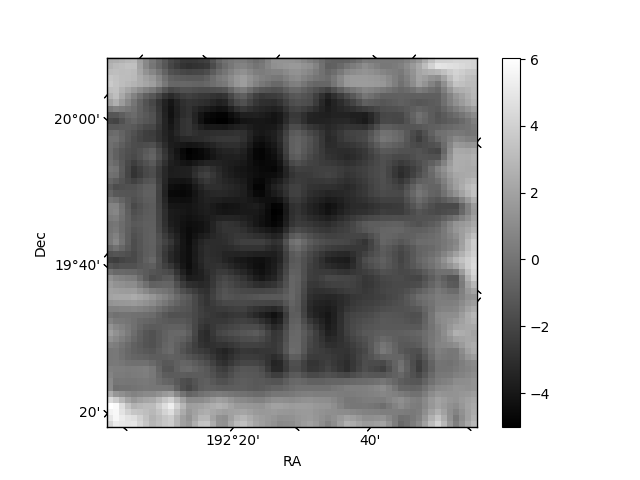
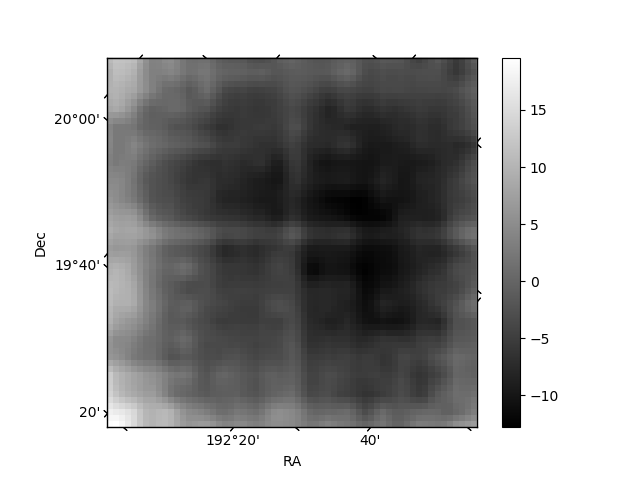
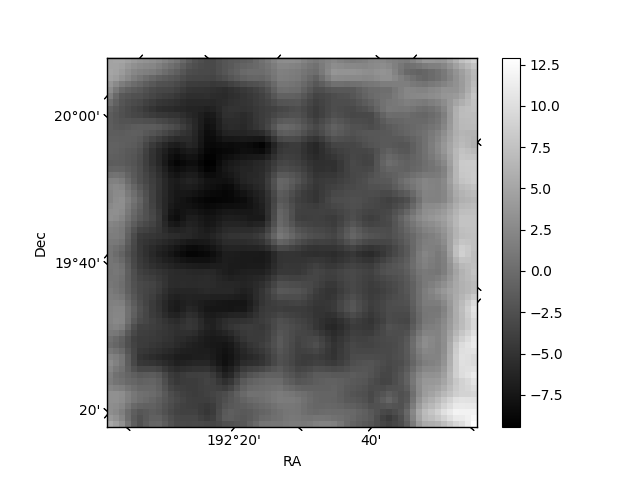
Histogram calculated using DETX and DETY for each event in the final _common_clean file
| Quadrant A | 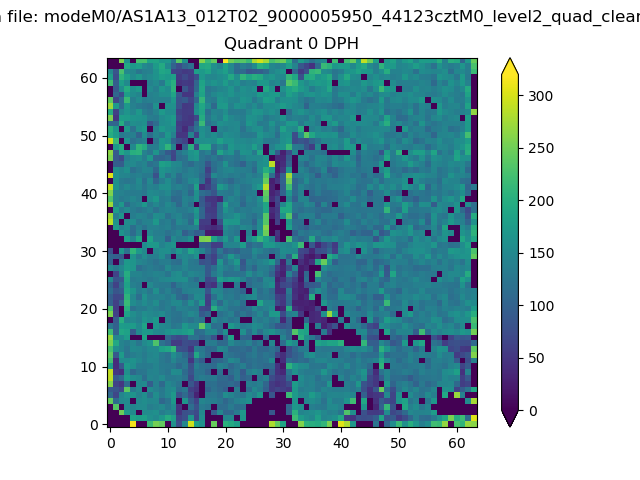 |
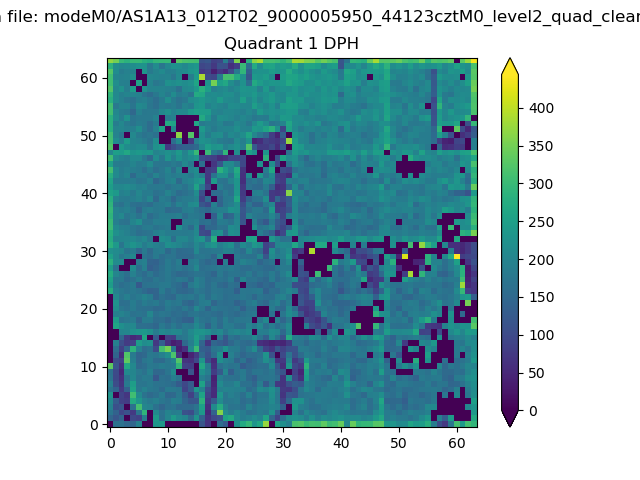 |
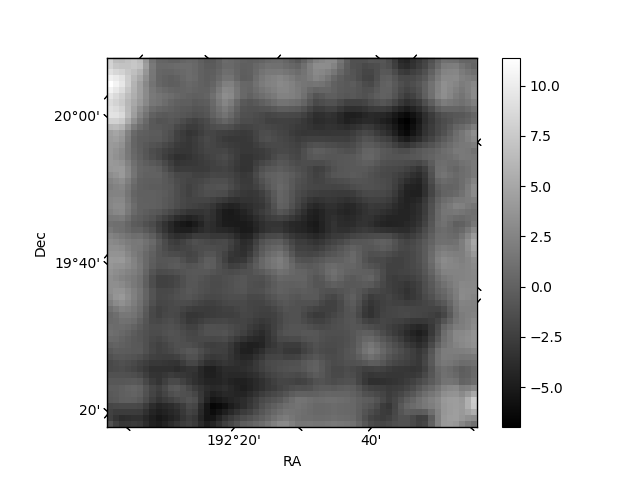
Quadrant B |
|---|---|---|---|
| Quadrant D | 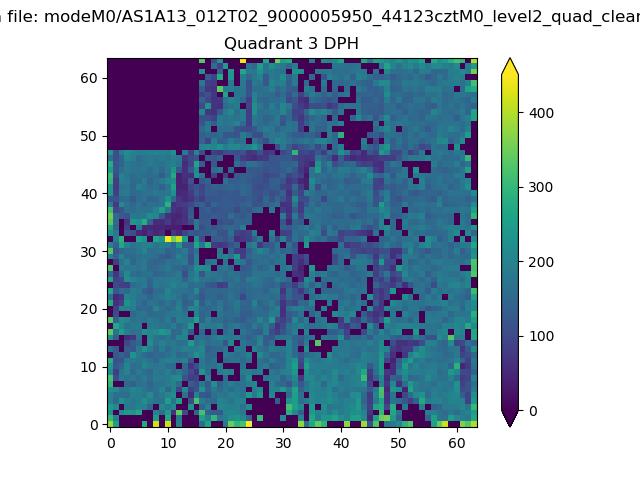 |
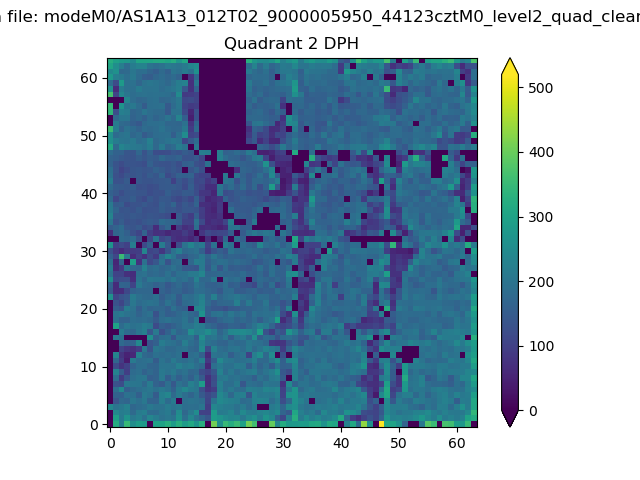 |
Quadrant C |
| Plot type | Count rate plots | Images |
|---|---|---|
| Comparison with Poisson distribution Blue bars denote a histogram of data divided into 1 sec bins. Red curve is a Poisson curve with rate = median count rate of data. |
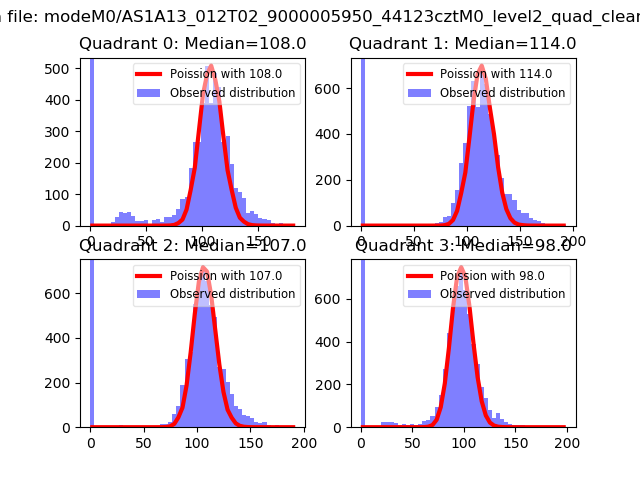 |
 |
| Quadrant-wise count rates Data is divided into 100 sec bins |
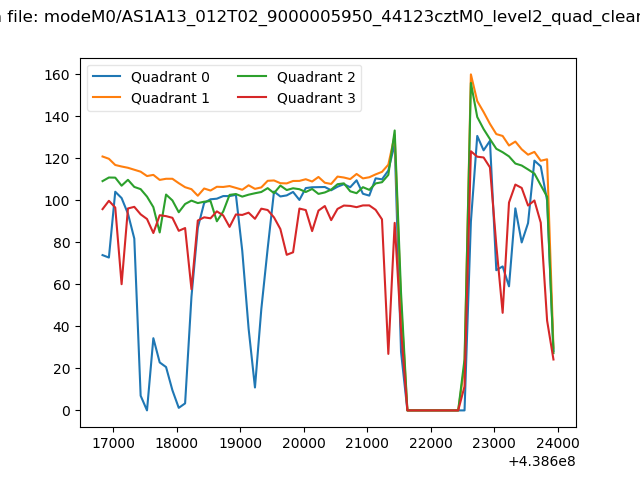 |
|
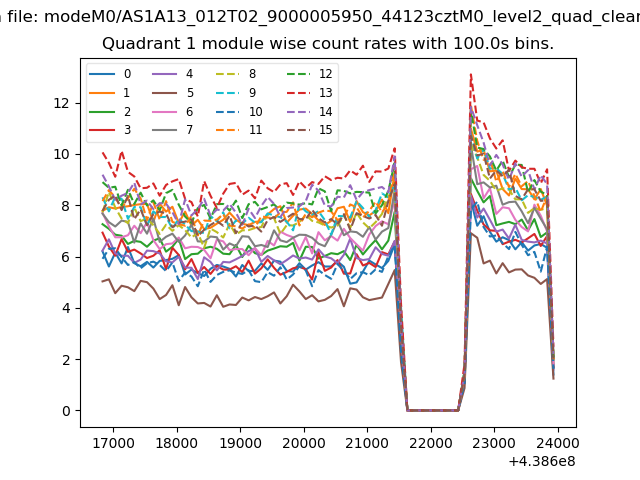
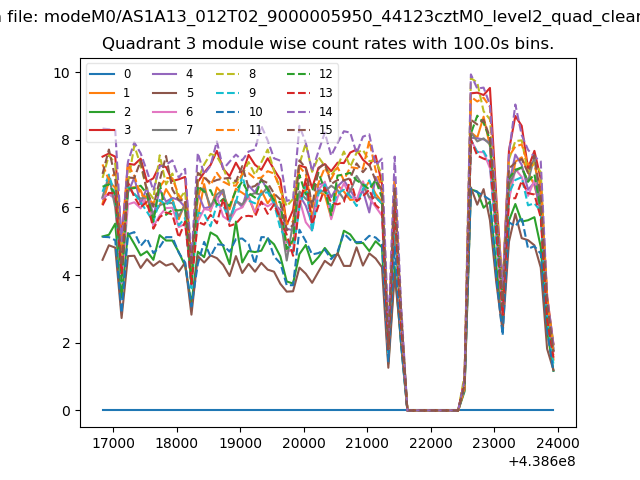
| Module-wise count rates for Quadrant A Data is divided into 100 sec bins |
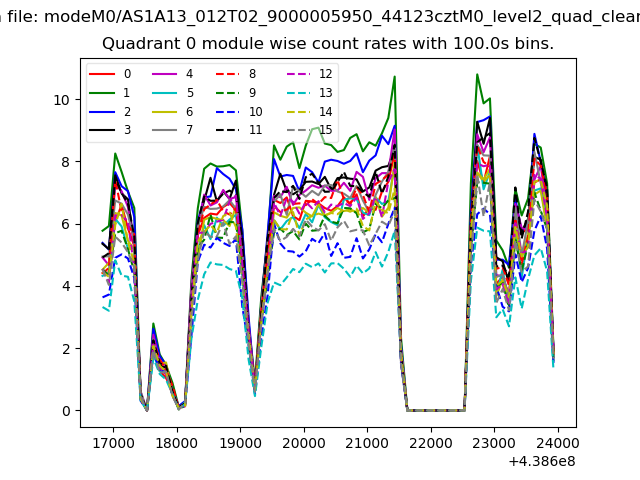 |
 |
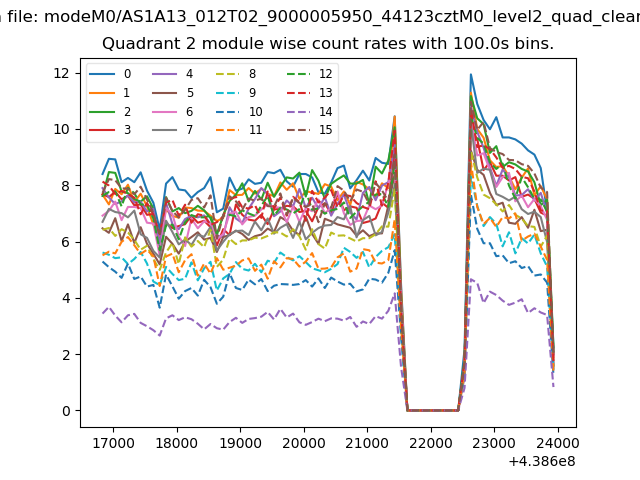
| Module-wise count rates for Quadrant B Data is divided into 100 sec bins |
 |
 |
| Module-wise count rates for Quadrant C Data is divided into 100 sec bins |
 |
 |
| Module-wise count rates for Quadrant D Data is divided into 100 sec bins |
 |
 |
| Parameter | Plot |
|---|---|
| CZT HV Monitor | 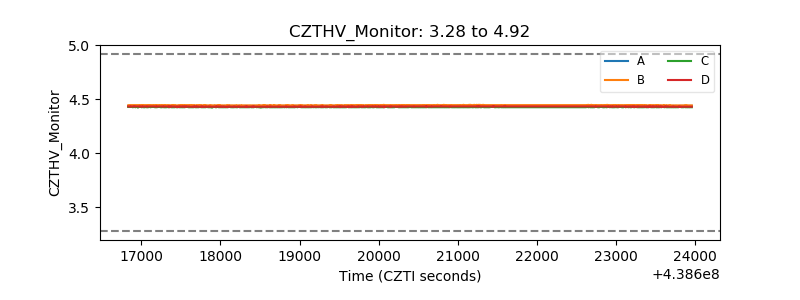 |
| D_VDD | 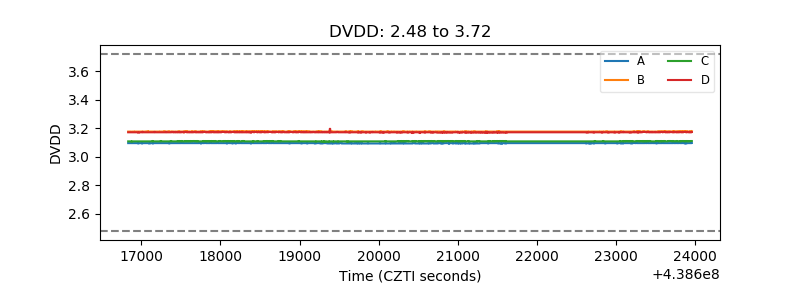 |
| Temperature 1 | 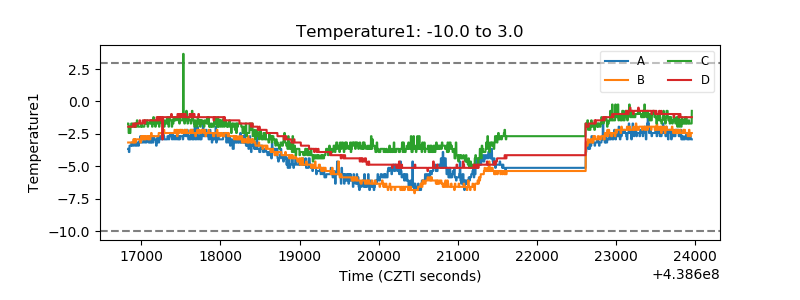 |
| Veto HV Monitor | 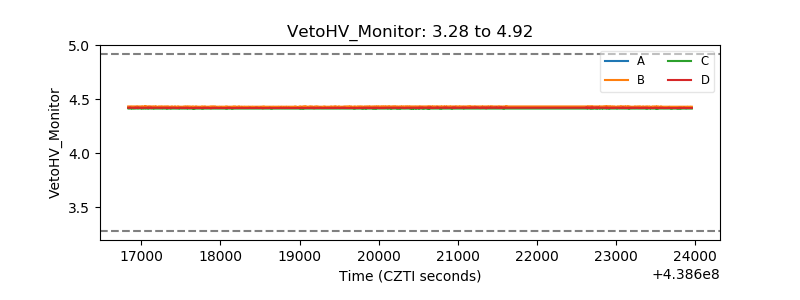 |
| Veto LLD | 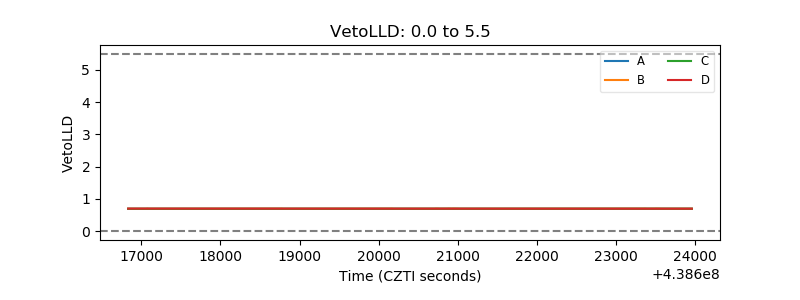 |
| Alpha Counter | 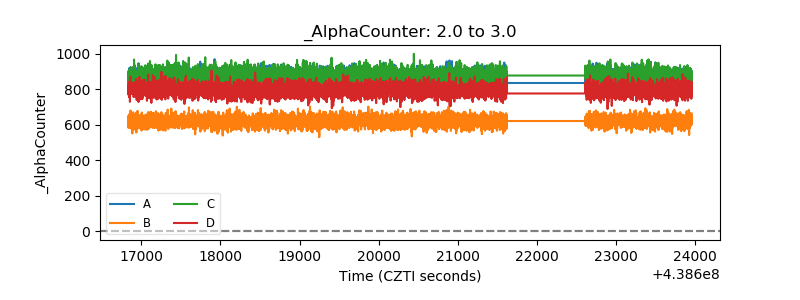 |
| _CPM_Rate | 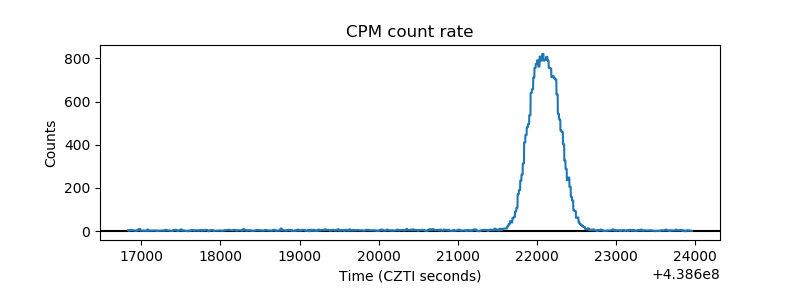 |
| CZT Counter | 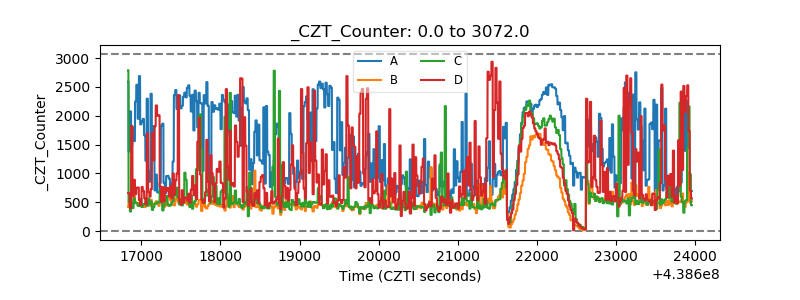 |
| +2.5 Volts monitor | 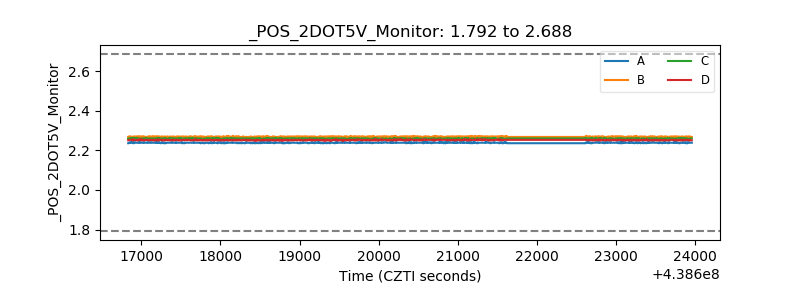 |
| +5 Volts monitor | 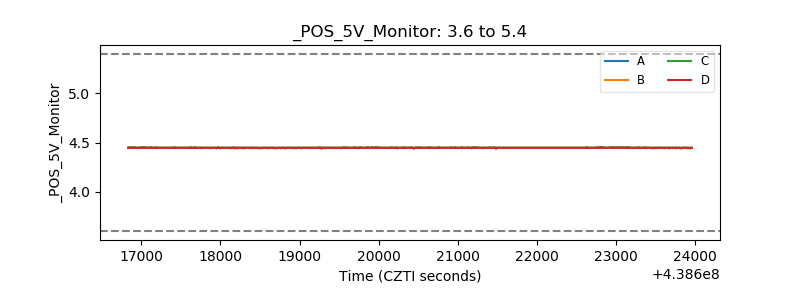 |
| _ROLL_ROT | 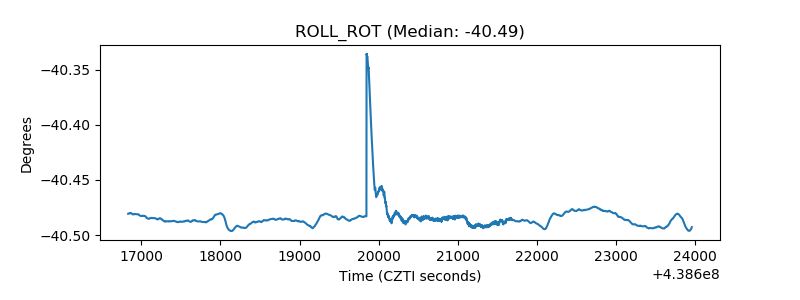 |
| _Roll_DEC | 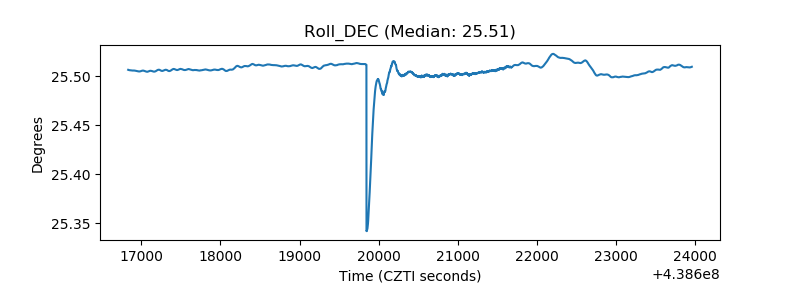 |
| _Roll_RA | 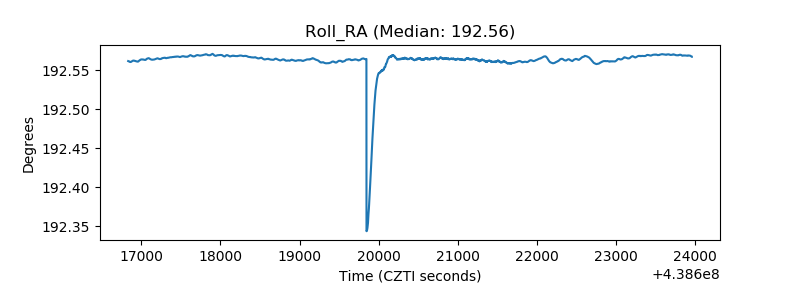 |
| Veto Counter | 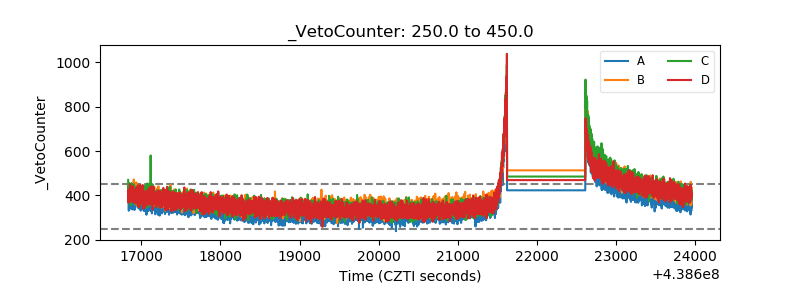 |