| Param | Original file | Final file |
|---|---|---|
| Filename | modeM0/AS1A13_012T02_9000005950_44124cztM0_level2.fits | modeM0/AS1A13_012T02_9000005950_44124cztM0_level2_quad_clean.evt |
| Size (bytes) | 605,810,880 | 98,375,040 |
| Size | 577.7 MB | 93.8 MB |
| Events in quadrant A | 8,845,924 | 473,894 |
| Events in quadrant B | 3,198,297 | 761,813 |
| Events in quadrant C | 3,361,750 | 719,813 |
| Events in quadrant D | 6,529,266 | 582,692 |
| Mode M9 | |||
|---|---|---|---|
| Quadrant | BADHDUFLAG | Total packets | Discarded packets |
| A | 0 | 12 | 0 |
| B | 0 | 12 | 0 |
| C | 0 | 12 | 0 |
| D | 0 | 12 | 0 |
| Mode SS | |||
|---|---|---|---|
| Quadrant | BADHDUFLAG | Total packets | Discarded packets |
| A | 0 | 128 | 0 |
| B | 0 | 128 | 0 |
| C | 0 | 128 | 0 |
| D | 0 | 128 | 0 |
| Mode M0 | |||
|---|---|---|---|
| Quadrant | BADHDUFLAG | Total packets | Discarded packets |
| A | 0 | 30856 | 5 |
| B | 0 | 13671 | 1 |
| C | 0 | 14164 | 1 |
| D | 0 | 23762 | 1 |
| Quadrant | Total seconds | Saturated seconds | Saturation percentage |
|---|---|---|---|
| A | 6308 | 2327 | 36.889664% |
| B | 6309 | 73 | 1.157077% |
| C | 6309 | 134 | 2.123950% |
| D | 6309 | 939 | 14.883500% |
Noise dominated data is calculated using 1-second bins in cleaned event files. If a bin has >2000 counts, and if more than 50% of those come from <1% of pixels, then it is considered to be noise-dominated and hence unusable.
| Quadrant | # 1 sec bins | Bins with >0 counts | Bins with >2000 counts | High rate bins dominated by noise | Noise dominated (total time) | Noise dominated (detector-on time) | Marked lightcurve |
|---|---|---|---|---|---|---|---|
| A | 7448 | 6308 | 1637 | 1637 | 21.98% | 25.95% | 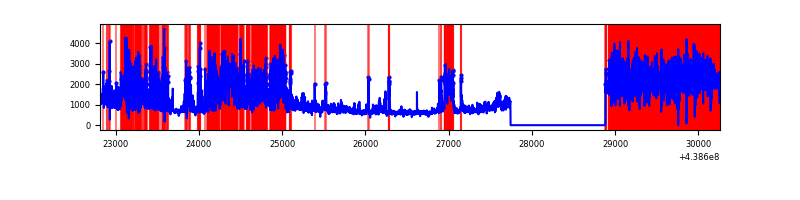 |
| B | 7449 | 6310 | 8 | 8 | 0.11% | 0.13% | 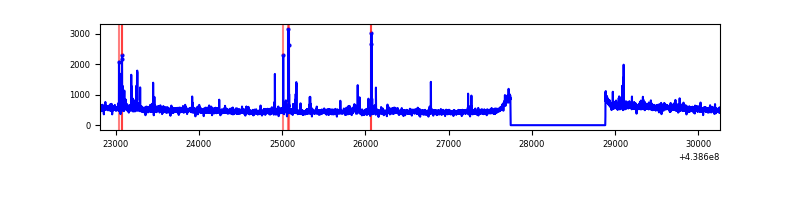 |
| C | 7449 | 6309 | 63 | 63 | 0.85% | 1.00% | 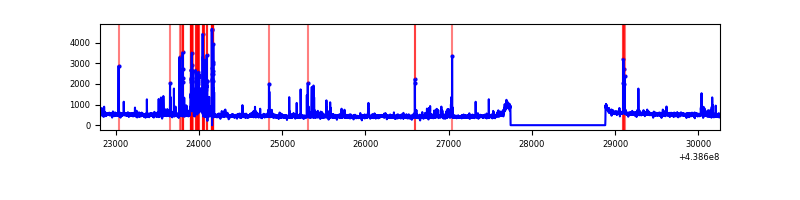 |
| D | 7449 | 6310 | 787 | 787 | 10.57% | 12.47% | 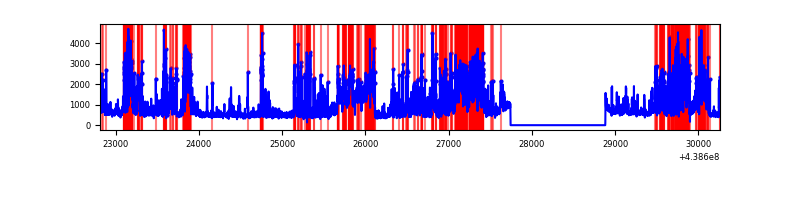 |
Top three noisy pixels from each quadrant. If the there are fewer than three noisy pixels in the level2.evt file, extra rows are filled as -1
| Pixel properties | Quadrant properties | ||||||
|---|---|---|---|---|---|---|---|
| Quadrant | DetID | PixID | Counts | Sigma | Mean | Median | Sigma |
| A | 15 | 223 | 4309183 | 33917.74 | 611 | 600 | 127.0 |
| A | 10 | 83 | 1055561 | 8304.79 | 611 | 600 | 127.0 |
| A | 14 | 238 | 762770 | 5999.9 | 611 | 600 | 127.0 |
| B | 5 | 172 | 62845 | 420.97 | 754 | 731 | 147.6 |
| B | 4 | 173 | 57099 | 382.02 | 754 | 731 | 147.6 |
| B | 5 | 235 | 47040 | 313.85 | 754 | 731 | 147.6 |
| C | 14 | 254 | 350462 | 2009.36 | 740 | 744 | 174.0 |
| C | 3 | 233 | 91628 | 522.19 | 740 | 744 | 174.0 |
| C | 8 | 13 | 12205 | 65.85 | 740 | 744 | 174.0 |
| D | 5 | 235 | 1683651 | 9437.31 | 707 | 687 | 178.3 |
| D | 1 | 52 | 749760 | 4200.47 | 707 | 687 | 178.3 |
| D | 12 | 233 | 692550 | 3879.66 | 707 | 687 | 178.3 |
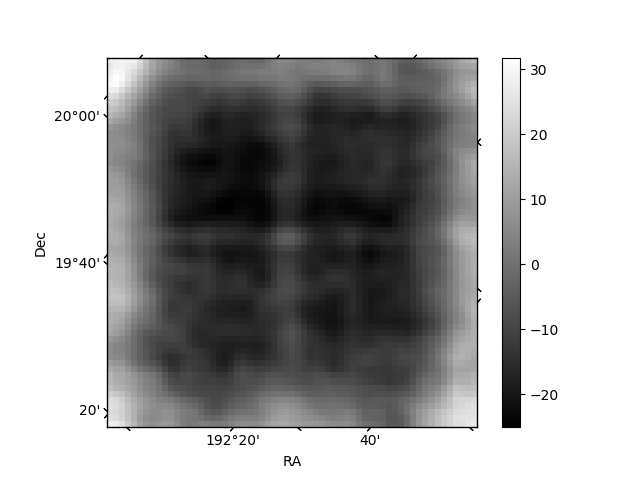
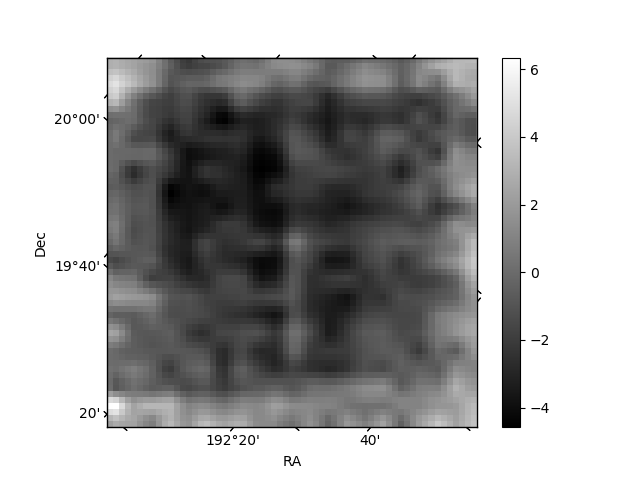
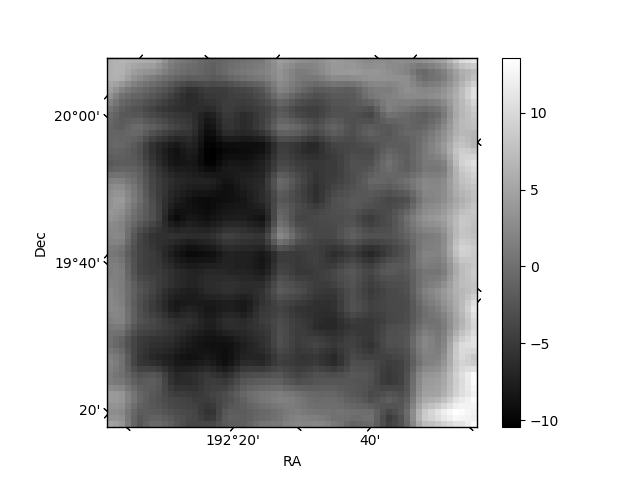
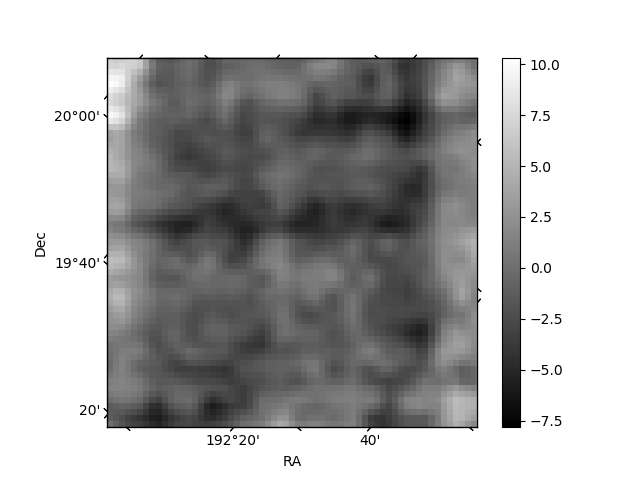
Histogram calculated using DETX and DETY for each event in the final _common_clean file
| Quadrant A | 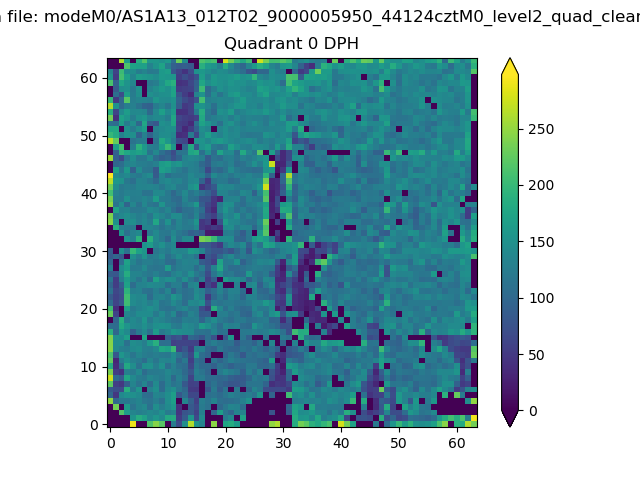 |
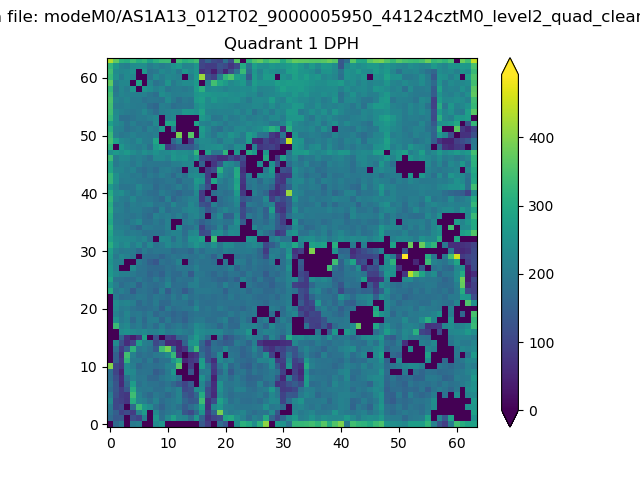 |
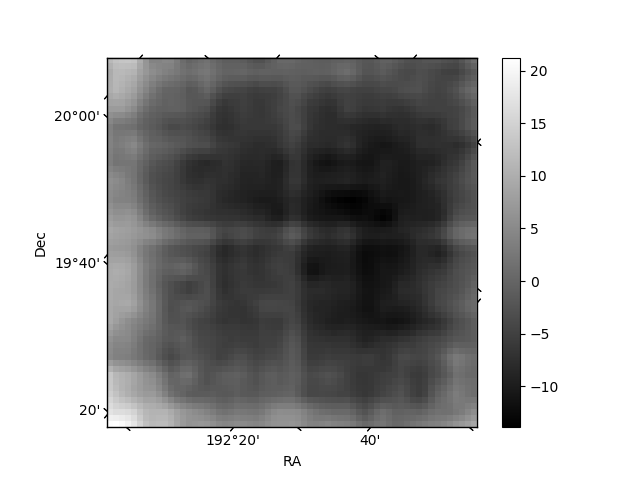
Quadrant B |
|---|---|---|---|
| Quadrant D | 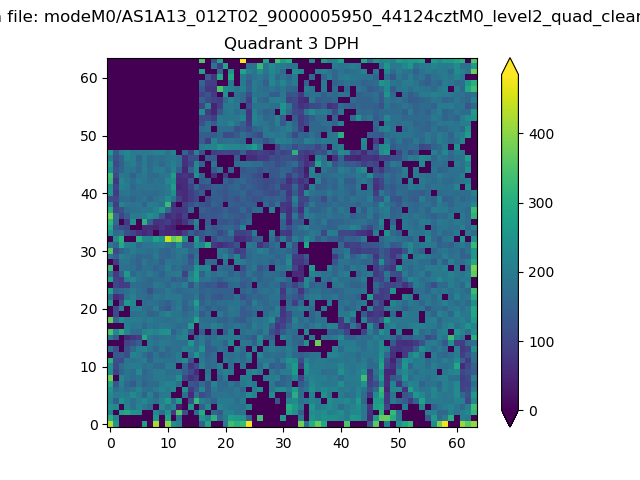 |
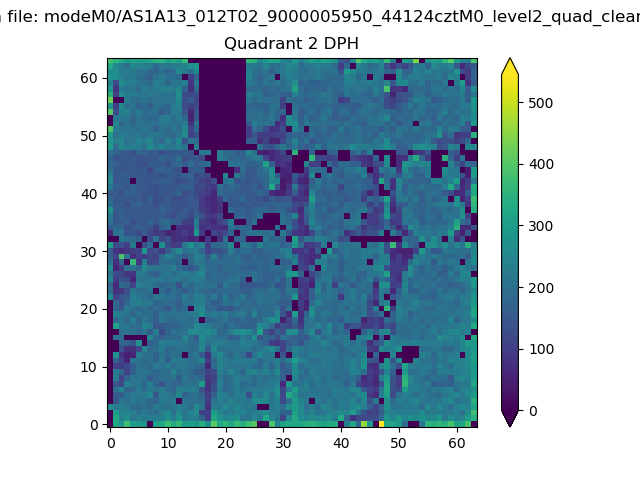 |
Quadrant C |
| Plot type | Count rate plots | Images |
|---|---|---|
| Comparison with Poisson distribution Blue bars denote a histogram of data divided into 1 sec bins. Red curve is a Poisson curve with rate = median count rate of data. |
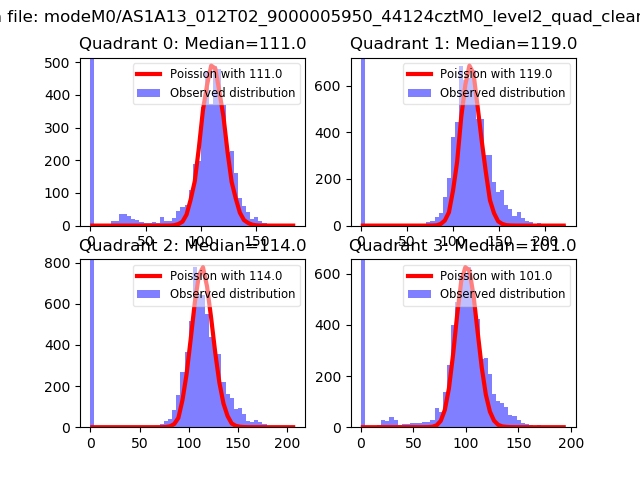 |
 |
| Quadrant-wise count rates Data is divided into 100 sec bins |
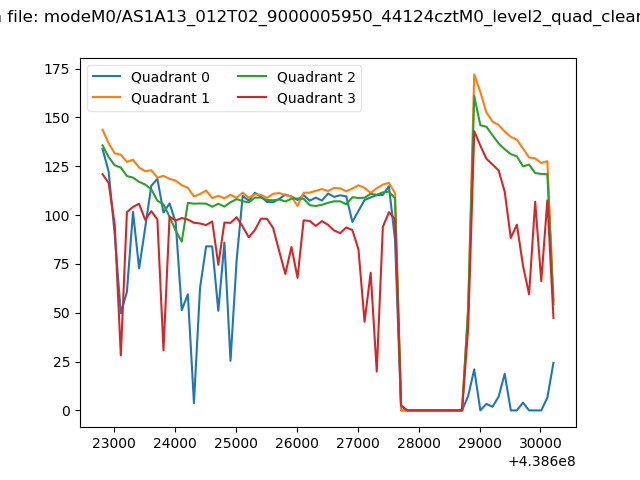 |
|
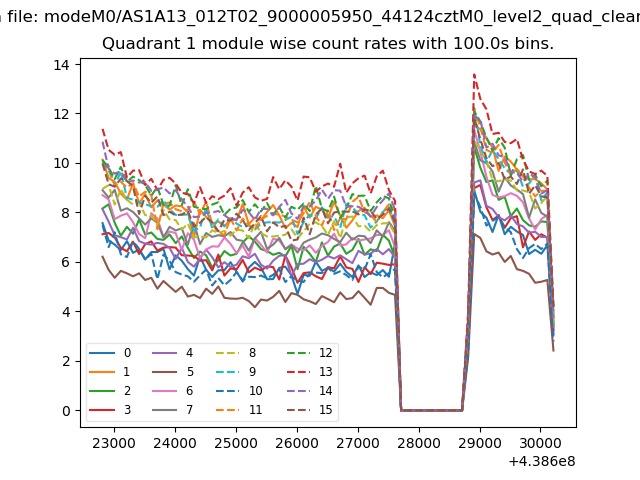
| Module-wise count rates for Quadrant A Data is divided into 100 sec bins |
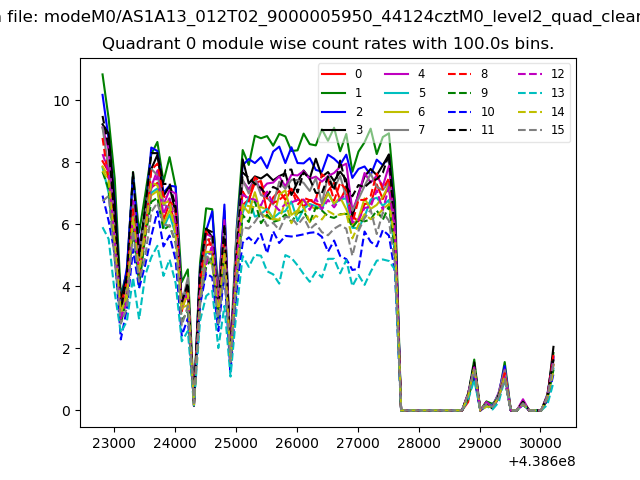 |
 |
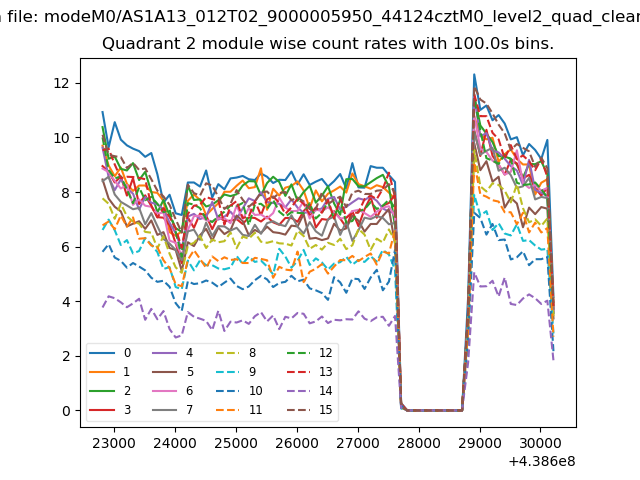
| Module-wise count rates for Quadrant B Data is divided into 100 sec bins |
 |
 |
| Module-wise count rates for Quadrant C Data is divided into 100 sec bins |
 |
 |
| Module-wise count rates for Quadrant D Data is divided into 100 sec bins |
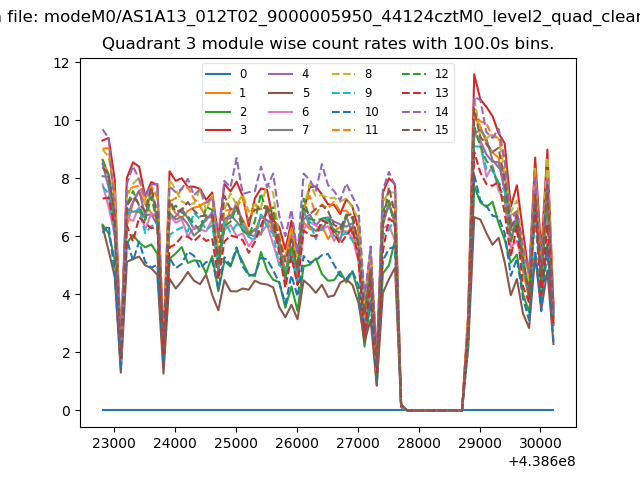 |
 |
| Parameter | Plot |
|---|---|
| CZT HV Monitor | 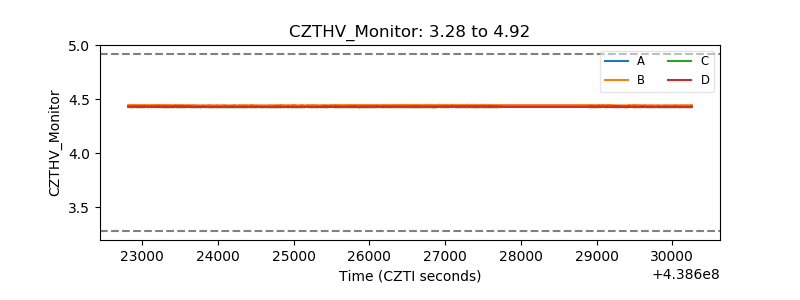 |
| D_VDD | 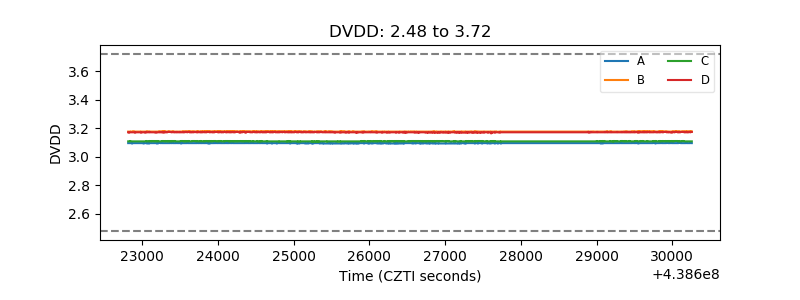 |
| Temperature 1 | 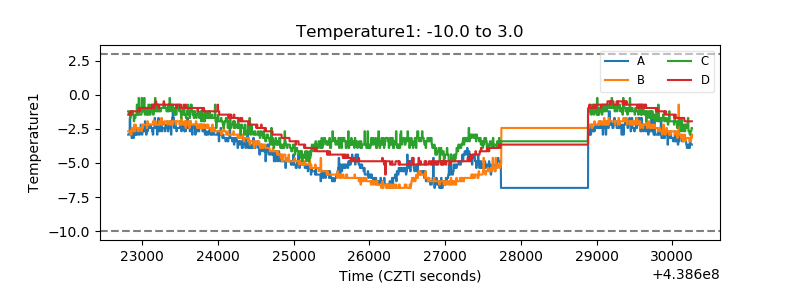 |
| Veto HV Monitor |  |
| Veto LLD | 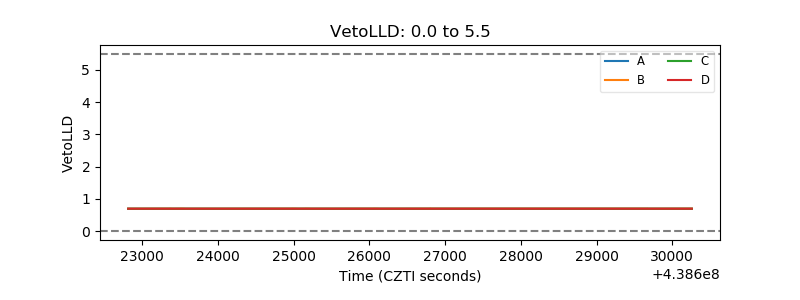 |
| Alpha Counter | 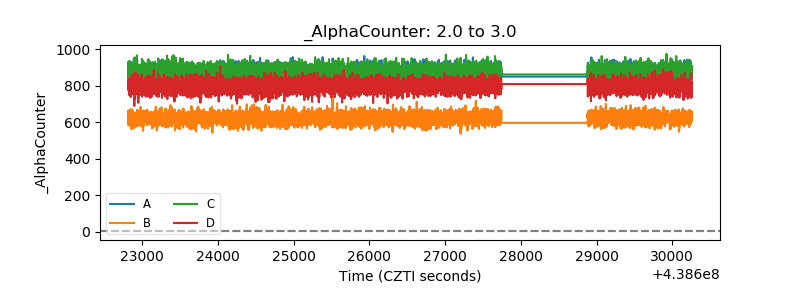 |
| _CPM_Rate | 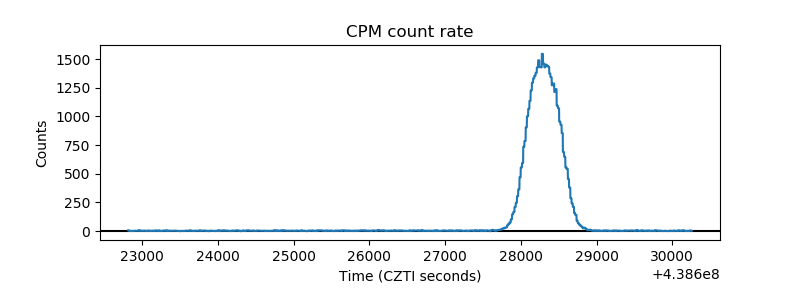 |
| CZT Counter | 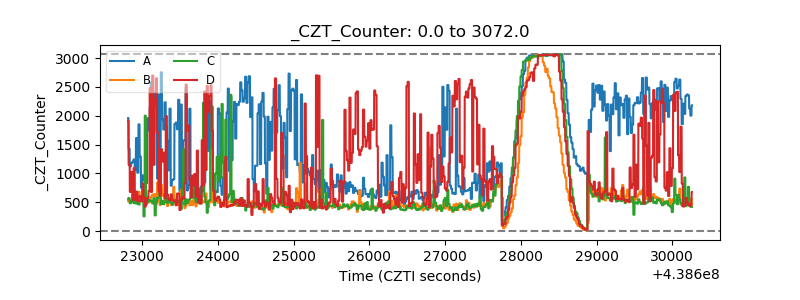 |
| +2.5 Volts monitor | 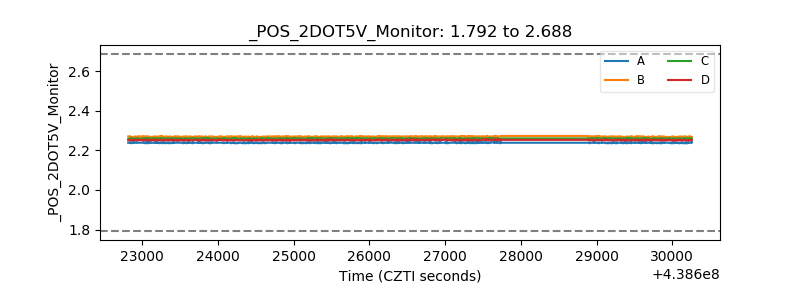 |
| +5 Volts monitor |  |
| _ROLL_ROT | 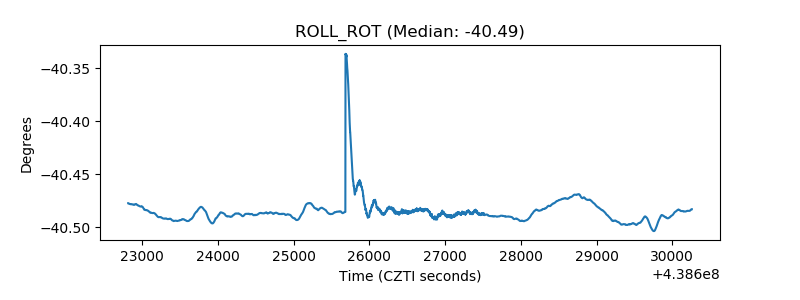 |
| _Roll_DEC | 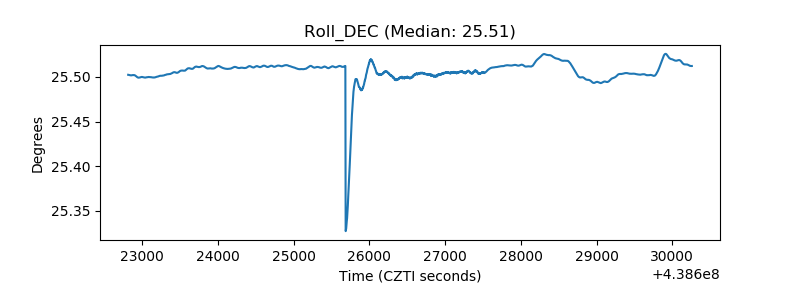 |
| _Roll_RA | 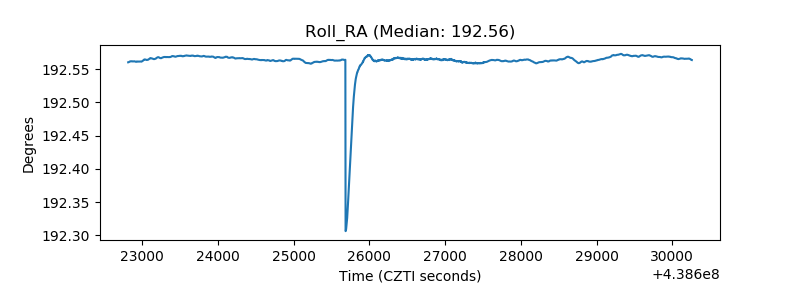 |
| Veto Counter | 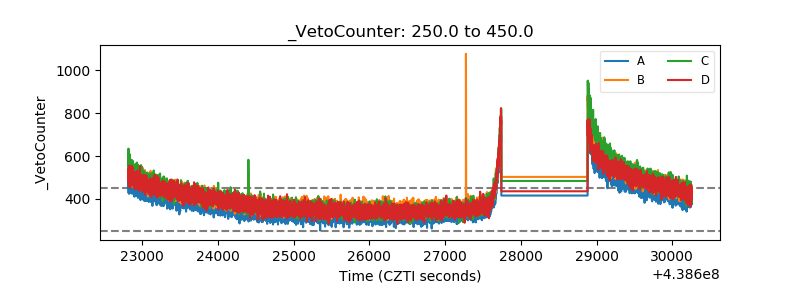 |