| Param | Original file | Final file |
|---|---|---|
| Filename | modeM0/AS1A13_012T02_9000005950_44125cztM0_level2.fits | modeM0/AS1A13_012T02_9000005950_44125cztM0_level2_quad_clean.evt |
| Size (bytes) | 690,189,120 | 95,857,920 |
| Size | 658.2 MB | 91.4 MB |
| Events in quadrant A | 13,252,376 | 232,854 |
| Events in quadrant B | 3,299,318 | 805,232 |
| Events in quadrant C | 3,283,106 | 768,969 |
| Events in quadrant D | 5,215,899 | 648,757 |
| Mode M9 | |||
|---|---|---|---|
| Quadrant | BADHDUFLAG | Total packets | Discarded packets |
| A | 0 | 12 | 0 |
| B | 0 | 12 | 0 |
| C | 0 | 12 | 0 |
| D | 0 | 12 | 0 |
| Mode SS | |||
|---|---|---|---|
| Quadrant | BADHDUFLAG | Total packets | Discarded packets |
| A | 0 | 130 | 0 |
| B | 0 | 130 | 0 |
| C | 0 | 130 | 0 |
| D | 0 | 130 | 0 |
| Mode M0 | |||
|---|---|---|---|
| Quadrant | BADHDUFLAG | Total packets | Discarded packets |
| A | 0 | 43737 | 1 |
| B | 0 | 14037 | 1 |
| C | 0 | 13969 | 1 |
| D | 0 | 19813 | 1 |
| Quadrant | Total seconds | Saturated seconds | Saturation percentage |
|---|---|---|---|
| A | 6403 | 4703 | 73.449945% |
| B | 6404 | 93 | 1.452217% |
| C | 6404 | 113 | 1.764522% |
| D | 6404 | 636 | 9.931293% |
Noise dominated data is calculated using 1-second bins in cleaned event files. If a bin has >2000 counts, and if more than 50% of those come from <1% of pixels, then it is considered to be noise-dominated and hence unusable.
| Quadrant | # 1 sec bins | Bins with >0 counts | Bins with >2000 counts | High rate bins dominated by noise | Noise dominated (total time) | Noise dominated (detector-on time) | Marked lightcurve |
|---|---|---|---|---|---|---|---|
| A | 7603 | 6403 | 3650 | 3650 | 48.01% | 57.00% | 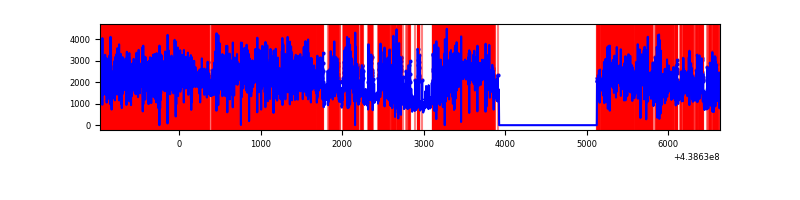 |
| B | 7604 | 6405 | 6 | 6 | 0.08% | 0.09% | 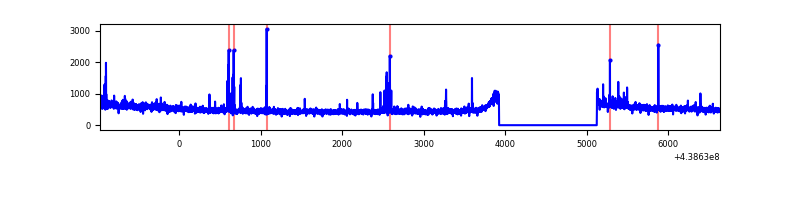 |
| C | 7604 | 6405 | 30 | 30 | 0.39% | 0.47% | 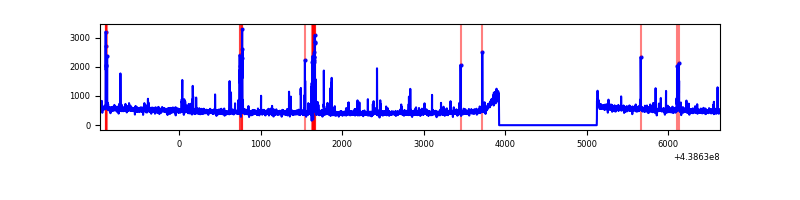 |
| D | 7604 | 6405 | 445 | 445 | 5.85% | 6.95% | 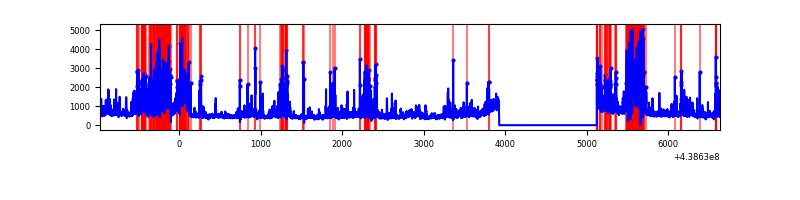 |
Top three noisy pixels from each quadrant. If the there are fewer than three noisy pixels in the level2.evt file, extra rows are filled as -1
| Pixel properties | Quadrant properties | ||||||
|---|---|---|---|---|---|---|---|
| Quadrant | DetID | PixID | Counts | Sigma | Mean | Median | Sigma |
| A | 15 | 223 | 6636902 | 64956.74 | 492 | 482 | 102.2 |
| A | 14 | 238 | 3172627 | 31048.69 | 492 | 482 | 102.2 |
| A | 10 | 83 | 882457 | 8632.7 | 492 | 482 | 102.2 |
| B | 5 | 172 | 68165 | 438.53 | 789 | 768 | 153.7 |
| B | 4 | 173 | 43734 | 279.56 | 789 | 768 | 153.7 |
| B | 0 | 183 | 22761 | 143.1 | 789 | 768 | 153.7 |
| C | 14 | 254 | 220338 | 1203.79 | 778 | 783 | 182.4 |
| C | 3 | 233 | 15099 | 78.49 | 778 | 783 | 182.4 |
| C | 14 | 220 | 7670 | 37.76 | 778 | 783 | 182.4 |
| D | 12 | 233 | 758721 | 4068.01 | 743 | 722 | 186.3 |
| D | 1 | 47 | 453646 | 2430.74 | 743 | 722 | 186.3 |
| D | 1 | 52 | 327461 | 1753.53 | 743 | 722 | 186.3 |
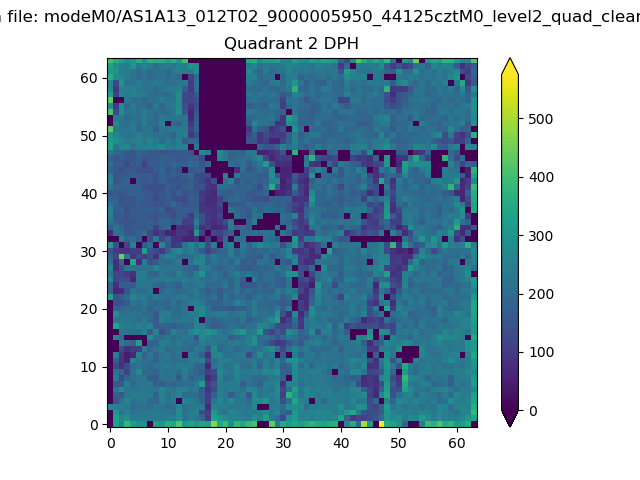
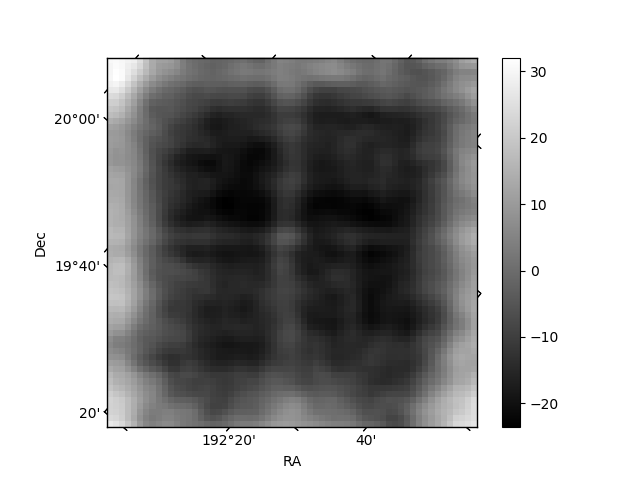
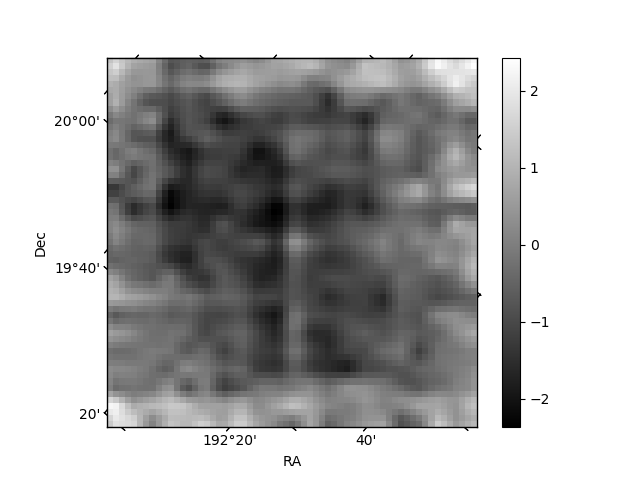
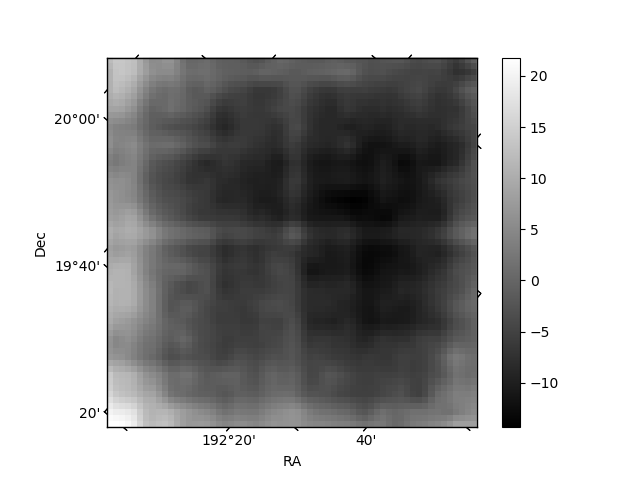
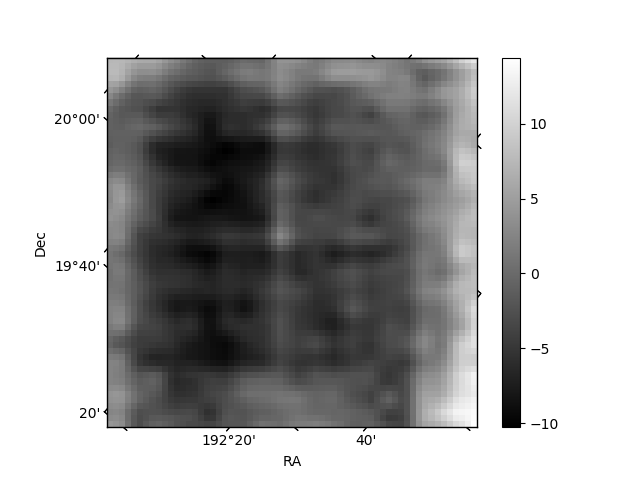
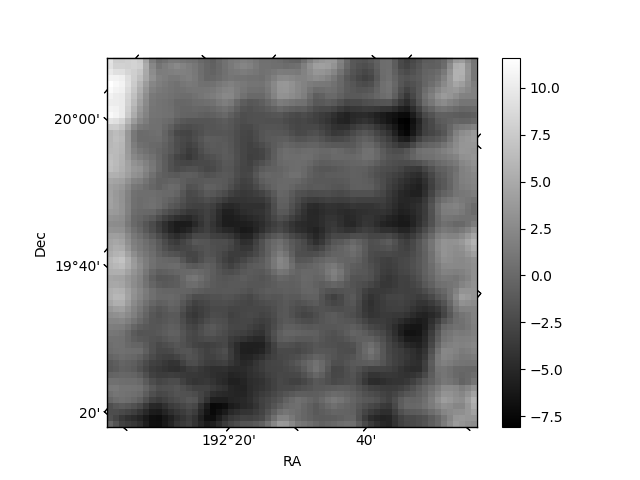
Histogram calculated using DETX and DETY for each event in the final _common_clean file
| Quadrant A | 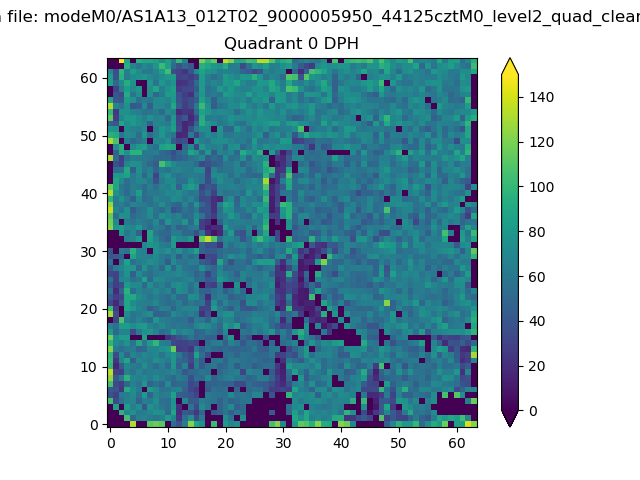 |
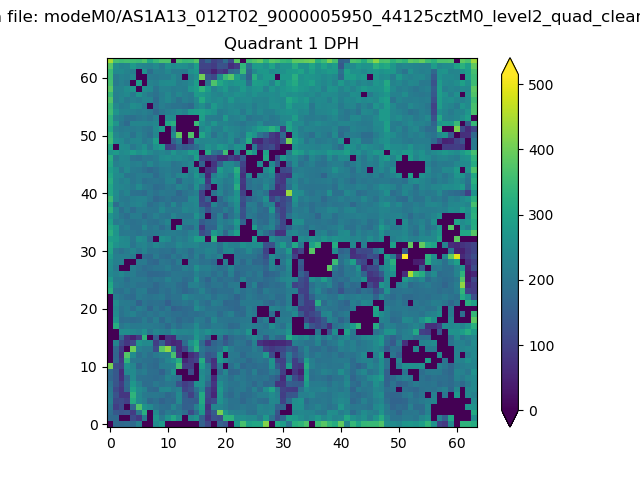 |
Quadrant B |
|---|---|---|---|
| Quadrant D | 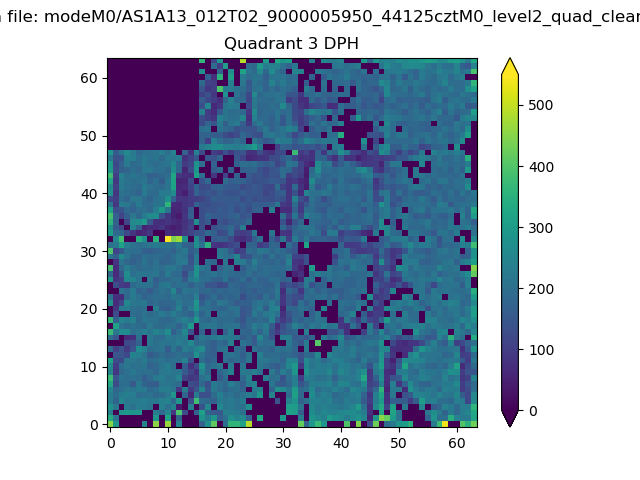 |
 |
Quadrant C |
| Plot type | Count rate plots | Images |
|---|---|---|
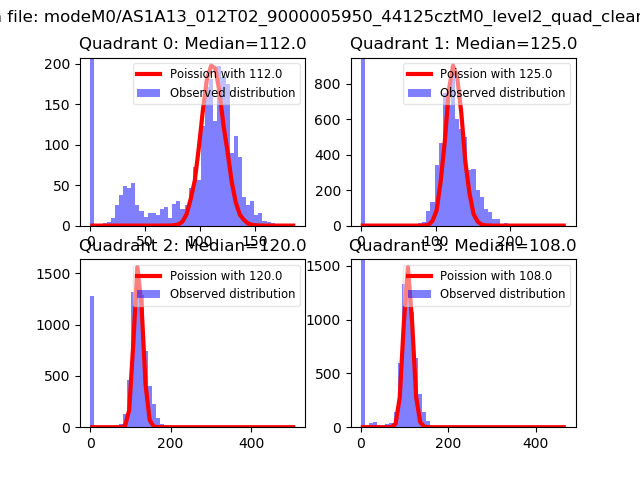
| Comparison with Poisson distribution Blue bars denote a histogram of data divided into 1 sec bins. Red curve is a Poisson curve with rate = median count rate of data. |
 |
 |
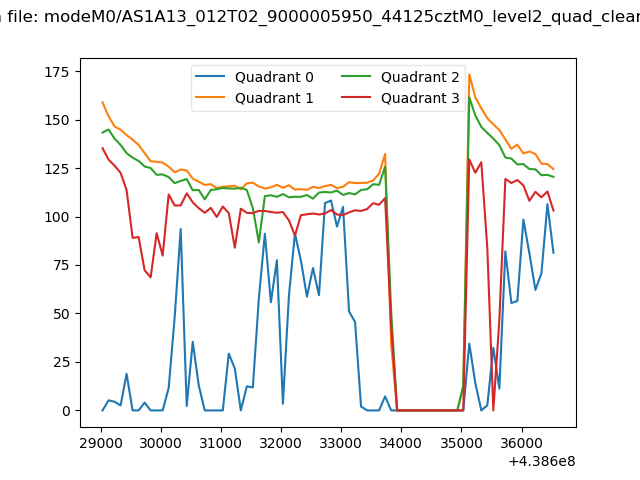
| Quadrant-wise count rates Data is divided into 100 sec bins |
 |
|
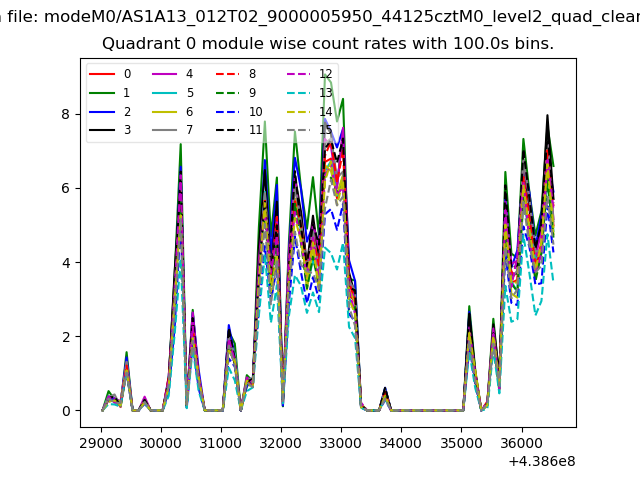
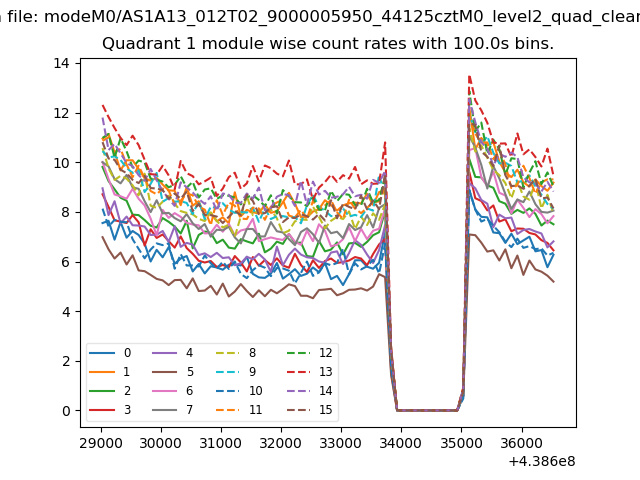
| Module-wise count rates for Quadrant A Data is divided into 100 sec bins |
 |
 |
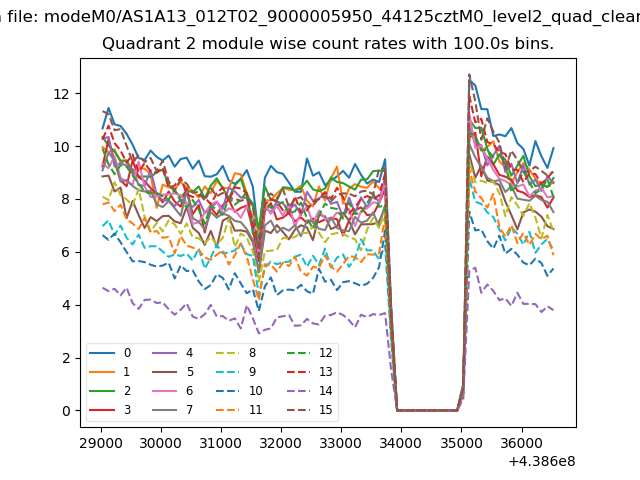
| Module-wise count rates for Quadrant B Data is divided into 100 sec bins |
 |
 |
| Module-wise count rates for Quadrant C Data is divided into 100 sec bins |
 |
 |
| Module-wise count rates for Quadrant D Data is divided into 100 sec bins |
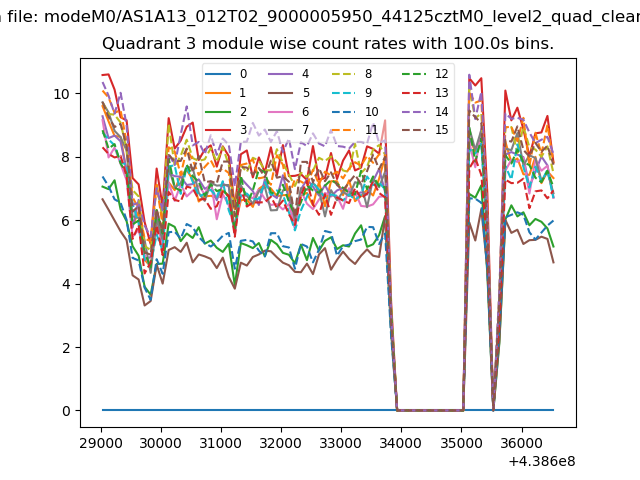 |
 |
| Parameter | Plot |
|---|---|
| CZT HV Monitor | 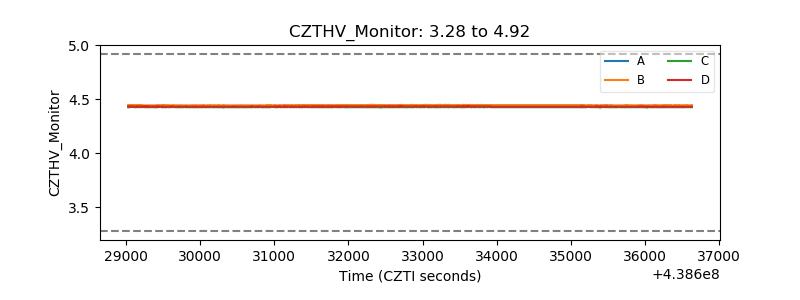 |
| D_VDD | 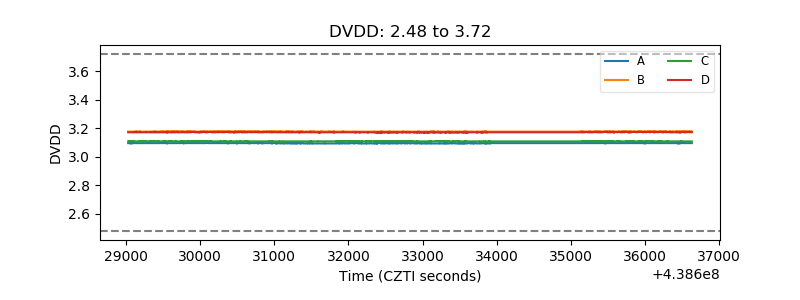 |
| Temperature 1 | 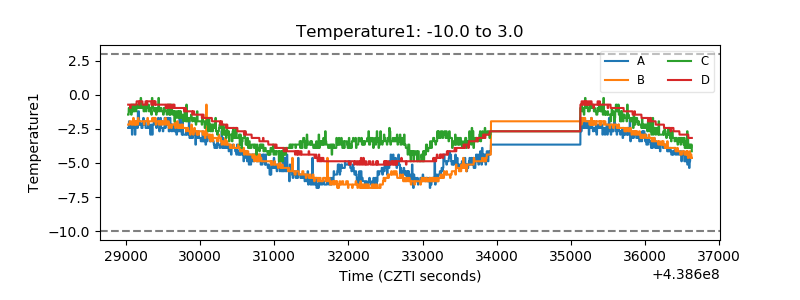 |
| Veto HV Monitor | 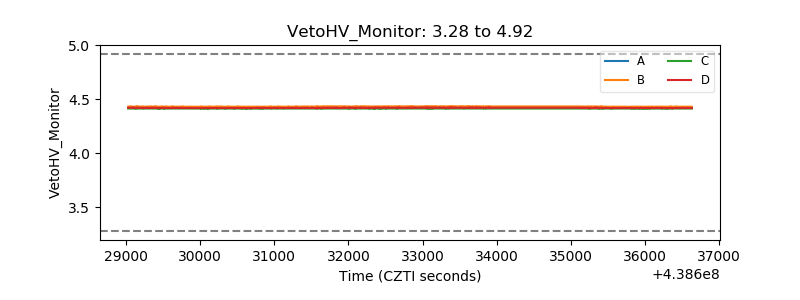 |
| Veto LLD | 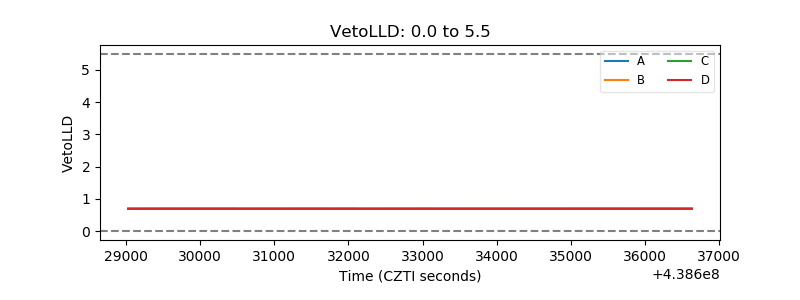 |
| Alpha Counter | 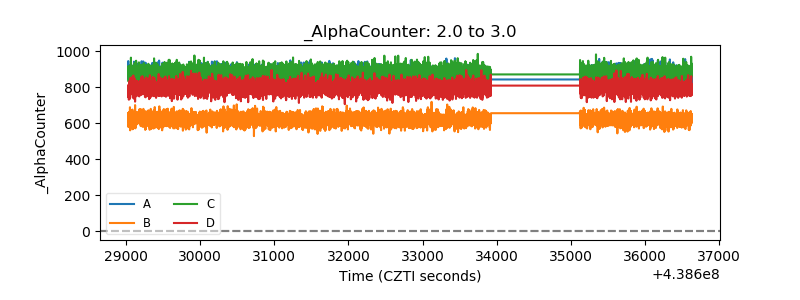 |
| _CPM_Rate | 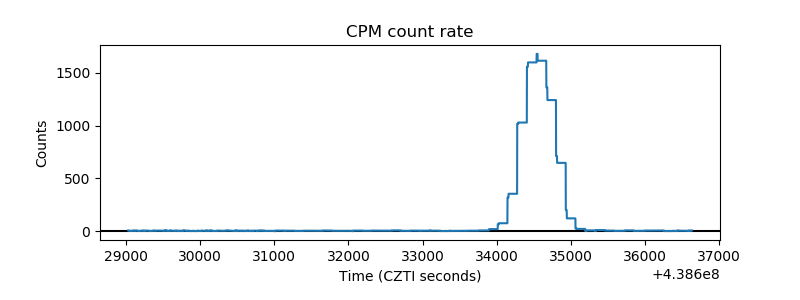 |
| CZT Counter | 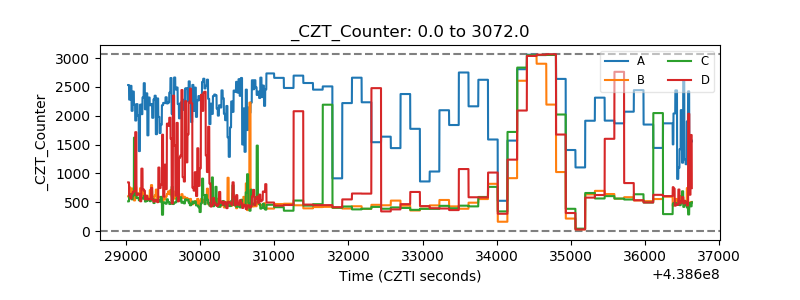 |
| +2.5 Volts monitor |  |
| +5 Volts monitor | 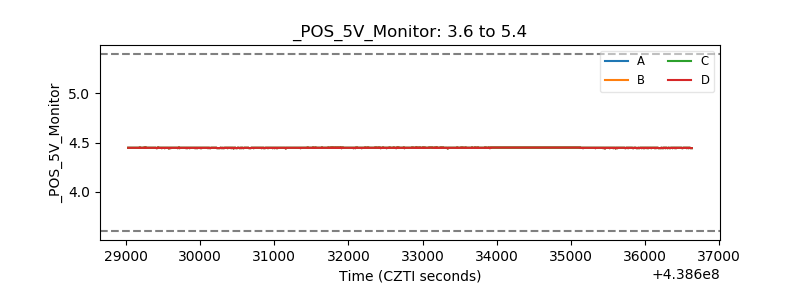 |
| _ROLL_ROT | 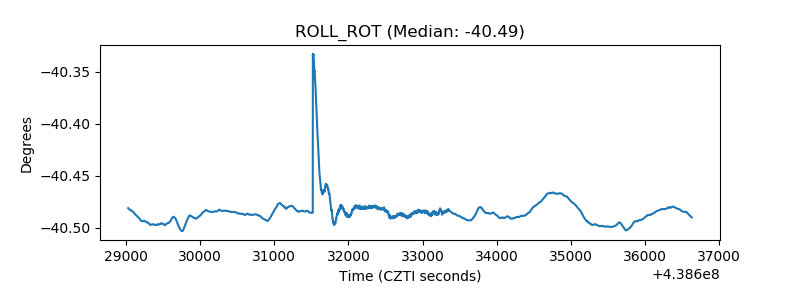 |
| _Roll_DEC | 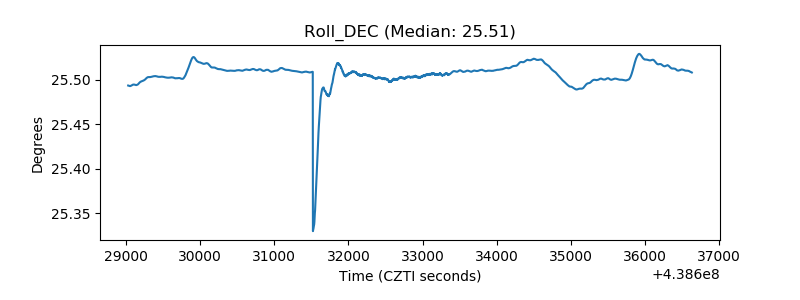 |
| _Roll_RA | 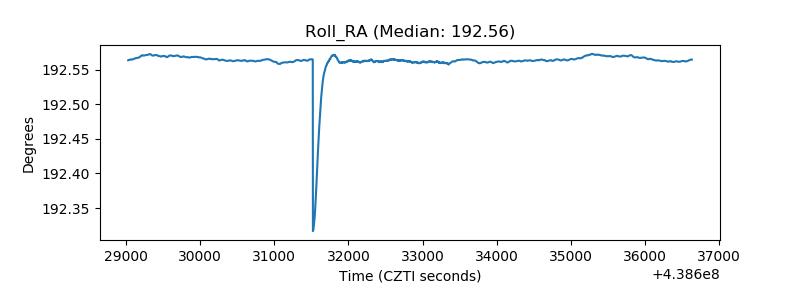 |
| Veto Counter | 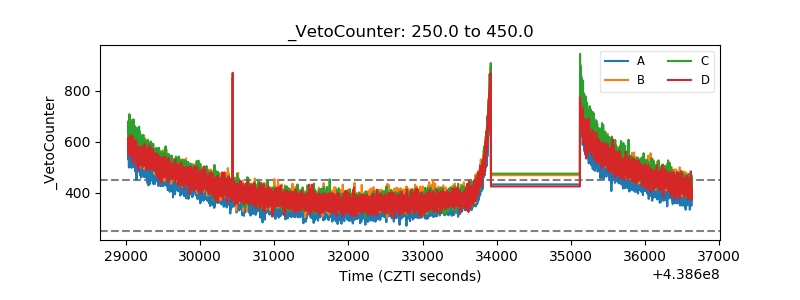 |