| Param | Original file | Final file |
|---|---|---|
| Filename | modeM0/AS1A13_012T02_9000005950_44126cztM0_level2.fits | modeM0/AS1A13_012T02_9000005950_44126cztM0_level2_quad_clean.evt |
| Size (bytes) | 585,414,720 | 87,724,800 |
| Size | 558.3 MB | 83.7 MB |
| Events in quadrant A | 10,623,698 | 315,345 |
| Events in quadrant B | 2,934,088 | 707,381 |
| Events in quadrant C | 2,773,317 | 680,238 |
| Events in quadrant D | 4,897,885 | 556,266 |
| Mode M9 | |||
|---|---|---|---|
| Quadrant | BADHDUFLAG | Total packets | Discarded packets |
| A | 0 | 12 | 0 |
| B | 0 | 12 | 0 |
| C | 0 | 12 | 0 |
| D | 0 | 12 | 0 |
| Mode SS | |||
|---|---|---|---|
| Quadrant | BADHDUFLAG | Total packets | Discarded packets |
| A | 0 | 116 | 0 |
| B | 0 | 116 | 0 |
| C | 0 | 116 | 0 |
| D | 0 | 116 | 0 |
| Mode M0 | |||
|---|---|---|---|
| Quadrant | BADHDUFLAG | Total packets | Discarded packets |
| A | 0 | 35459 | 1 |
| B | 0 | 12446 | 1 |
| C | 0 | 12080 | 2 |
| D | 0 | 18395 | 1 |
| Quadrant | Total seconds | Saturated seconds | Saturation percentage |
|---|---|---|---|
| A | 5675 | 3293 | 58.026432% |
| B | 5675 | 77 | 1.356828% |
| C | 5675 | 40 | 0.704846% |
| D | 5675 | 670 | 11.806167% |
Noise dominated data is calculated using 1-second bins in cleaned event files. If a bin has >2000 counts, and if more than 50% of those come from <1% of pixels, then it is considered to be noise-dominated and hence unusable.
| Quadrant | # 1 sec bins | Bins with >0 counts | Bins with >2000 counts | High rate bins dominated by noise | Noise dominated (total time) | Noise dominated (detector-on time) | Marked lightcurve |
|---|---|---|---|---|---|---|---|
| A | 6915 | 5676 | 2577 | 2577 | 37.27% | 45.40% | 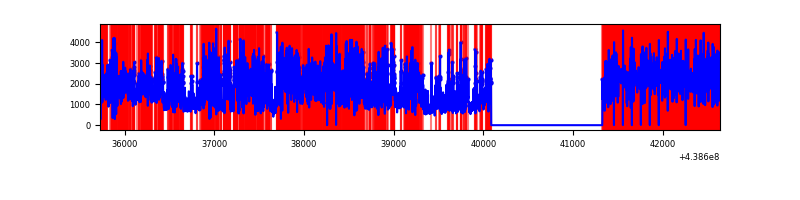 |
| B | 6915 | 5676 | 5 | 5 | 0.07% | 0.09% | 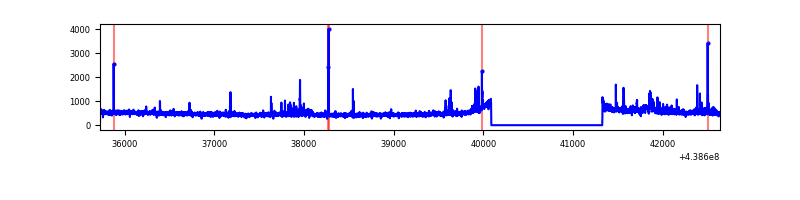 |
| C | 6915 | 5676 | 8 | 8 | 0.12% | 0.14% | 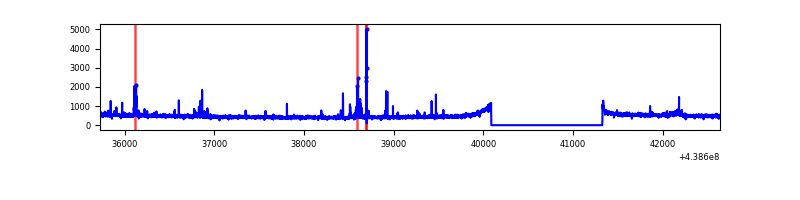 |
| D | 6915 | 5676 | 511 | 511 | 7.39% | 9.00% | 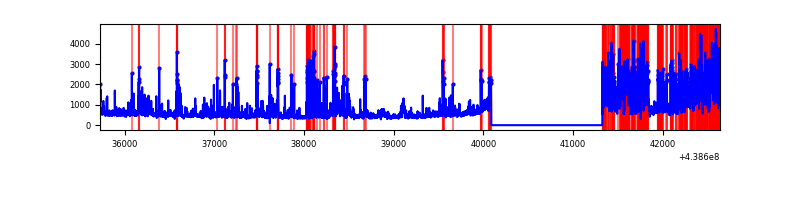 |
Top three noisy pixels from each quadrant. If the there are fewer than three noisy pixels in the level2.evt file, extra rows are filled as -1
| Pixel properties | Quadrant properties | ||||||
|---|---|---|---|---|---|---|---|
| Quadrant | DetID | PixID | Counts | Sigma | Mean | Median | Sigma |
| A | 15 | 223 | 6391019 | 66304.95 | 461 | 452 | 96.4 |
| A | 14 | 238 | 1649580 | 17110.43 | 461 | 452 | 96.4 |
| A | 10 | 83 | 747012 | 7745.89 | 461 | 452 | 96.4 |
| B | 5 | 172 | 44094 | 323.93 | 685 | 666 | 134.1 |
| B | 4 | 171 | 37054 | 271.41 | 685 | 666 | 134.1 |
| B | 5 | 235 | 33557 | 245.33 | 685 | 666 | 134.1 |
| C | 14 | 254 | 94983 | 590.8 | 677 | 683 | 159.6 |
| C | 14 | 96 | 16074 | 96.43 | 677 | 683 | 159.6 |
| C | 14 | 220 | 15358 | 91.94 | 677 | 683 | 159.6 |
| D | 1 | 52 | 1403820 | 8613.06 | 643 | 623 | 162.9 |
| D | 1 | 47 | 195476 | 1196.04 | 643 | 623 | 162.9 |
| D | 2 | 249 | 157169 | 960.91 | 643 | 623 | 162.9 |
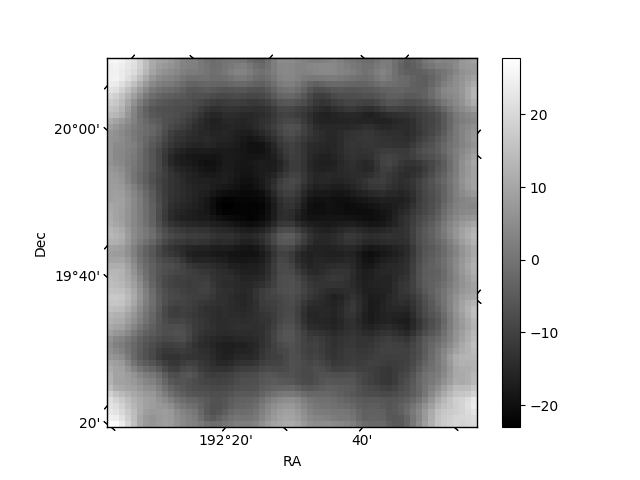
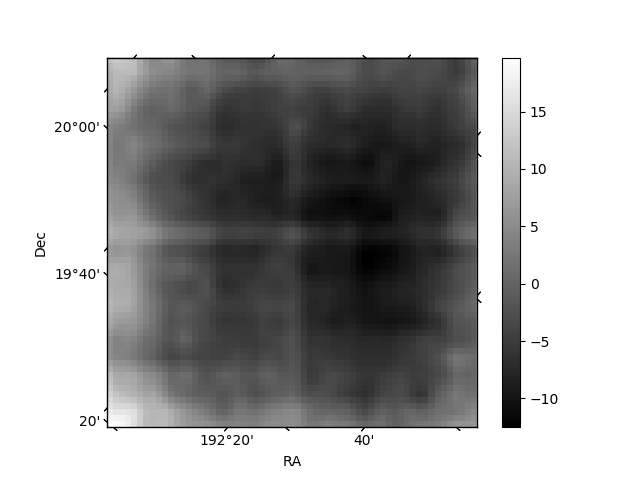
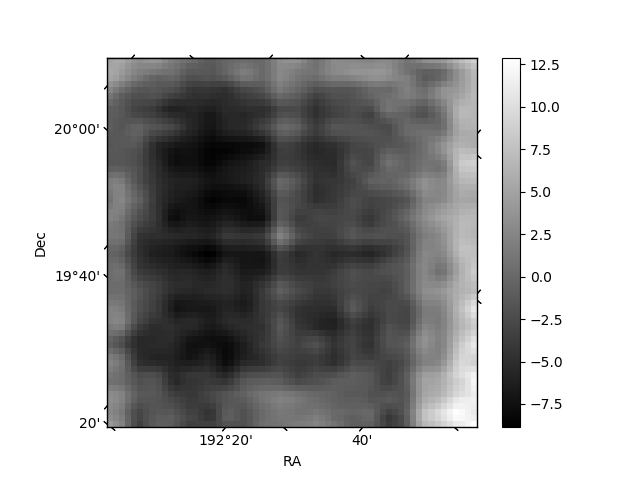
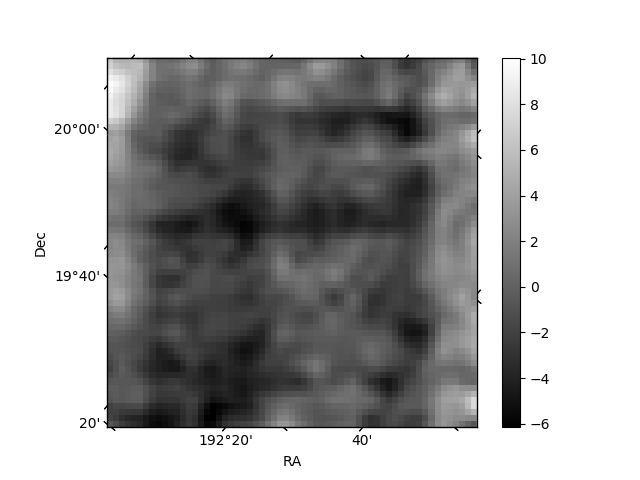
Histogram calculated using DETX and DETY for each event in the final _common_clean file
| Quadrant A | 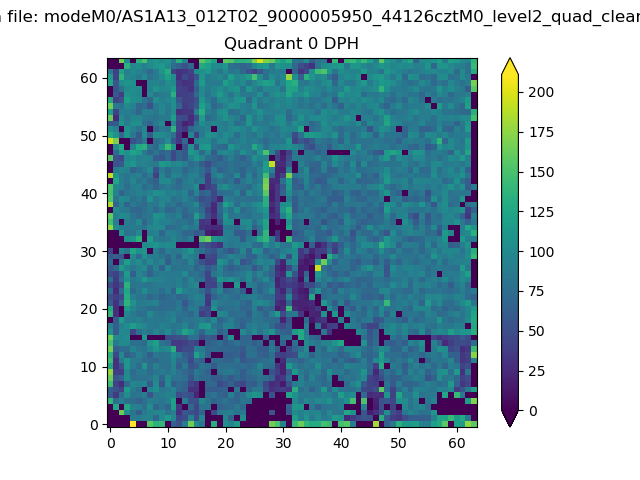 |
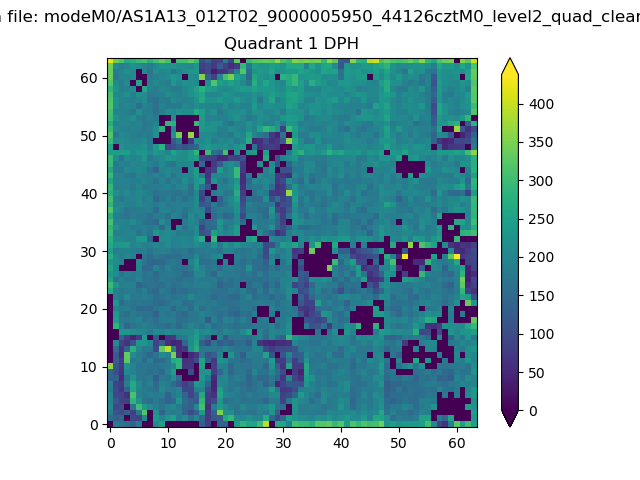 |
Quadrant B |
|---|---|---|---|
| Quadrant D | 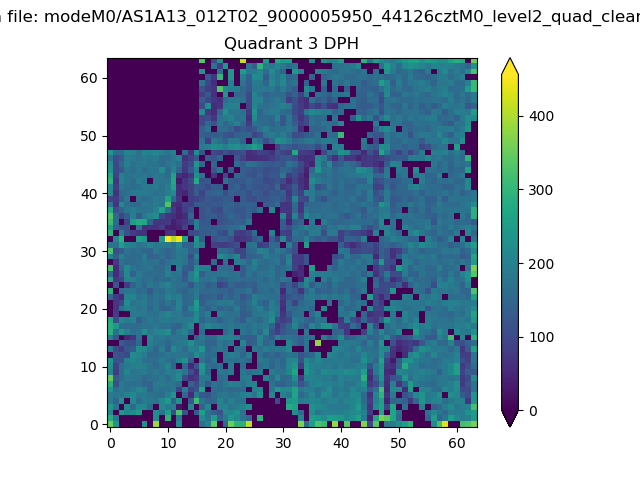 |
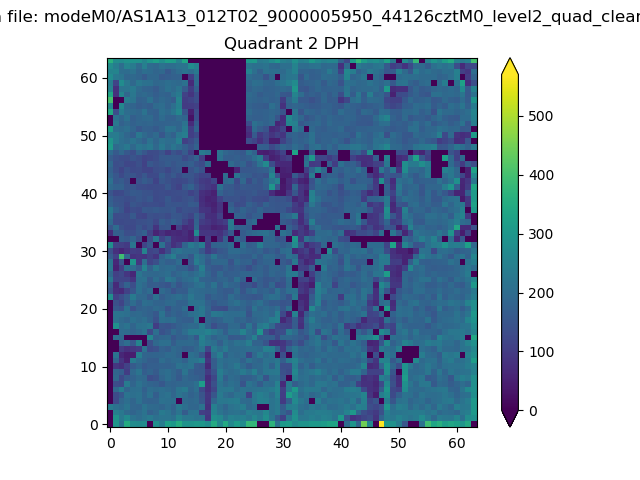 |
Quadrant C |
| Plot type | Count rate plots | Images |
|---|---|---|
| Comparison with Poisson distribution Blue bars denote a histogram of data divided into 1 sec bins. Red curve is a Poisson curve with rate = median count rate of data. |
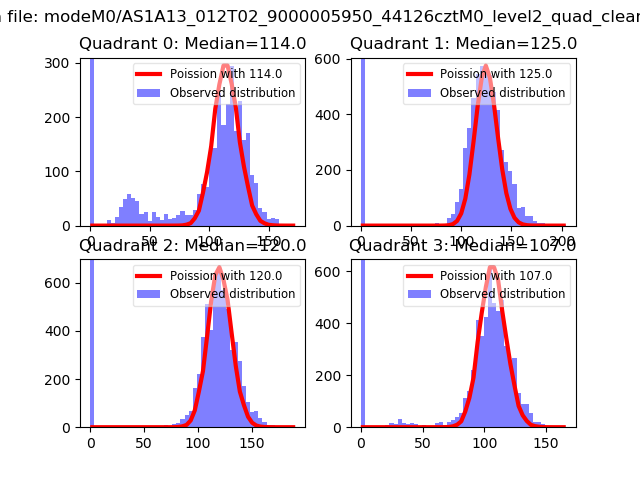 |
 |
| Quadrant-wise count rates Data is divided into 100 sec bins |
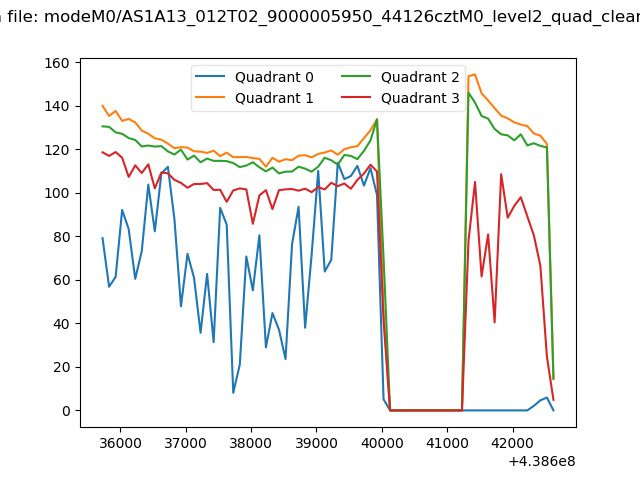 |
|
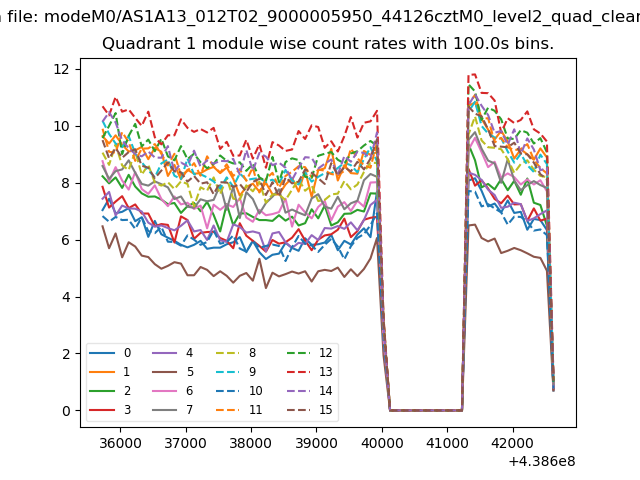
| Module-wise count rates for Quadrant A Data is divided into 100 sec bins |
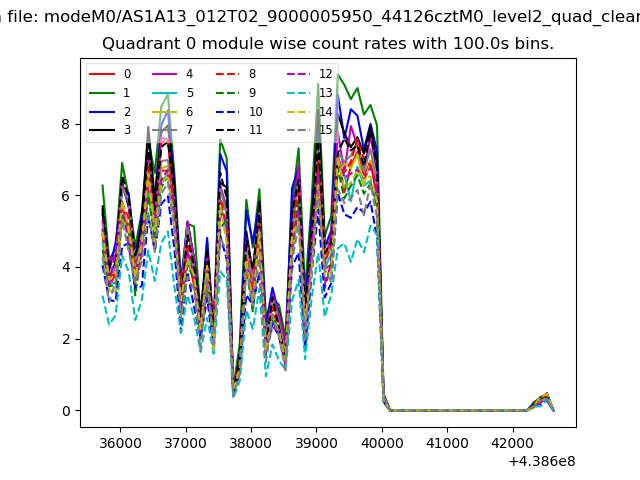 |
 |
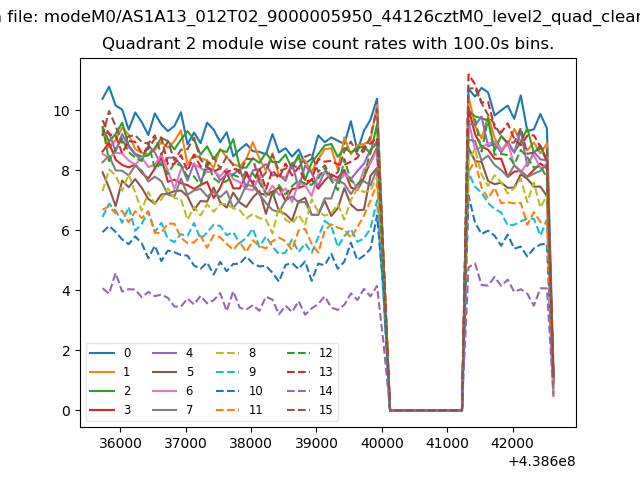
| Module-wise count rates for Quadrant B Data is divided into 100 sec bins |
 |
 |
| Module-wise count rates for Quadrant C Data is divided into 100 sec bins |
 |
 |
| Module-wise count rates for Quadrant D Data is divided into 100 sec bins |
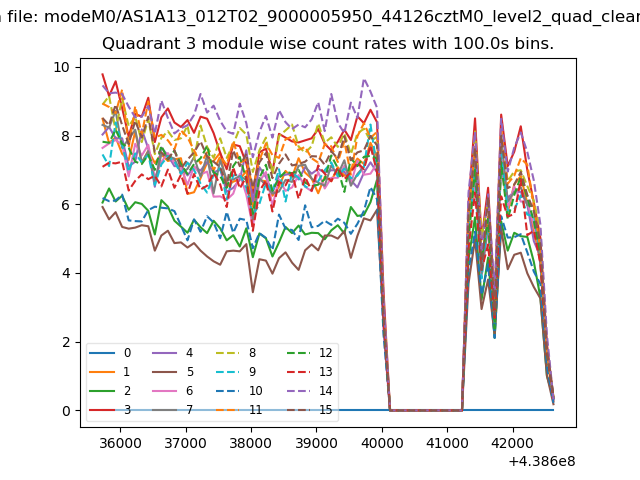 |
 |
| Parameter | Plot |
|---|---|
| CZT HV Monitor |  |
| D_VDD | 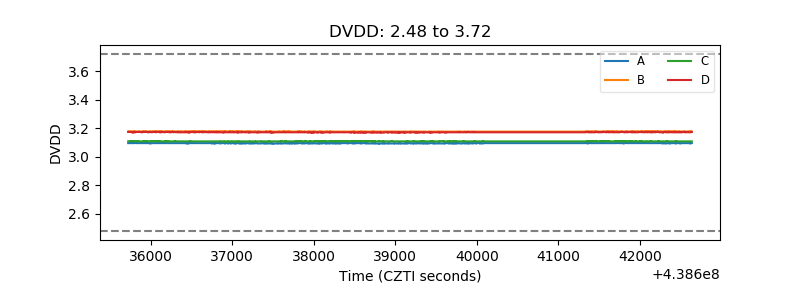 |
| Temperature 1 | 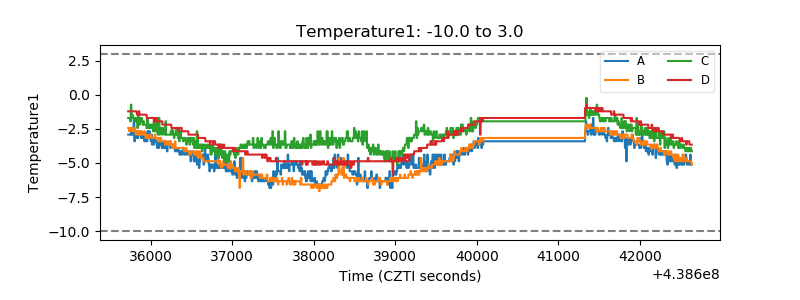 |
| Veto HV Monitor | 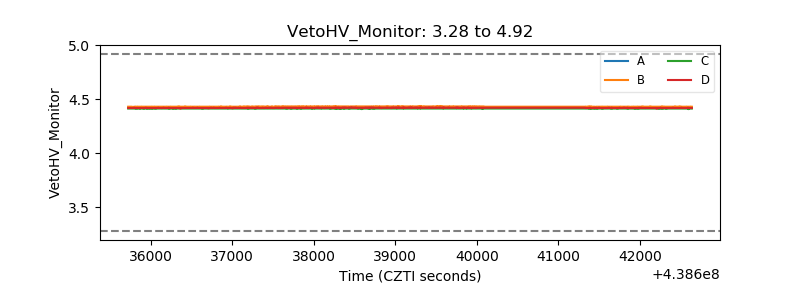 |
| Veto LLD | 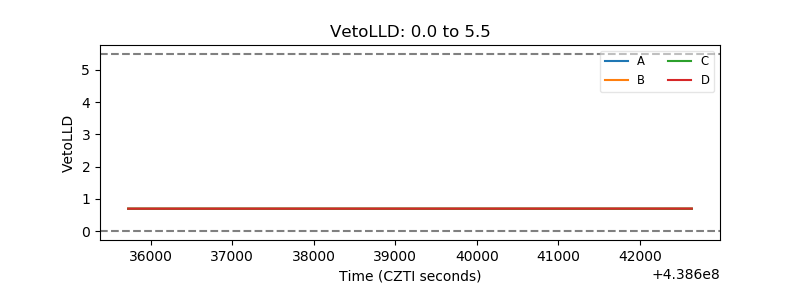 |
| Alpha Counter | 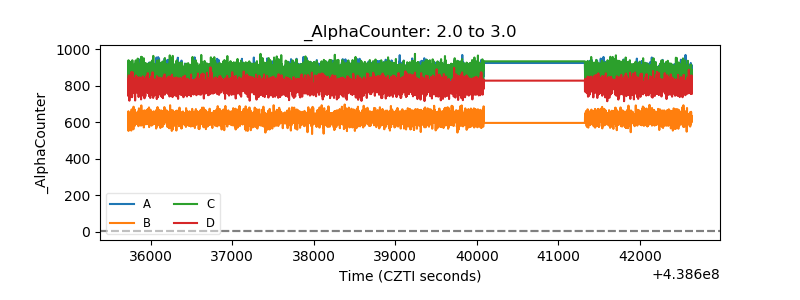 |
| _CPM_Rate | 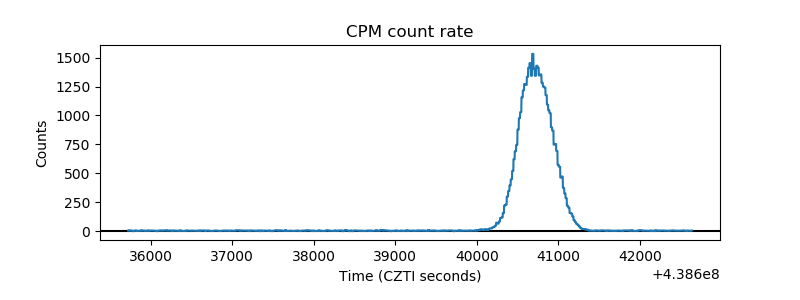 |
| CZT Counter | 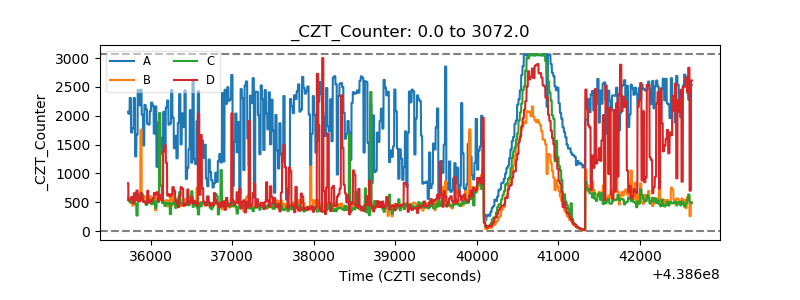 |
| +2.5 Volts monitor | 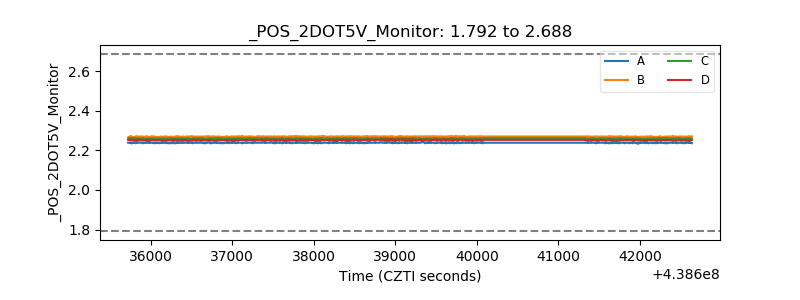 |
| +5 Volts monitor | 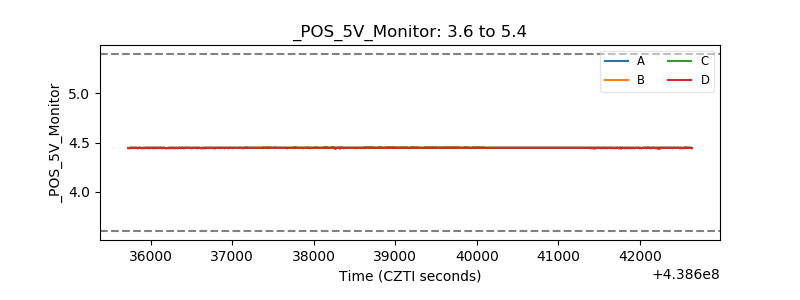 |
| _ROLL_ROT | 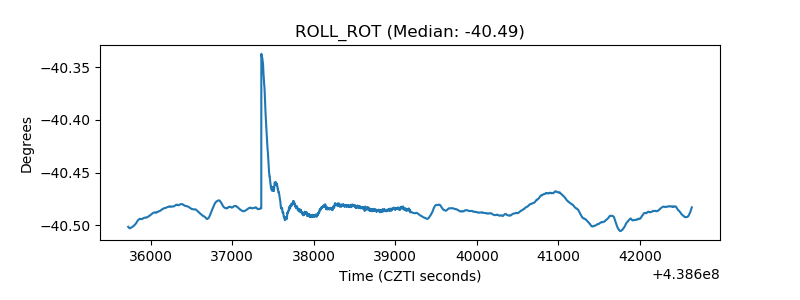 |
| _Roll_DEC | 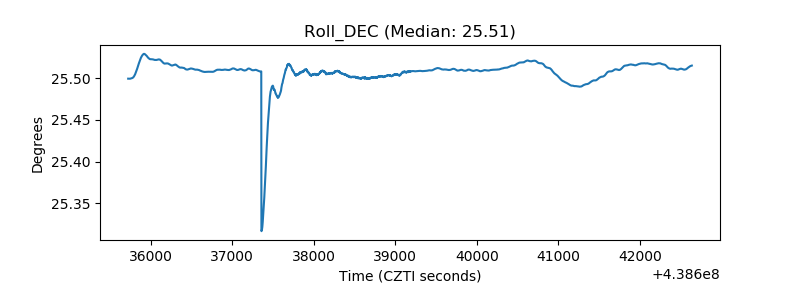 |
| _Roll_RA | 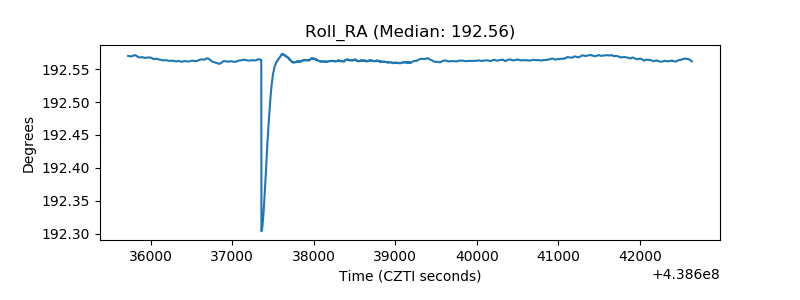 |
| Veto Counter | 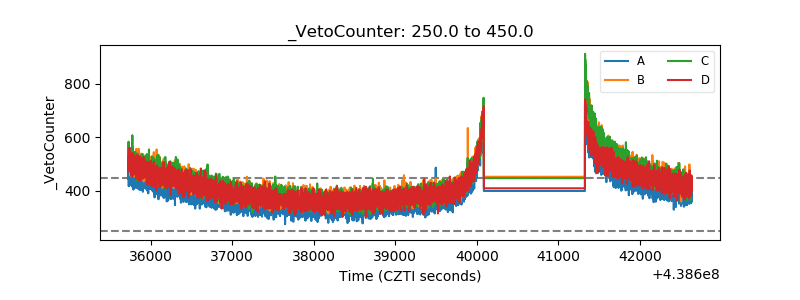 |