| Param | Original file | Final file |
|---|---|---|
| Filename | modeM0/AS1A13_012T02_9000005950_44127cztM0_level2.fits | modeM0/AS1A13_012T02_9000005950_44127cztM0_level2_quad_clean.evt |
| Size (bytes) | 725,520,960 | 83,880,000 |
| Size | 691.9 MB | 80.0 MB |
| Events in quadrant A | 12,405,445 | 238,652 |
| Events in quadrant B | 3,203,685 | 715,618 |
| Events in quadrant C | 2,997,217 | 693,278 |
| Events in quadrant D | 7,785,477 | 474,026 |
| Mode M9 | |||
|---|---|---|---|
| Quadrant | BADHDUFLAG | Total packets | Discarded packets |
| A | 0 | 13 | 0 |
| B | 0 | 13 | 0 |
| C | 0 | 13 | 0 |
| D | 0 | 13 | 0 |
| Mode SS | |||
|---|---|---|---|
| Quadrant | BADHDUFLAG | Total packets | Discarded packets |
| A | 0 | 122 | 0 |
| B | 0 | 122 | 0 |
| C | 0 | 122 | 0 |
| D | 0 | 122 | 0 |
| Mode M0 | |||
|---|---|---|---|
| Quadrant | BADHDUFLAG | Total packets | Discarded packets |
| A | 0 | 40926 | 1 |
| B | 0 | 13547 | 1 |
| C | 0 | 13003 | 1 |
| D | 0 | 27268 | 1 |
| Quadrant | Total seconds | Saturated seconds | Saturation percentage |
|---|---|---|---|
| A | 5987 | 4191 | 70.001670% |
| B | 5987 | 127 | 2.121263% |
| C | 5987 | 70 | 1.169200% |
| D | 5987 | 1709 | 28.545181% |
Noise dominated data is calculated using 1-second bins in cleaned event files. If a bin has >2000 counts, and if more than 50% of those come from <1% of pixels, then it is considered to be noise-dominated and hence unusable.
| Quadrant | # 1 sec bins | Bins with >0 counts | Bins with >2000 counts | High rate bins dominated by noise | Noise dominated (total time) | Noise dominated (detector-on time) | Marked lightcurve |
|---|---|---|---|---|---|---|---|
| A | 7217 | 5988 | 3383 | 3383 | 46.88% | 56.50% | 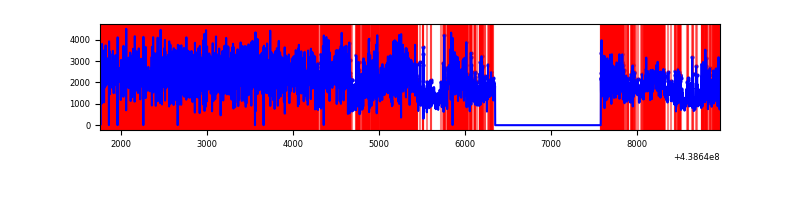 |
| B | 7217 | 5988 | 46 | 46 | 0.64% | 0.77% | 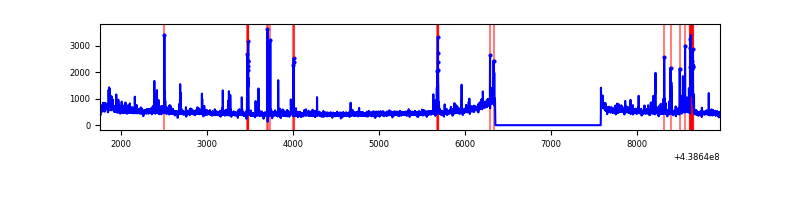 |
| C | 7217 | 5988 | 30 | 30 | 0.42% | 0.50% | 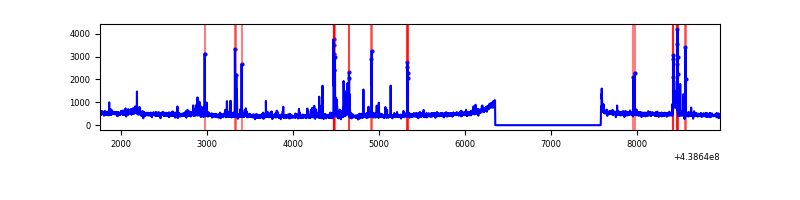 |
| D | 7217 | 5988 | 1400 | 1400 | 19.40% | 23.38% | 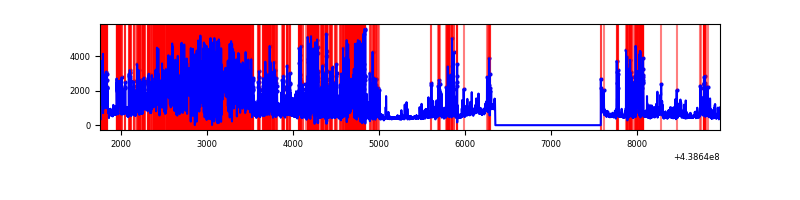 |
Top three noisy pixels from each quadrant. If the there are fewer than three noisy pixels in the level2.evt file, extra rows are filled as -1
| Pixel properties | Quadrant properties | ||||||
|---|---|---|---|---|---|---|---|
| Quadrant | DetID | PixID | Counts | Sigma | Mean | Median | Sigma |
| A | 15 | 223 | 7689697 | 80834.12 | 454 | 445 | 95.1 |
| A | 14 | 238 | 2122221 | 22305.41 | 454 | 445 | 95.1 |
| A | 10 | 83 | 797830 | 8382.6 | 454 | 445 | 95.1 |
| B | 5 | 235 | 180034 | 1305.15 | 701 | 682 | 137.4 |
| B | 5 | 172 | 85091 | 614.25 | 701 | 682 | 137.4 |
| B | 0 | 219 | 54832 | 394.05 | 701 | 682 | 137.4 |
| C | 1 | 241 | 147183 | 896.52 | 694 | 701 | 163.4 |
| C | 14 | 254 | 59678 | 360.96 | 694 | 701 | 163.4 |
| C | 11 | 16 | 49087 | 296.14 | 694 | 701 | 163.4 |
| D | 1 | 52 | 3797272 | 25419.33 | 590 | 571 | 149.4 |
| D | 2 | 249 | 1039352 | 6954.75 | 590 | 571 | 149.4 |
| D | 13 | 171 | 135295 | 901.99 | 590 | 571 | 149.4 |
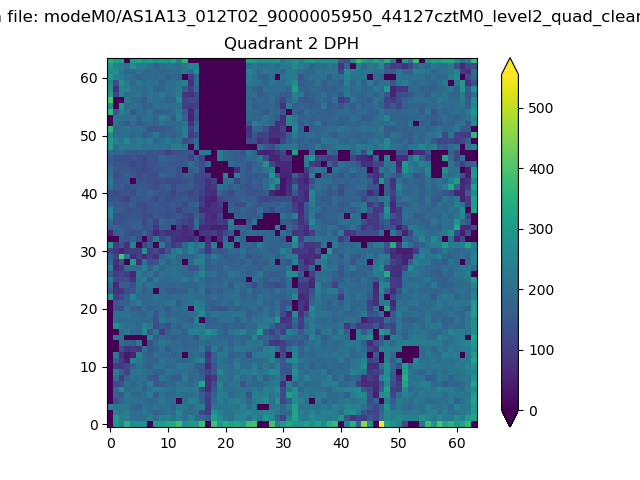
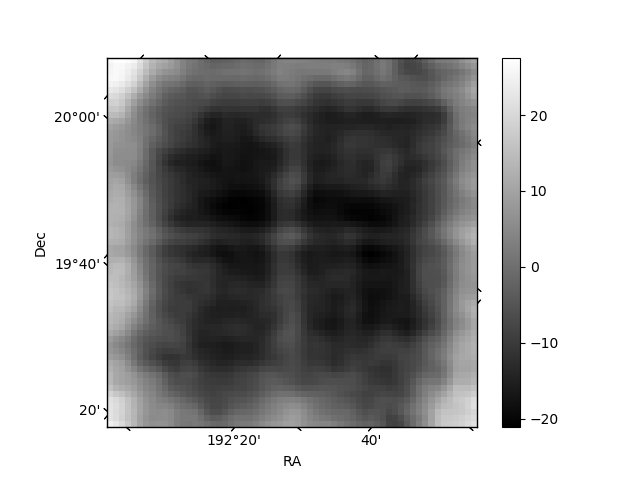
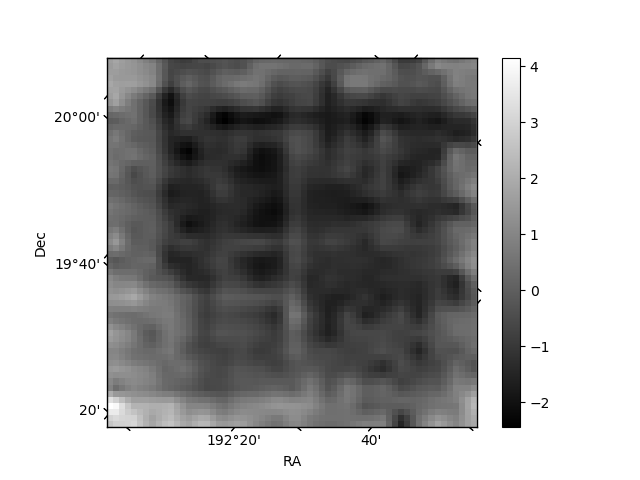
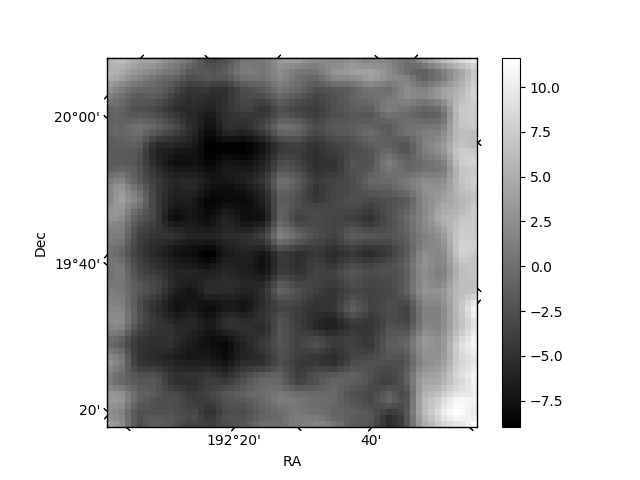
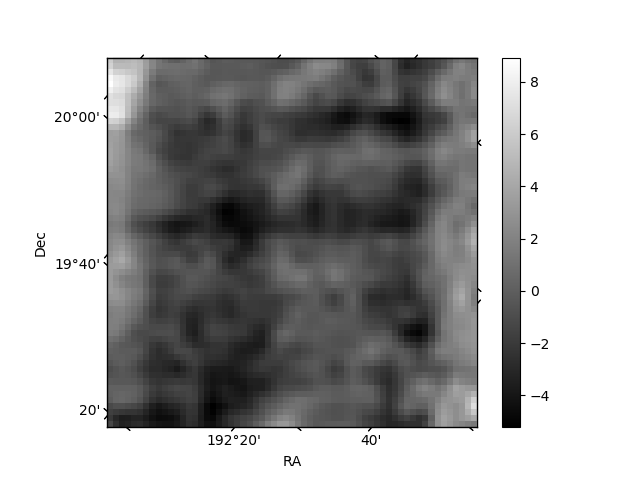
Histogram calculated using DETX and DETY for each event in the final _common_clean file
| Quadrant A | 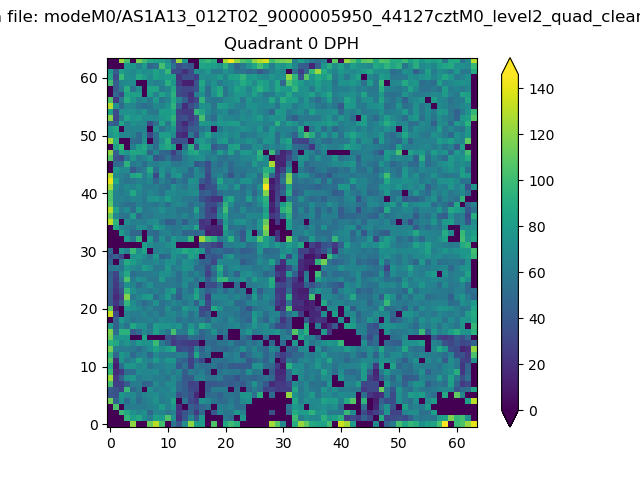 |
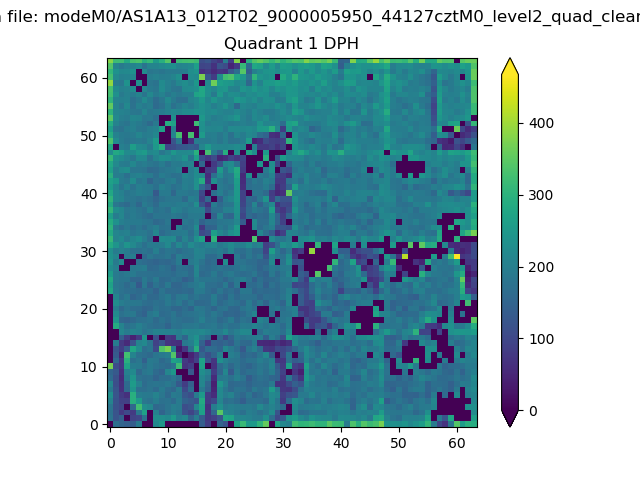 |
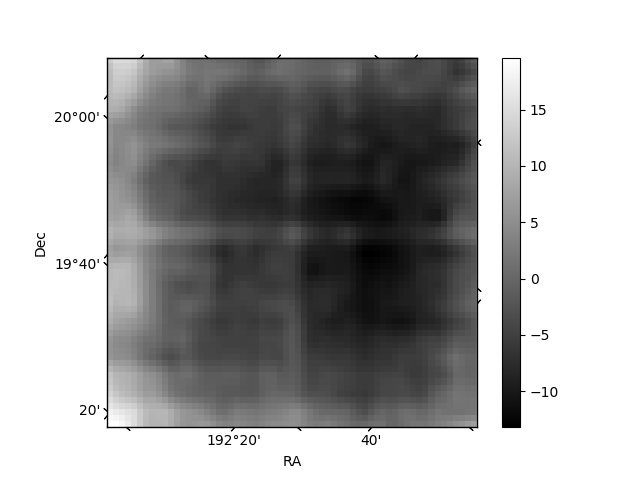
Quadrant B |
|---|---|---|---|
| Quadrant D | 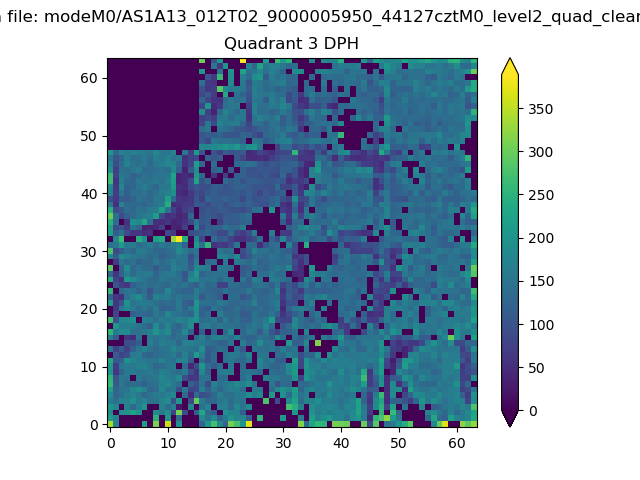 |
 |
Quadrant C |
| Plot type | Count rate plots | Images |
|---|---|---|
| Comparison with Poisson distribution Blue bars denote a histogram of data divided into 1 sec bins. Red curve is a Poisson curve with rate = median count rate of data. |
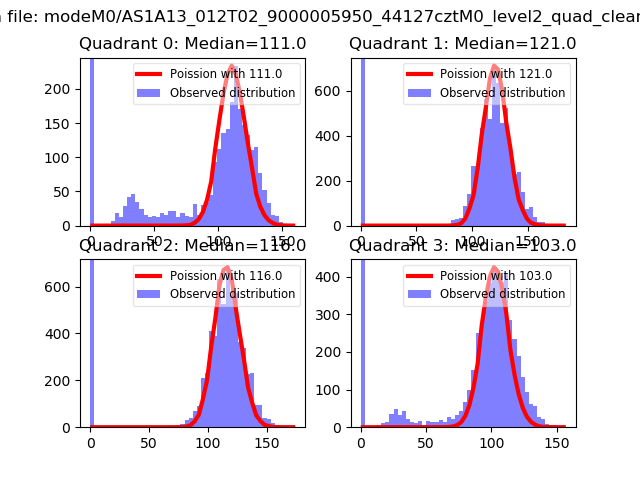 |
 |
| Quadrant-wise count rates Data is divided into 100 sec bins |
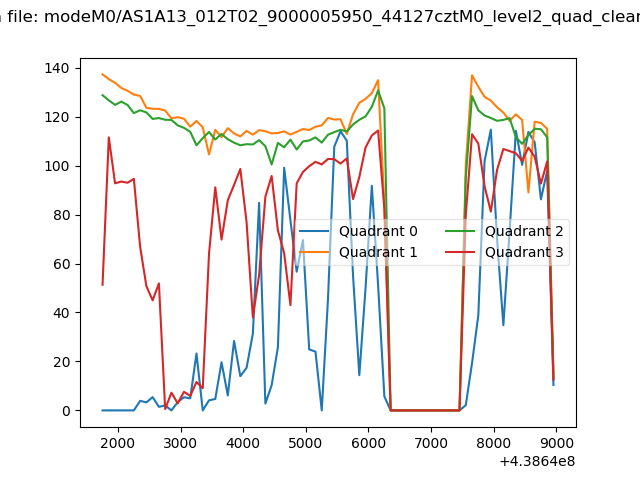 |
|
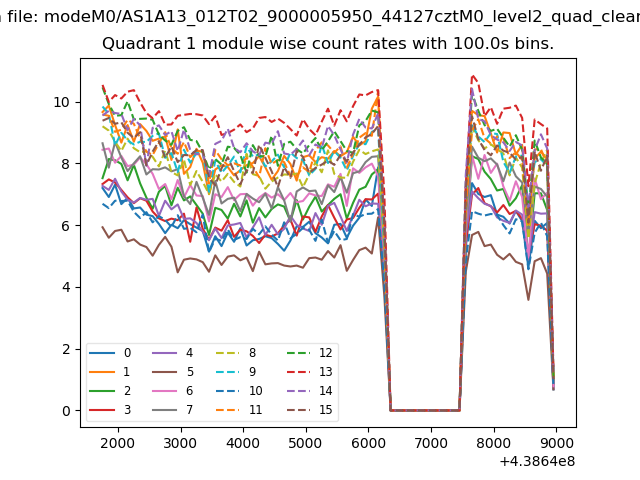
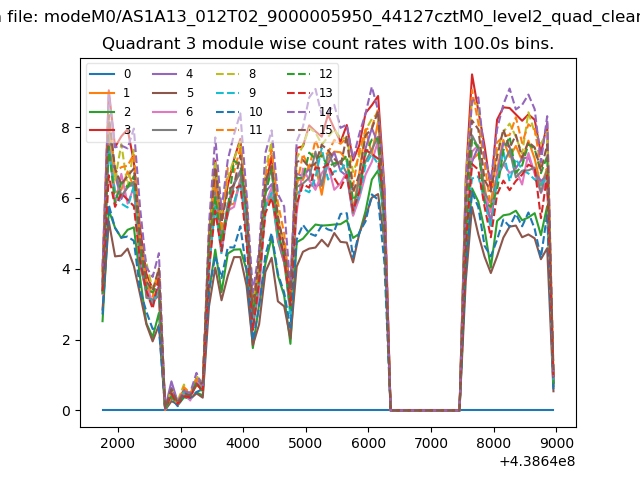
| Module-wise count rates for Quadrant A Data is divided into 100 sec bins |
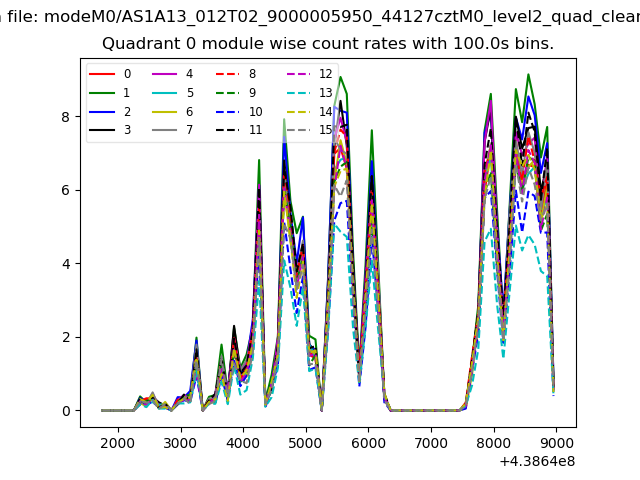 |
 |
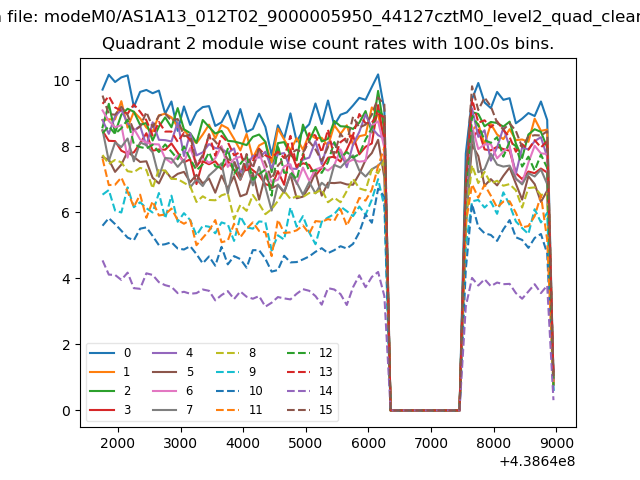
| Module-wise count rates for Quadrant B Data is divided into 100 sec bins |
 |
 |
| Module-wise count rates for Quadrant C Data is divided into 100 sec bins |
 |
 |
| Module-wise count rates for Quadrant D Data is divided into 100 sec bins |
 |
 |
| Parameter | Plot |
|---|---|
| CZT HV Monitor | 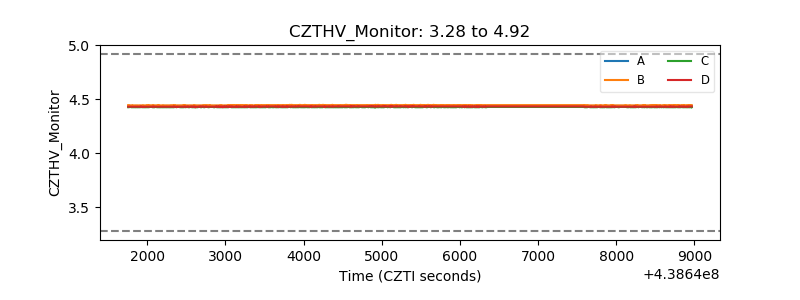 |
| D_VDD | 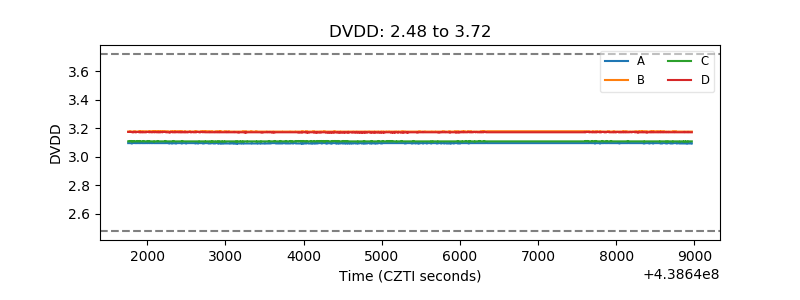 |
| Temperature 1 | 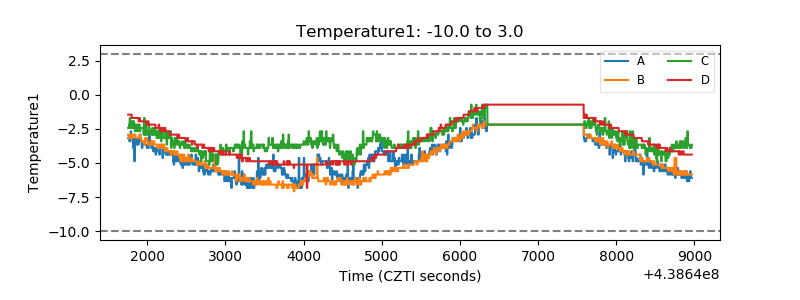 |
| Veto HV Monitor | 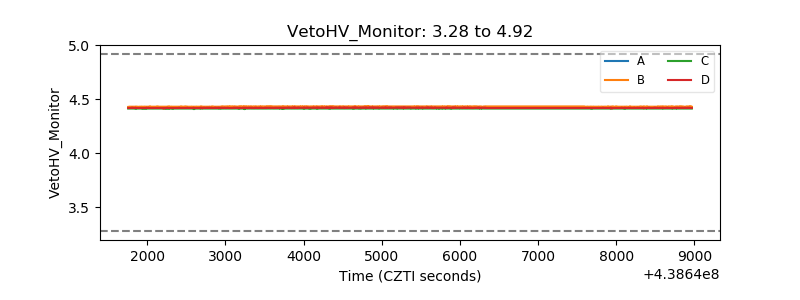 |
| Veto LLD | 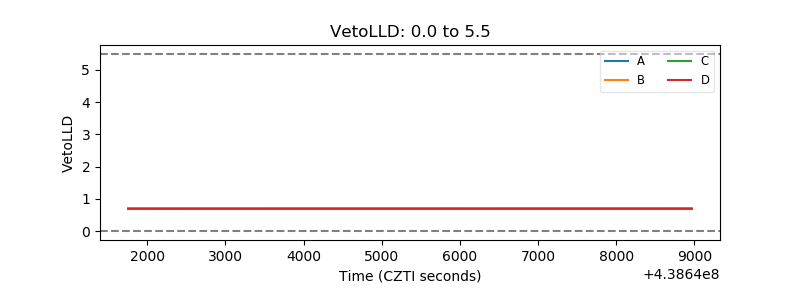 |
| Alpha Counter | 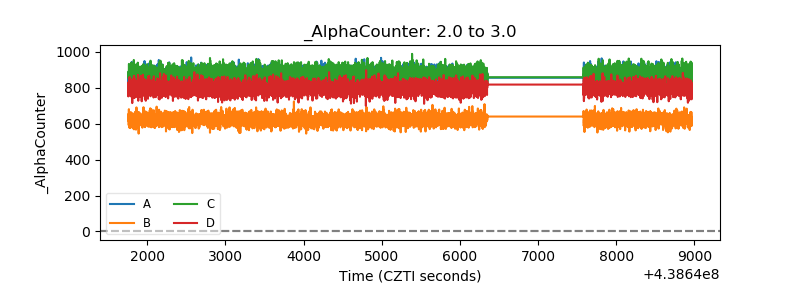 |
| _CPM_Rate | 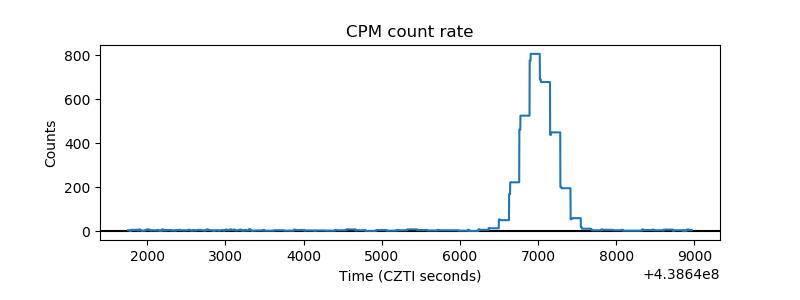 |
| CZT Counter | 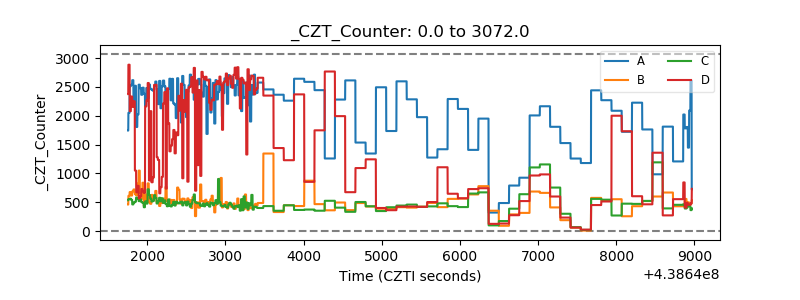 |
| +2.5 Volts monitor | 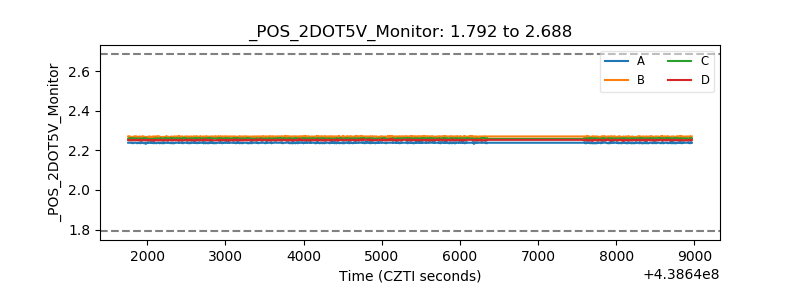 |
| +5 Volts monitor | 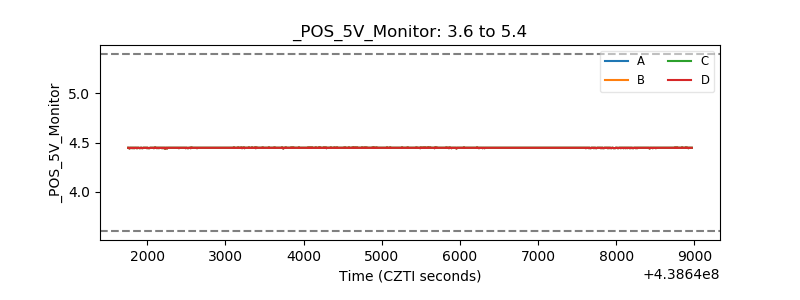 |
| _ROLL_ROT | 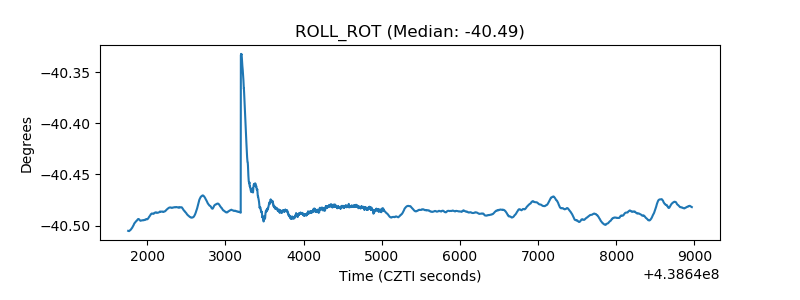 |
| _Roll_DEC | 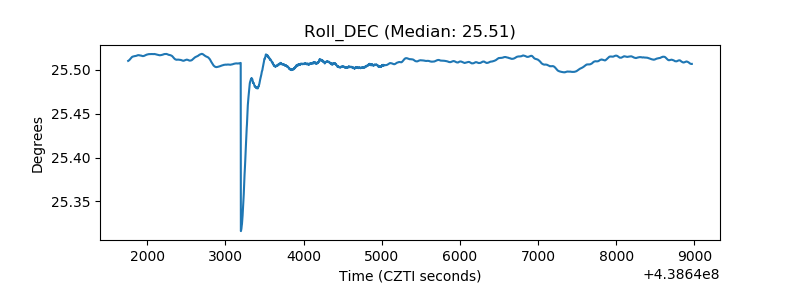 |
| _Roll_RA | 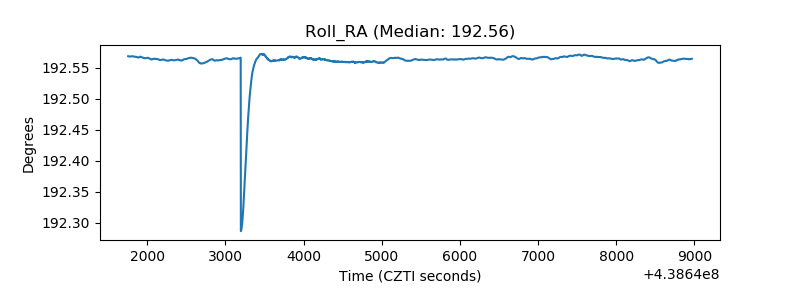 |
| Veto Counter | 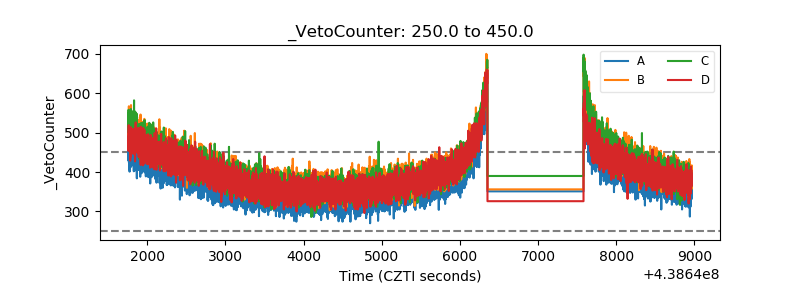 |