| Param | Original file | Final file |
|---|---|---|
| Filename | modeM0/AS1A13_012T02_9000005950_44128cztM0_level2.fits | modeM0/AS1A13_012T02_9000005950_44128cztM0_level2_quad_clean.evt |
| Size (bytes) | 584,179,200 | 105,356,160 |
| Size | 557.1 MB | 100.5 MB |
| Events in quadrant A | 9,748,789 | 560,685 |
| Events in quadrant B | 3,434,515 | 768,913 |
| Events in quadrant C | 3,197,715 | 742,218 |
| Events in quadrant D | 4,726,292 | 653,396 |
| Mode M9 | |||
|---|---|---|---|
| Quadrant | BADHDUFLAG | Total packets | Discarded packets |
| A | 0 | 12 | 0 |
| B | 0 | 13 | 0 |
| C | 0 | 13 | 0 |
| D | 0 | 13 | 0 |
| Mode SS | |||
|---|---|---|---|
| Quadrant | BADHDUFLAG | Total packets | Discarded packets |
| A | 0 | 136 | 0 |
| B | 0 | 136 | 0 |
| C | 0 | 136 | 0 |
| D | 0 | 136 | 0 |
| Mode M0 | |||
|---|---|---|---|
| Quadrant | BADHDUFLAG | Total packets | Discarded packets |
| A | 0 | 33703 | 2 |
| B | 0 | 14911 | 2 |
| C | 0 | 14319 | 2 |
| D | 0 | 18744 | 2 |
| Quadrant | Total seconds | Saturated seconds | Saturation percentage |
|---|---|---|---|
| A | 6664 | 1968 | 29.531813% |
| B | 6664 | 127 | 1.905762% |
| C | 6664 | 77 | 1.155462% |
| D | 6664 | 320 | 4.801921% |
Noise dominated data is calculated using 1-second bins in cleaned event files. If a bin has >2000 counts, and if more than 50% of those come from <1% of pixels, then it is considered to be noise-dominated and hence unusable.
| Quadrant | # 1 sec bins | Bins with >0 counts | Bins with >2000 counts | High rate bins dominated by noise | Noise dominated (total time) | Noise dominated (detector-on time) | Marked lightcurve |
|---|---|---|---|---|---|---|---|
| A | 7684 | 6665 | 1526 | 1526 | 19.86% | 22.90% | 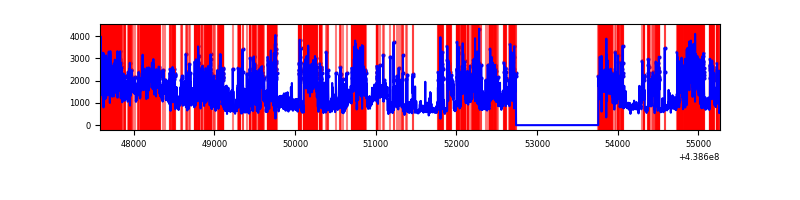 |
| B | 7684 | 6664 | 33 | 33 | 0.43% | 0.50% | 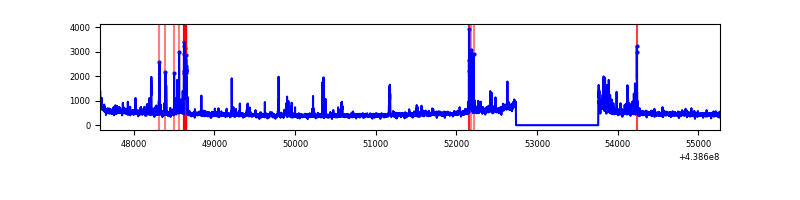 |
| C | 7684 | 6664 | 44 | 44 | 0.57% | 0.66% | 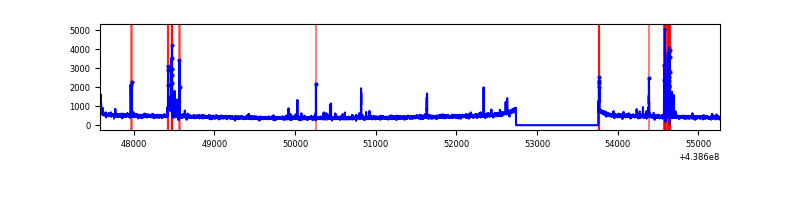 |
| D | 7684 | 6664 | 252 | 252 | 3.28% | 3.78% | 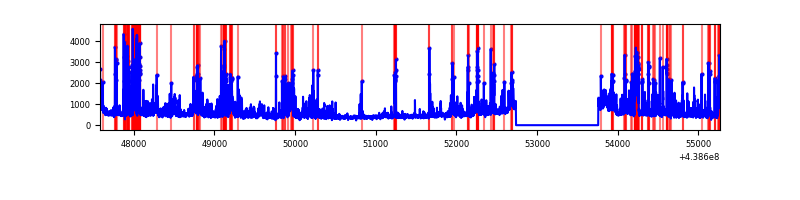 |
Top three noisy pixels from each quadrant. If the there are fewer than three noisy pixels in the level2.evt file, extra rows are filled as -1
| Pixel properties | Quadrant properties | ||||||
|---|---|---|---|---|---|---|---|
| Quadrant | DetID | PixID | Counts | Sigma | Mean | Median | Sigma |
| A | 15 | 223 | 4248731 | 29750.89 | 683 | 670 | 142.8 |
| A | 14 | 238 | 1490208 | 10431.84 | 683 | 670 | 142.8 |
| A | 10 | 83 | 1283734 | 8985.82 | 683 | 670 | 142.8 |
| B | 5 | 235 | 140909 | 928.79 | 767 | 744 | 150.9 |
| B | 5 | 172 | 119573 | 787.41 | 767 | 744 | 150.9 |
| B | 0 | 219 | 51893 | 338.93 | 767 | 744 | 150.9 |
| C | 14 | 254 | 159339 | 891.91 | 752 | 759 | 177.8 |
| C | 1 | 241 | 80461 | 448.27 | 752 | 759 | 177.8 |
| C | 4 | 111 | 19181 | 103.61 | 752 | 759 | 177.8 |
| D | 1 | 52 | 848262 | 4471.17 | 739 | 715 | 189.6 |
| D | 5 | 235 | 282402 | 1486.02 | 739 | 715 | 189.6 |
| D | 2 | 249 | 268258 | 1411.4 | 739 | 715 | 189.6 |
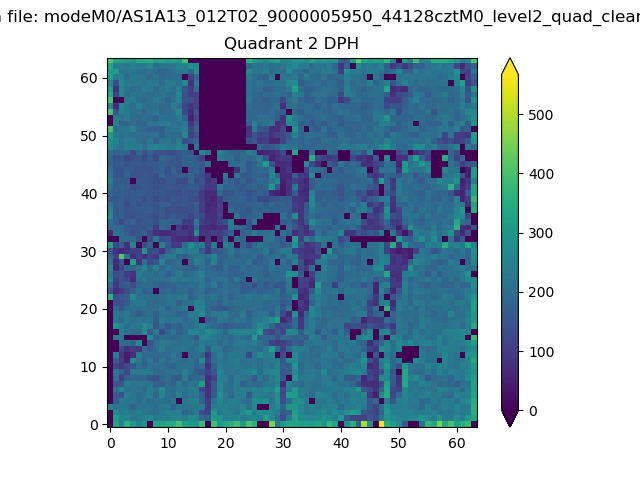
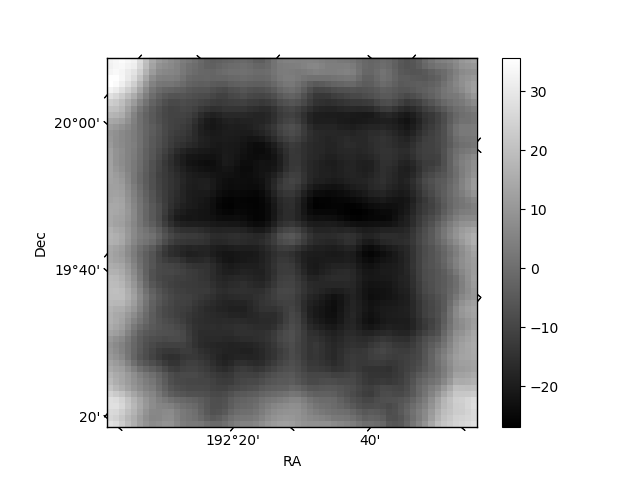
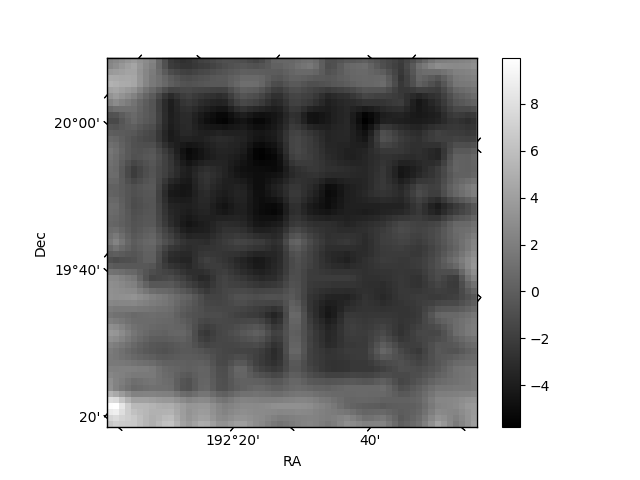
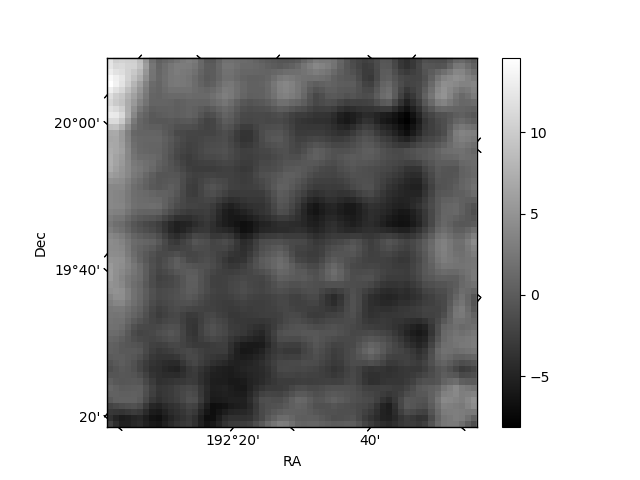
Histogram calculated using DETX and DETY for each event in the final _common_clean file
| Quadrant A | 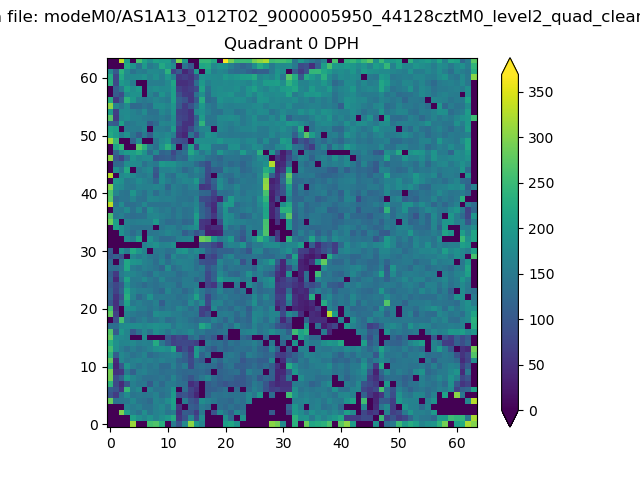 |
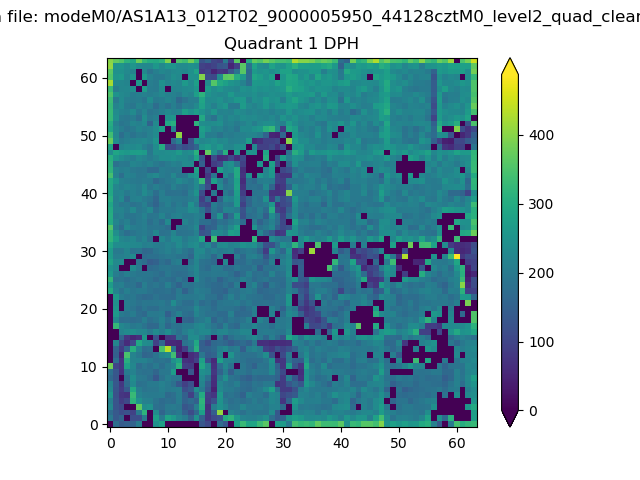 |
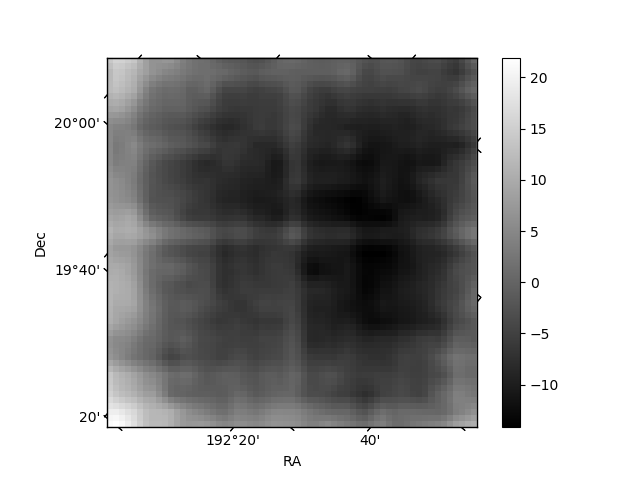
Quadrant B |
|---|---|---|---|
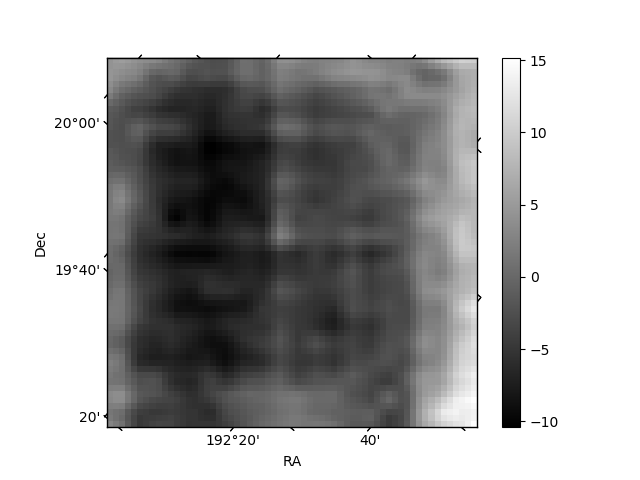
| Quadrant D | 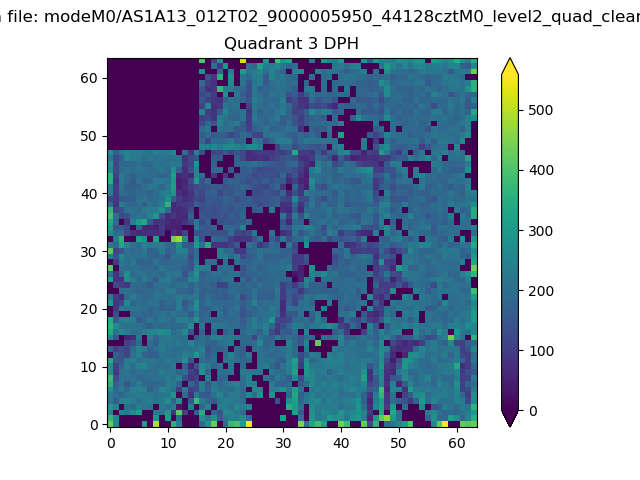 |
 |
Quadrant C |
| Plot type | Count rate plots | Images |
|---|---|---|
| Comparison with Poisson distribution Blue bars denote a histogram of data divided into 1 sec bins. Red curve is a Poisson curve with rate = median count rate of data. |
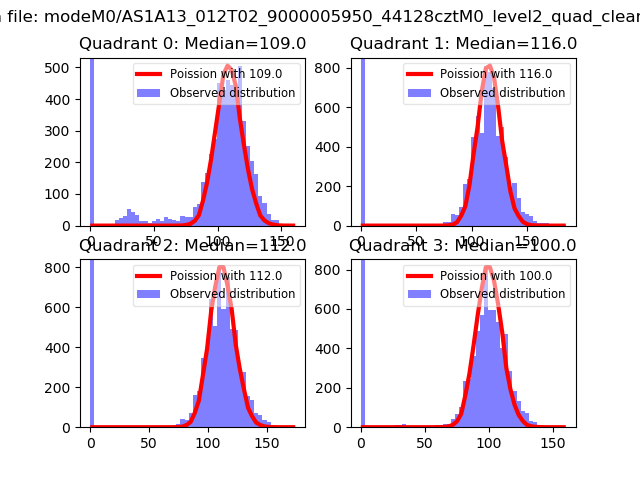 |
 |
| Quadrant-wise count rates Data is divided into 100 sec bins |
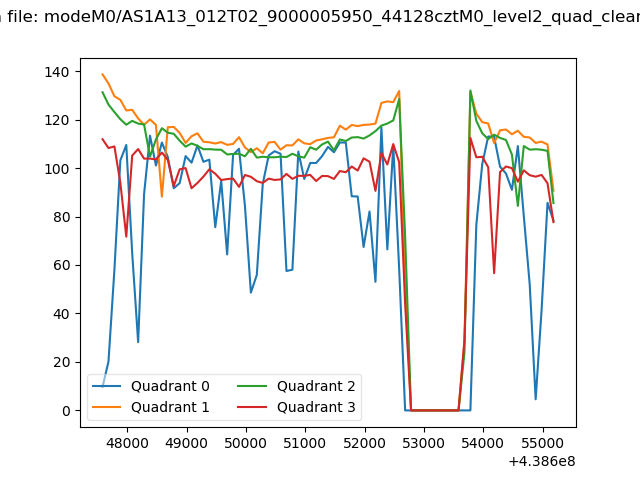 |
|
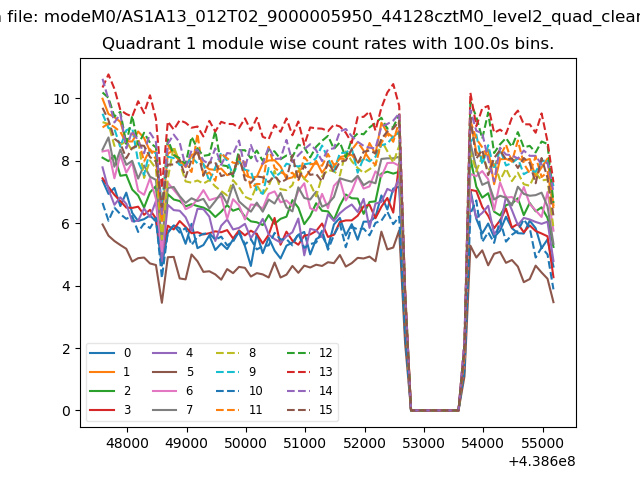
| Module-wise count rates for Quadrant A Data is divided into 100 sec bins |
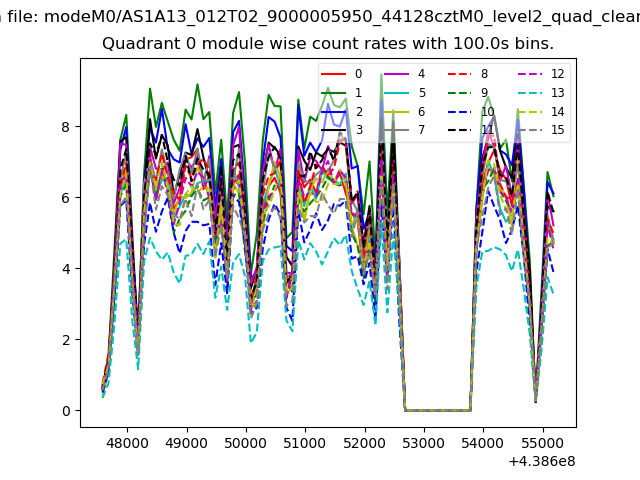 |
 |
| Module-wise count rates for Quadrant B Data is divided into 100 sec bins |
 |
 |
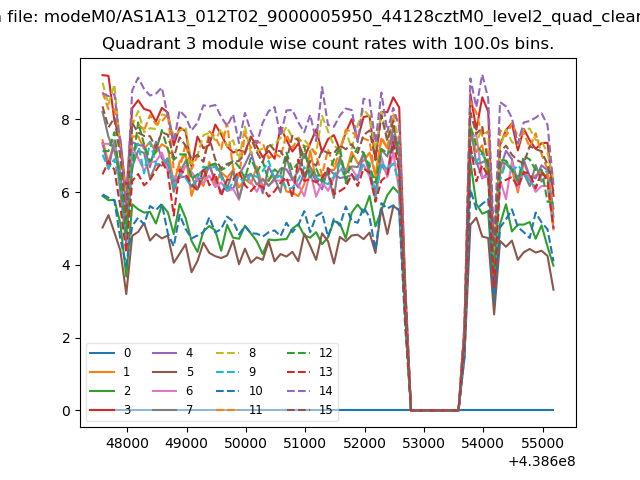
| Module-wise count rates for Quadrant C Data is divided into 100 sec bins |
 |
 |
| Module-wise count rates for Quadrant D Data is divided into 100 sec bins |
 |
 |
| Parameter | Plot |
|---|---|
| CZT HV Monitor | 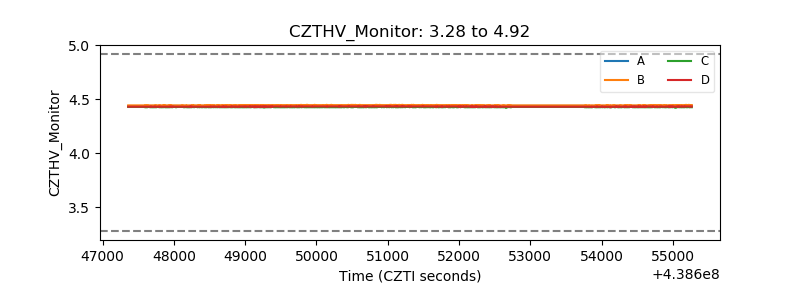 |
| D_VDD |  |
| Temperature 1 | 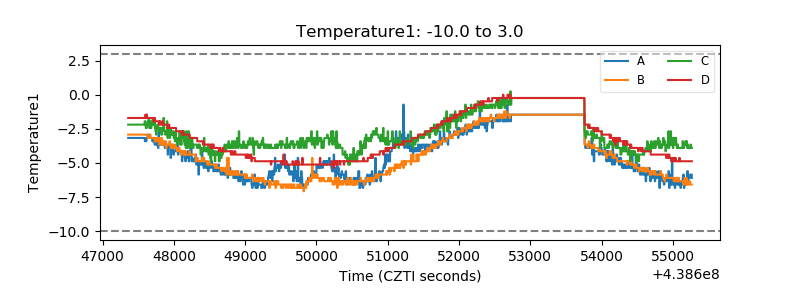 |
| Veto HV Monitor | 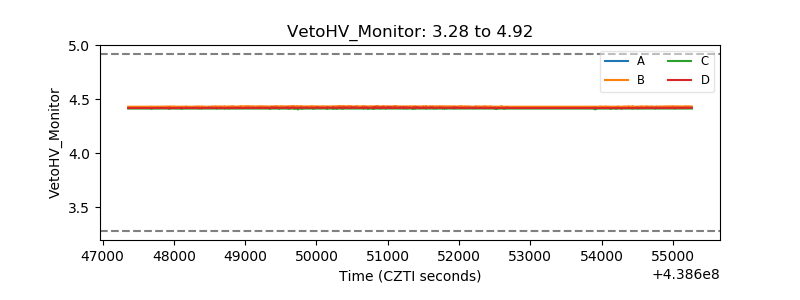 |
| Veto LLD | 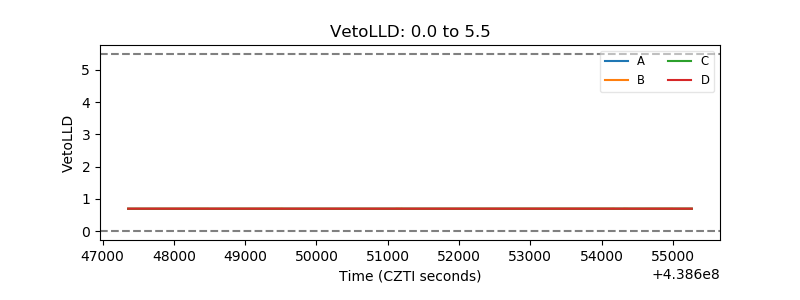 |
| Alpha Counter | 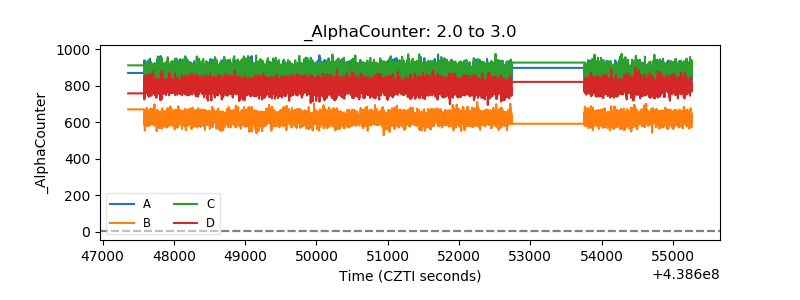 |
| _CPM_Rate | 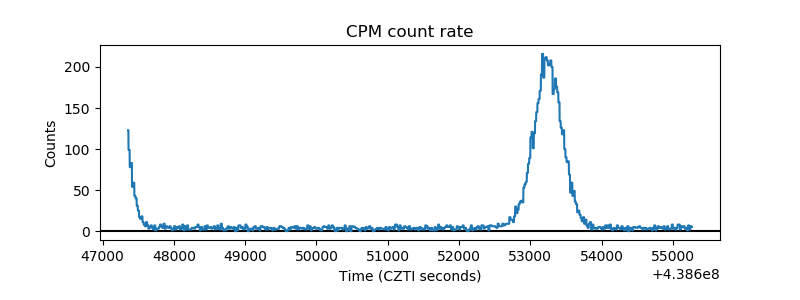 |
| CZT Counter | 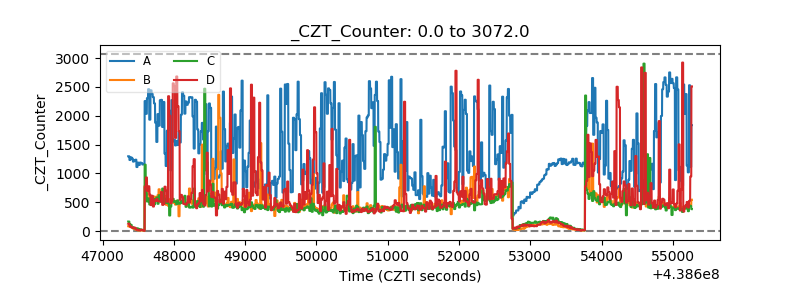 |
| +2.5 Volts monitor | 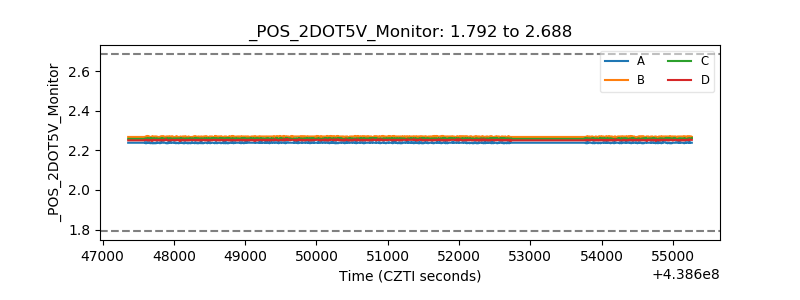 |
| +5 Volts monitor | 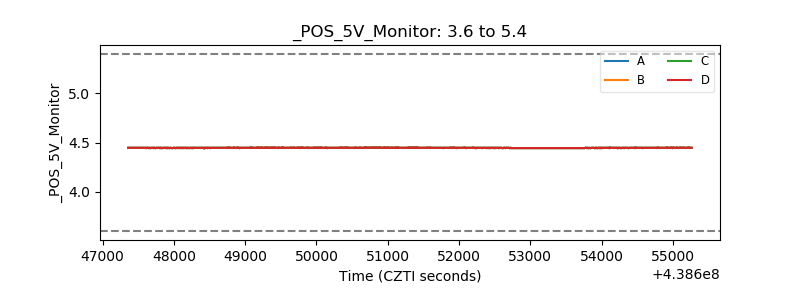 |
| _ROLL_ROT | 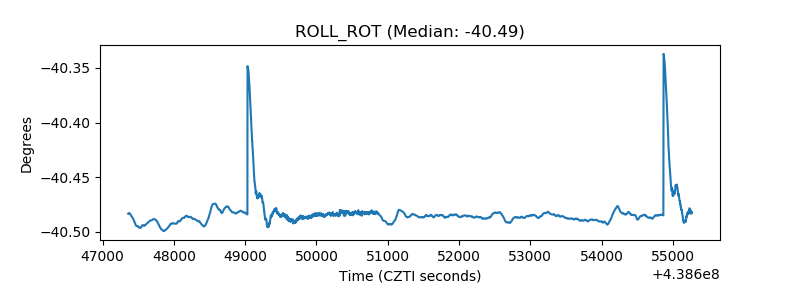 |
| _Roll_DEC | 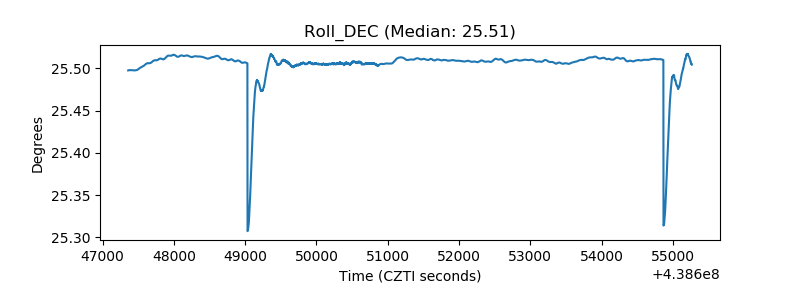 |
| _Roll_RA | 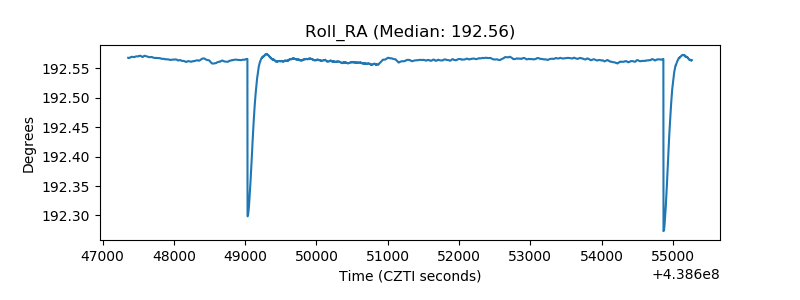 |
| Veto Counter | 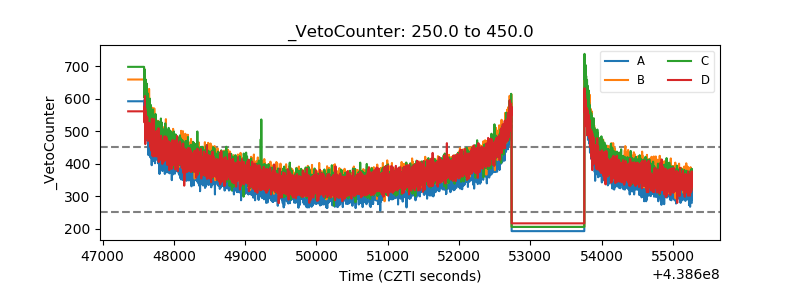 |