| Param | Original file | Final file |
|---|---|---|
| Filename | modeM0/AS1A13_012T02_9000005950_44129cztM0_level2.fits | modeM0/AS1A13_012T02_9000005950_44129cztM0_level2_quad_clean.evt |
| Size (bytes) | 610,591,680 | 109,255,680 |
| Size | 582.3 MB | 104.2 MB |
| Events in quadrant A | 8,356,948 | 658,240 |
| Events in quadrant B | 3,503,729 | 781,457 |
| Events in quadrant C | 3,393,901 | 749,421 |
| Events in quadrant D | 6,801,370 | 628,023 |
| Mode M9 | |||
|---|---|---|---|
| Quadrant | BADHDUFLAG | Total packets | Discarded packets |
| A | 0 | 6 | 0 |
| B | 0 | 6 | 0 |
| C | 0 | 6 | 0 |
| D | 0 | 6 | 0 |
| Mode SS | |||
|---|---|---|---|
| Quadrant | BADHDUFLAG | Total packets | Discarded packets |
| A | 0 | 142 | 0 |
| B | 0 | 142 | 0 |
| C | 0 | 142 | 0 |
| D | 0 | 142 | 0 |
| Mode M0 | |||
|---|---|---|---|
| Quadrant | BADHDUFLAG | Total packets | Discarded packets |
| A | 0 | 29903 | 1 |
| B | 0 | 15551 | 1 |
| C | 0 | 15332 | 1 |
| D | 0 | 25023 | 2 |
| Quadrant | Total seconds | Saturated seconds | Saturation percentage |
|---|---|---|---|
| A | 7050 | 1170 | 16.595745% |
| B | 7050 | 91 | 1.290780% |
| C | 7051 | 76 | 1.077861% |
| D | 7050 | 735 | 10.425532% |
Noise dominated data is calculated using 1-second bins in cleaned event files. If a bin has >2000 counts, and if more than 50% of those come from <1% of pixels, then it is considered to be noise-dominated and hence unusable.
| Quadrant | # 1 sec bins | Bins with >0 counts | Bins with >2000 counts | High rate bins dominated by noise | Noise dominated (total time) | Noise dominated (detector-on time) | Marked lightcurve |
|---|---|---|---|---|---|---|---|
| A | 7660 | 7051 | 1069 | 1069 | 13.96% | 15.16% | 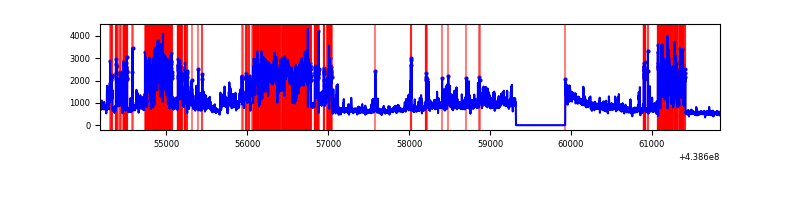 |
| B | 7660 | 7051 | 34 | 34 | 0.44% | 0.48% | 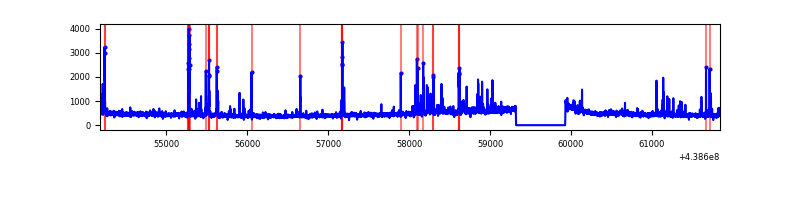 |
| C | 7661 | 7052 | 49 | 49 | 0.64% | 0.69% | 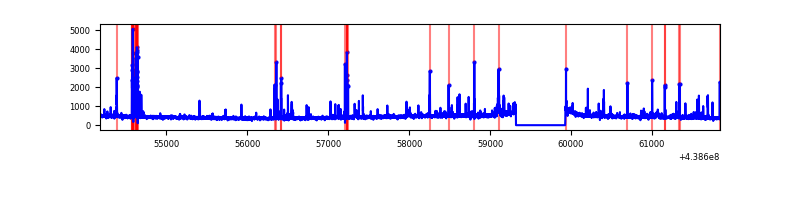 |
| D | 7660 | 7051 | 653 | 653 | 8.52% | 9.26% | 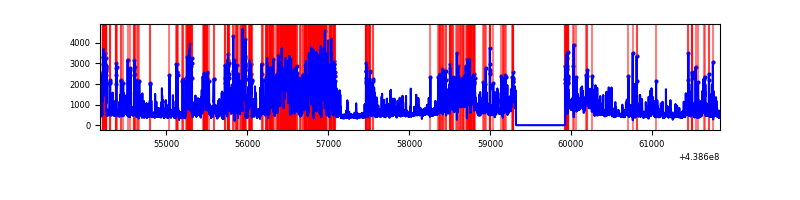 |
Top three noisy pixels from each quadrant. If the there are fewer than three noisy pixels in the level2.evt file, extra rows are filled as -1
| Pixel properties | Quadrant properties | ||||||
|---|---|---|---|---|---|---|---|
| Quadrant | DetID | PixID | Counts | Sigma | Mean | Median | Sigma |
| A | 15 | 223 | 4088802 | 26369.59 | 745 | 730 | 155.0 |
| A | 10 | 83 | 1263330 | 8144.24 | 745 | 730 | 155.0 |
| A | 14 | 238 | 34048 | 214.91 | 745 | 730 | 155.0 |
| B | 5 | 172 | 129642 | 837.43 | 780 | 759 | 153.9 |
| B | 5 | 235 | 70715 | 454.54 | 780 | 759 | 153.9 |
| B | 0 | 219 | 65637 | 421.55 | 780 | 759 | 153.9 |
| C | 14 | 254 | 313325 | 1720.46 | 765 | 768 | 181.7 |
| C | 12 | 16 | 41465 | 224.01 | 765 | 768 | 181.7 |
| C | 1 | 241 | 32604 | 175.24 | 765 | 768 | 181.7 |
| D | 1 | 52 | 1487991 | 8013.76 | 730 | 706 | 185.6 |
| D | 5 | 235 | 1190755 | 6412.2 | 730 | 706 | 185.6 |
| D | 1 | 47 | 731135 | 3935.68 | 730 | 706 | 185.6 |
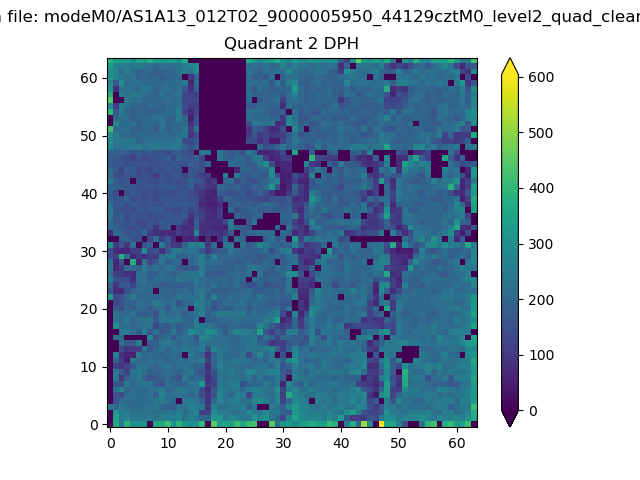
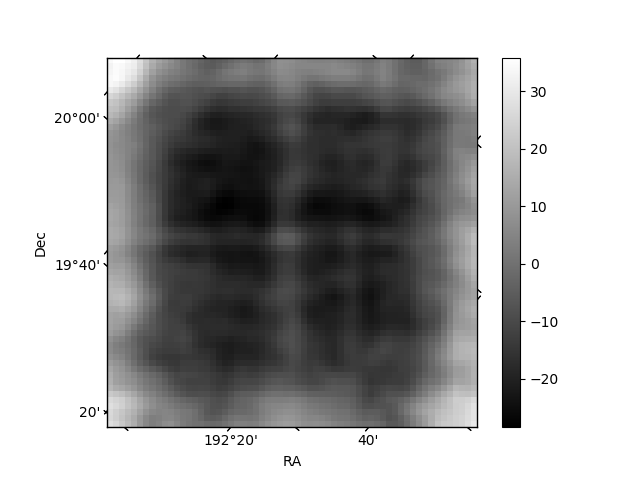
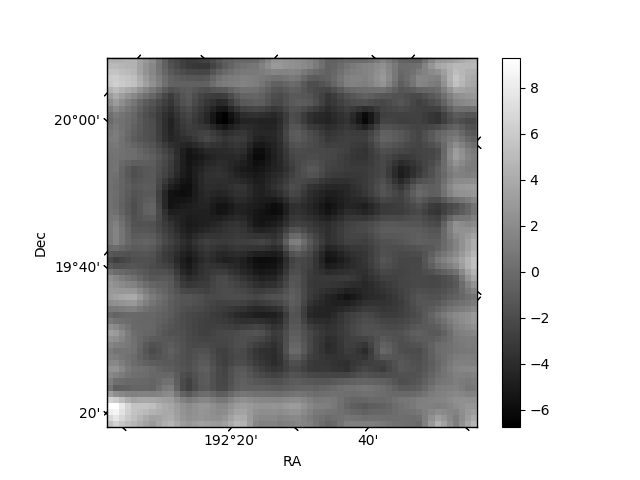
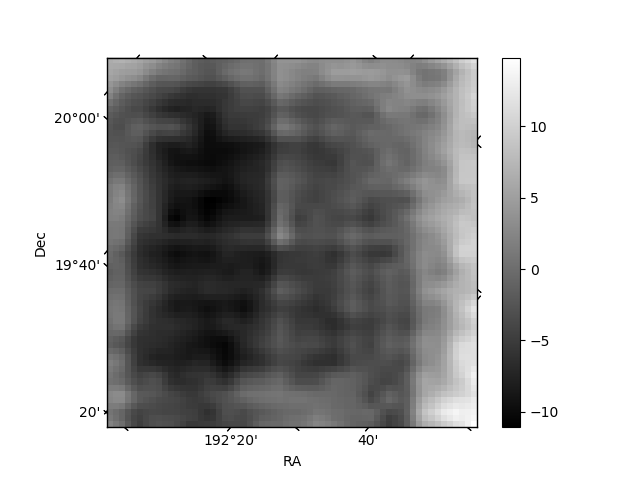
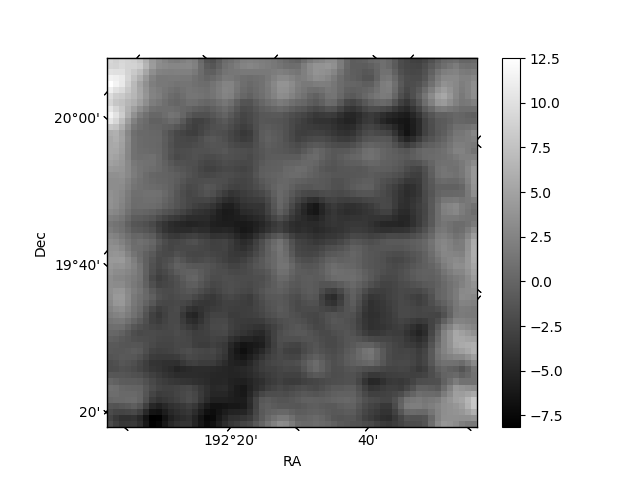
Histogram calculated using DETX and DETY for each event in the final _common_clean file
| Quadrant A | 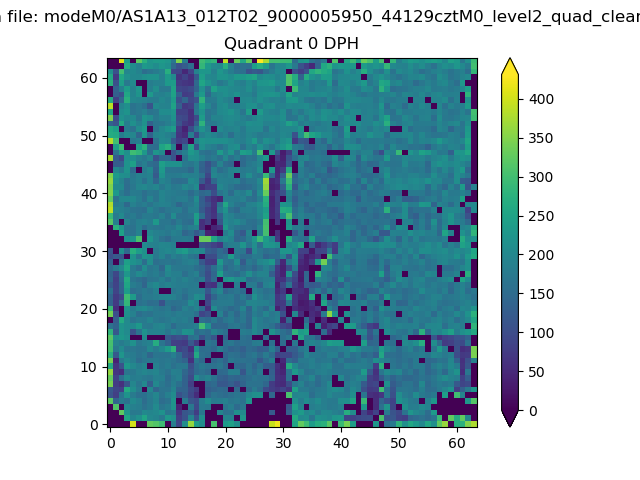 |
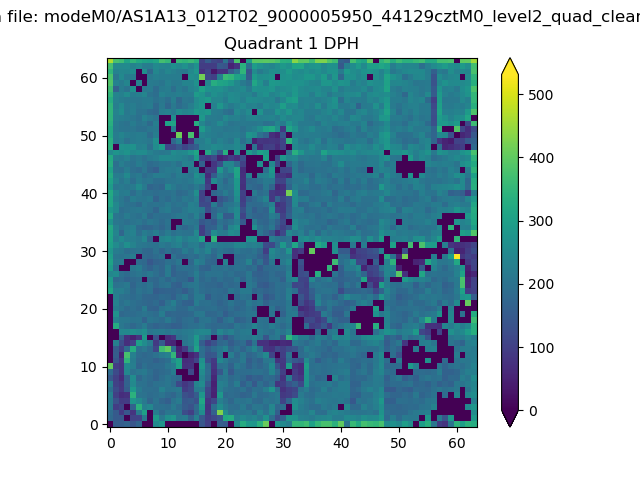 |
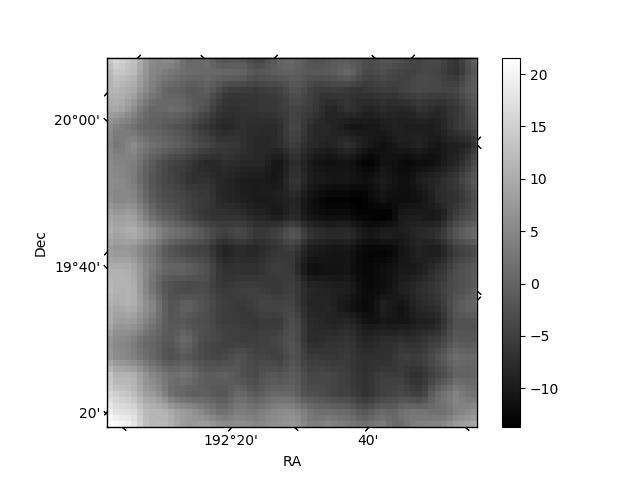
Quadrant B |
|---|---|---|---|
| Quadrant D | 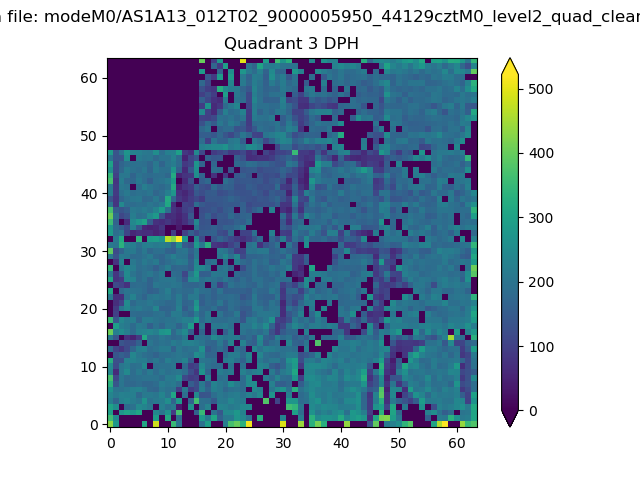 |
 |
Quadrant C |
| Plot type | Count rate plots | Images |
|---|---|---|
| Comparison with Poisson distribution Blue bars denote a histogram of data divided into 1 sec bins. Red curve is a Poisson curve with rate = median count rate of data. |
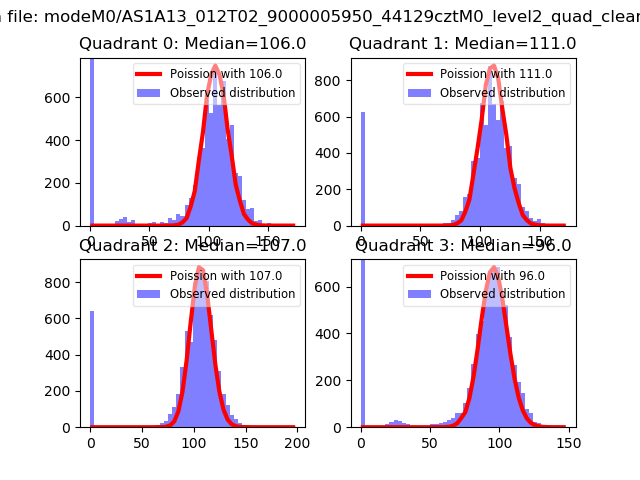 |
 |
| Quadrant-wise count rates Data is divided into 100 sec bins |
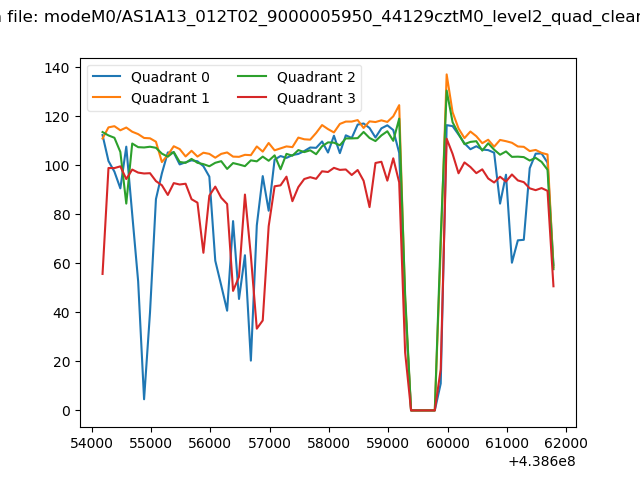 |
|
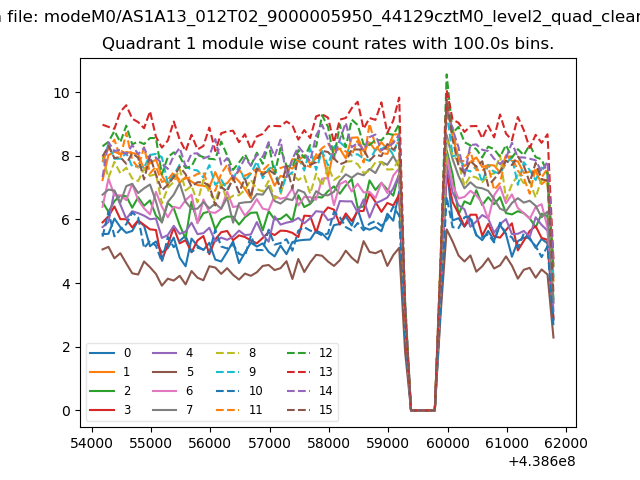
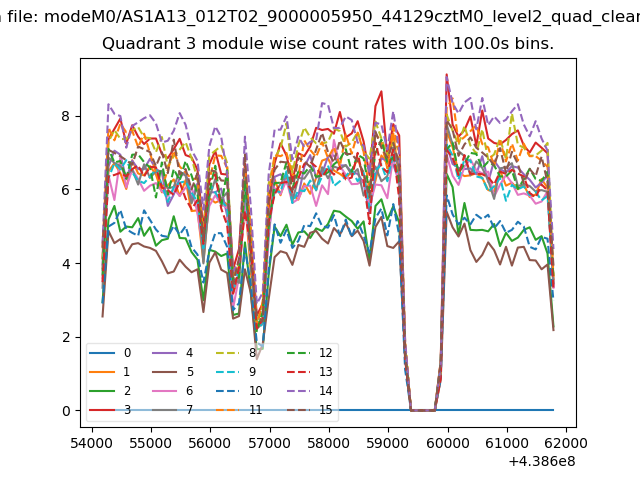
| Module-wise count rates for Quadrant A Data is divided into 100 sec bins |
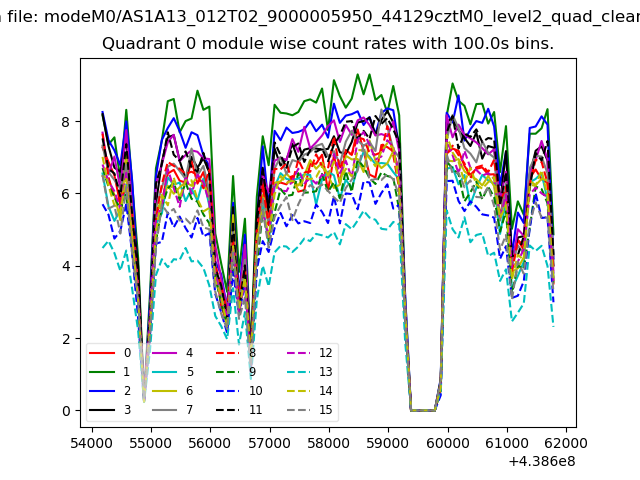 |
 |
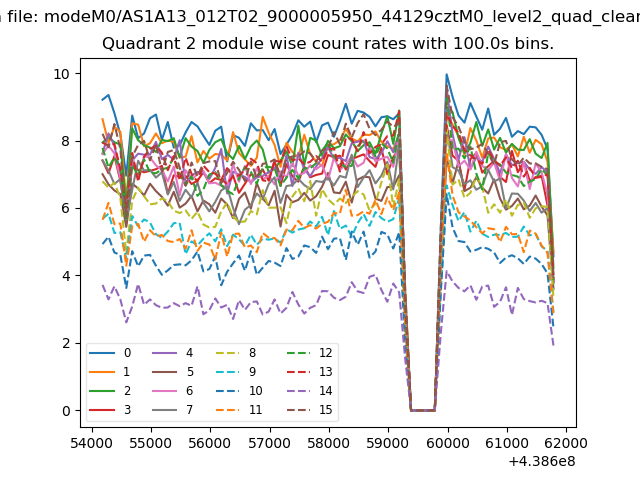
| Module-wise count rates for Quadrant B Data is divided into 100 sec bins |
 |
 |
| Module-wise count rates for Quadrant C Data is divided into 100 sec bins |
 |
 |
| Module-wise count rates for Quadrant D Data is divided into 100 sec bins |
 |
 |
| Parameter | Plot |
|---|---|
| CZT HV Monitor | 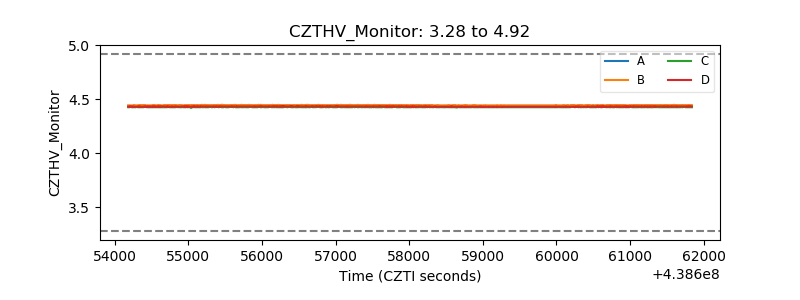 |
| D_VDD | 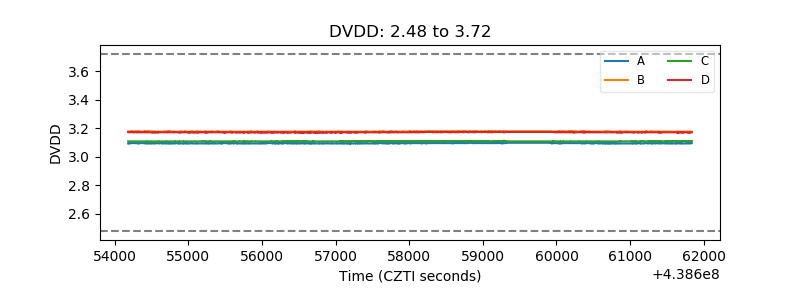 |
| Temperature 1 | 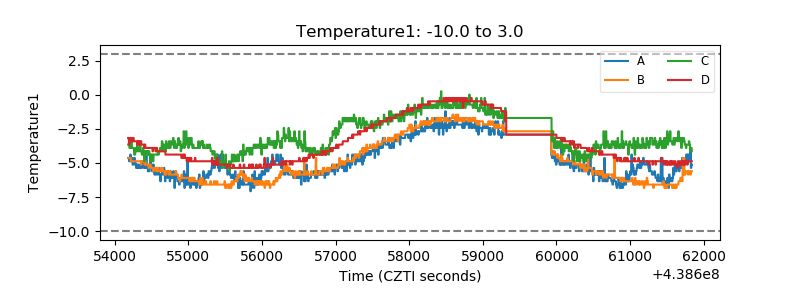 |
| Veto HV Monitor | 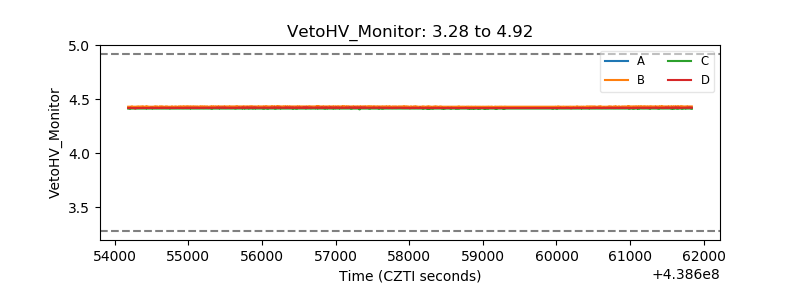 |
| Veto LLD | 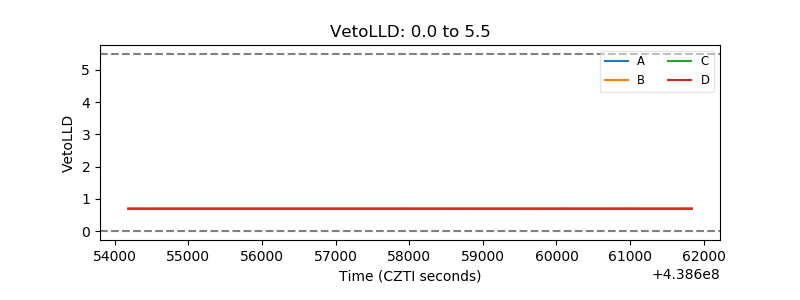 |
| Alpha Counter | 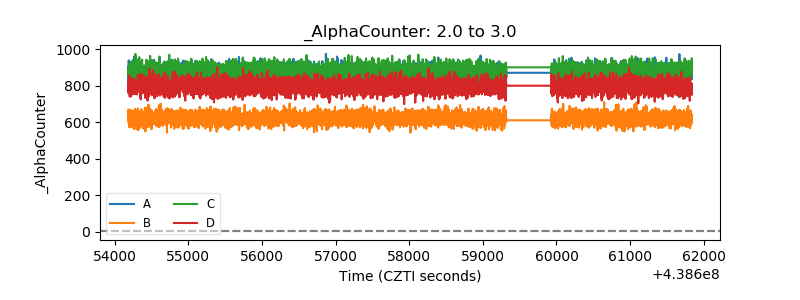 |
| _CPM_Rate | 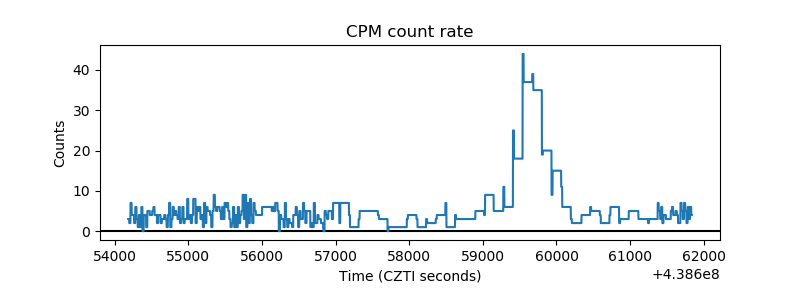 |
| CZT Counter | 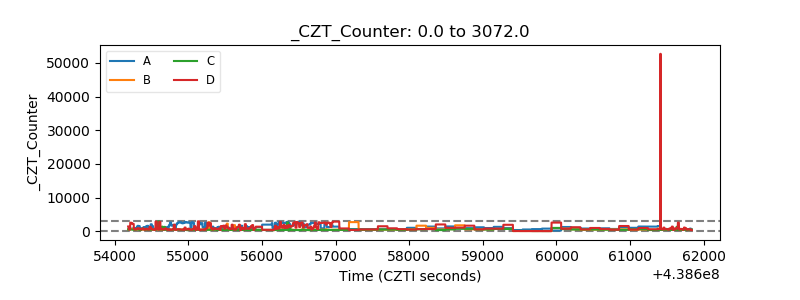 |
| +2.5 Volts monitor | 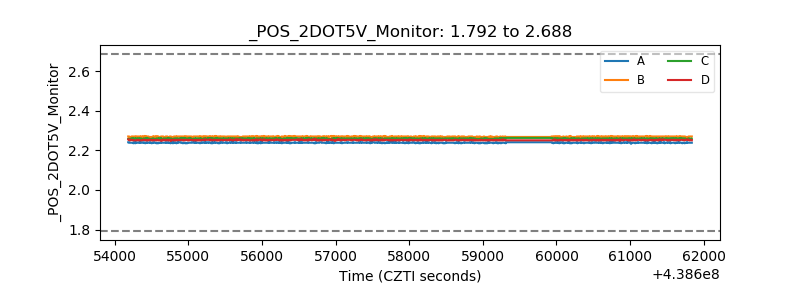 |
| +5 Volts monitor | 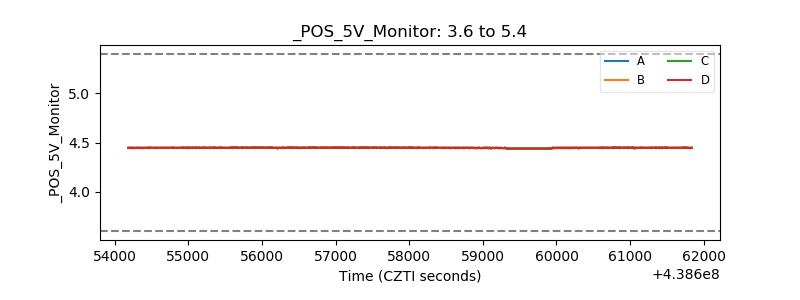 |
| _ROLL_ROT | 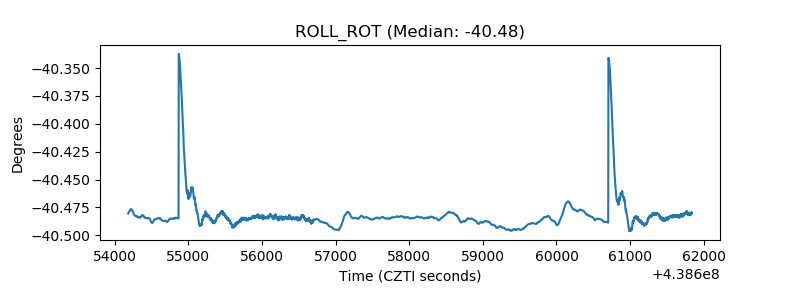 |
| _Roll_DEC | 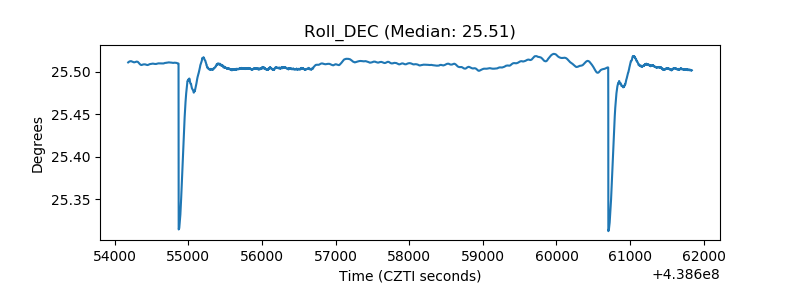 |
| _Roll_RA | 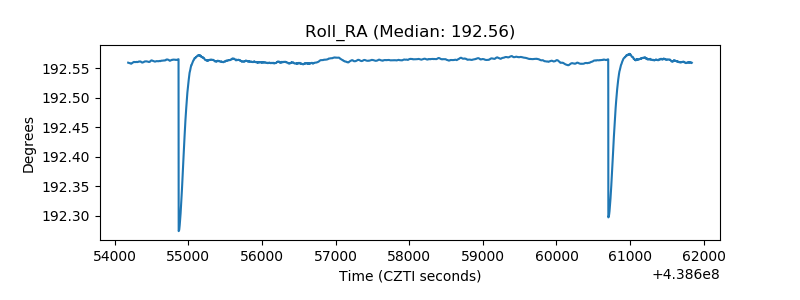 |
| Veto Counter | 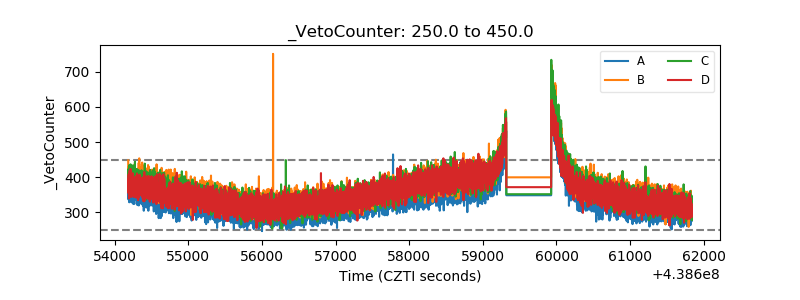 |