| Param | Original file | Final file |
|---|---|---|
| Filename | modeM0/AS1A13_012T02_9000005950_44130cztM0_level2.fits | modeM0/AS1A13_012T02_9000005950_44130cztM0_level2_quad_clean.evt |
| Size (bytes) | 468,025,920 | 104,915,520 |
| Size | 446.3 MB | 100.1 MB |
| Events in quadrant A | 4,216,089 | 713,028 |
| Events in quadrant B | 3,440,380 | 726,228 |
| Events in quadrant C | 3,083,506 | 702,669 |
| Events in quadrant D | 6,069,669 | 572,278 |
| Mode M9 | |||
|---|---|---|---|
| Quadrant | BADHDUFLAG | Total packets | Discarded packets |
| A | 1 | 139707716339752 | 139706696204334 |
| B | 1 | -1 | -1 |
| C | 1 | -1 | -1 |
| D | 1 | -1 | -1 |
| Mode SS | |||
|---|---|---|---|
| Quadrant | BADHDUFLAG | Total packets | Discarded packets |
| A | 0 | 135 | 1 |
| B | 0 | 134 | 0 |
| C | 0 | 134 | 2 |
| D | 0 | 134 | 0 |
| Mode M0 | |||
|---|---|---|---|
| Quadrant | BADHDUFLAG | Total packets | Discarded packets |
| A | 0 | 16840 | 104 |
| B | 0 | 15147 | 72 |
| C | 0 | 14251 | 71 |
| D | 0 | 22770 | 164 |
| Quadrant | Total seconds | Saturated seconds | Saturation percentage |
|---|---|---|---|
| A | 6631 | 57 | 0.859599% |
| B | 6633 | 124 | 1.869441% |
| C | 6632 | 20 | 0.301568% |
| D | 6623 | 775 | 11.701646% |
Noise dominated data is calculated using 1-second bins in cleaned event files. If a bin has >2000 counts, and if more than 50% of those come from <1% of pixels, then it is considered to be noise-dominated and hence unusable.
| Quadrant | # 1 sec bins | Bins with >0 counts | Bins with >2000 counts | High rate bins dominated by noise | Noise dominated (total time) | Noise dominated (detector-on time) | Marked lightcurve |
|---|---|---|---|---|---|---|---|
| A | 6638 | 6636 | 21 | 21 | 0.32% | 0.32% |  |
| B | 6640 | 6638 | 67 | 67 | 1.01% | 1.01% |  |
| C | 6634 | 6633 | 13 | 13 | 0.20% | 0.20% |  |
| D | 6631 | 6631 | 706 | 706 | 10.65% | 10.65% |  |
Top three noisy pixels from each quadrant. If the there are fewer than three noisy pixels in the level2.evt file, extra rows are filled as -1
| Pixel properties | Quadrant properties | ||||||
|---|---|---|---|---|---|---|---|
| Quadrant | DetID | PixID | Counts | Sigma | Mean | Median | Sigma |
| A | 10 | 83 | 1104402 | 7004.96 | 747 | 732 | 157.6 |
| A | 14 | 31 | 111171 | 700.95 | 747 | 732 | 157.6 |
| A | 14 | 238 | 44647 | 278.73 | 747 | 732 | 157.6 |
| B | 5 | 172 | 292758 | 1977.25 | 743 | 721 | 147.7 |
| B | 4 | 171 | 84867 | 569.72 | 743 | 721 | 147.7 |
| B | 5 | 235 | 44403 | 295.75 | 743 | 721 | 147.7 |
| C | 14 | 254 | 103746 | 591.37 | 732 | 737 | 174.2 |
| C | 12 | 249 | 73711 | 418.94 | 732 | 737 | 174.2 |
| C | 1 | 241 | 21077 | 116.77 | 732 | 737 | 174.2 |
| D | 5 | 235 | 1772122 | 9979.75 | 695 | 676 | 177.5 |
| D | 1 | 52 | 529187 | 2977.46 | 695 | 676 | 177.5 |
| D | 2 | 249 | 419791 | 2361.16 | 695 | 676 | 177.5 |
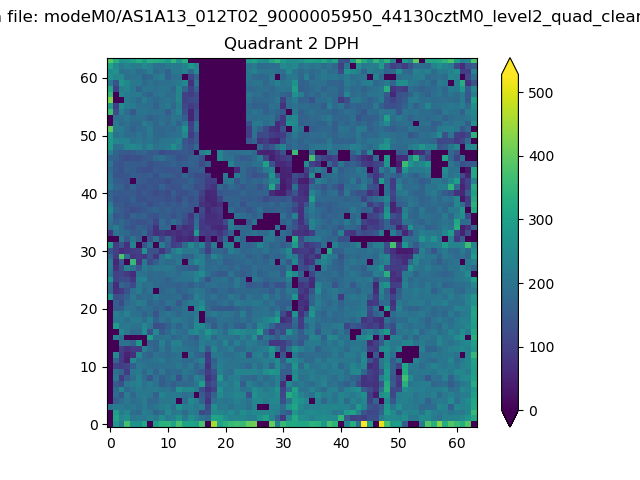
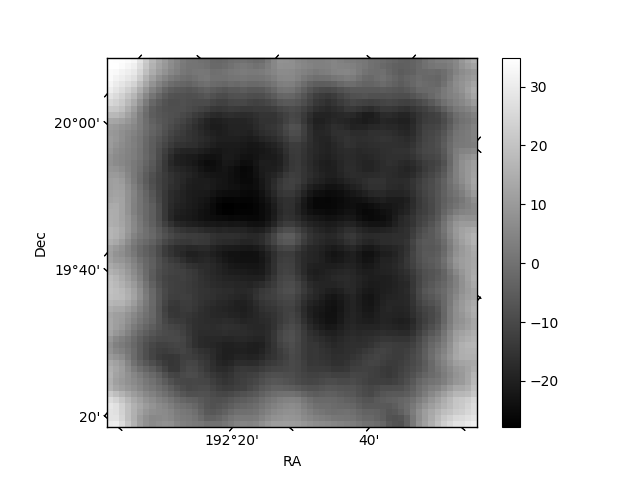
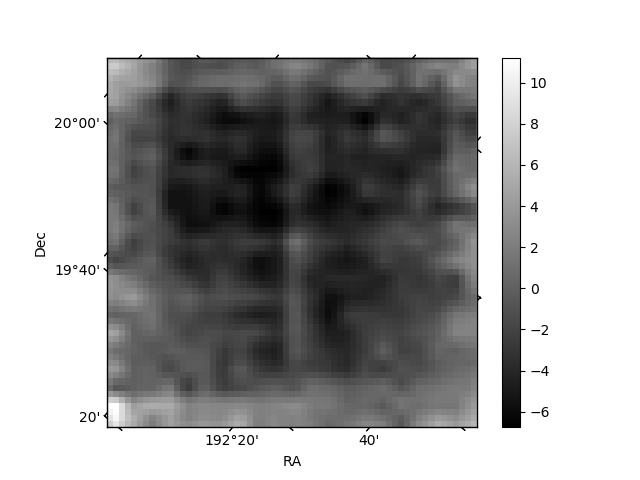
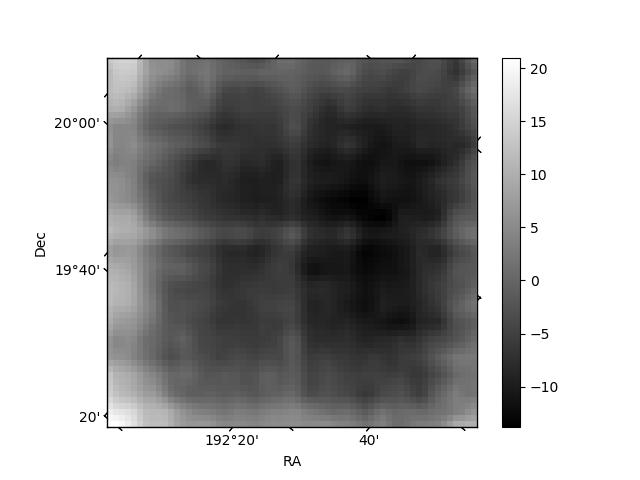
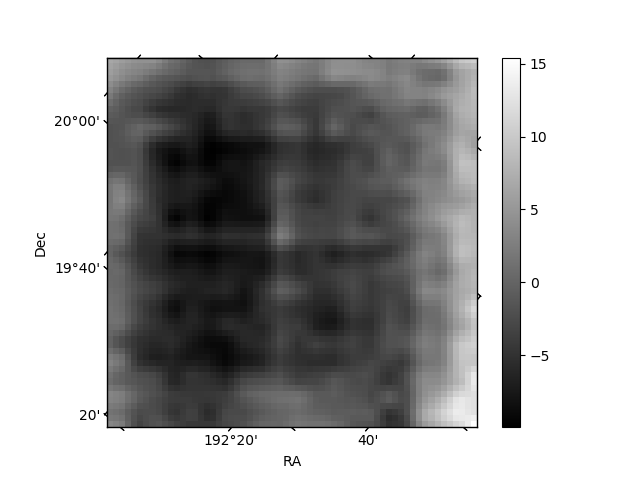
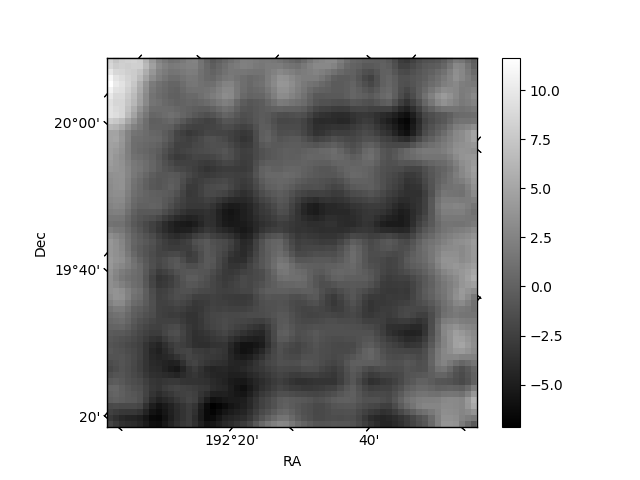
Histogram calculated using DETX and DETY for each event in the final _common_clean file
| Quadrant A | 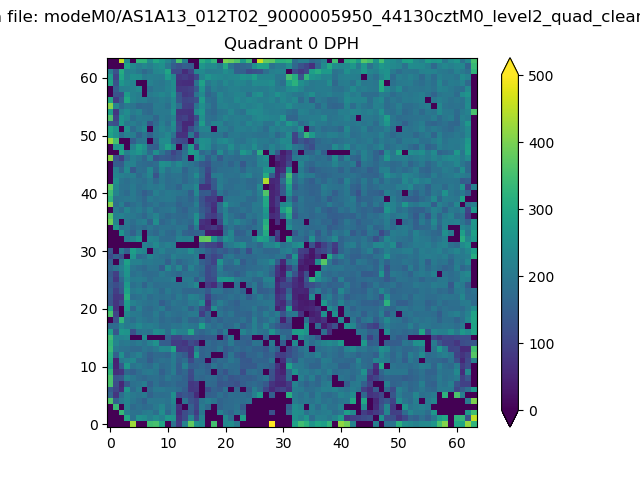 |
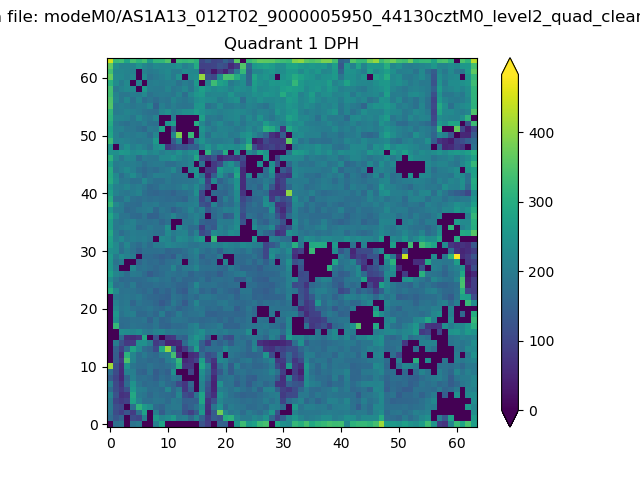 |
Quadrant B |
|---|---|---|---|
| Quadrant D | 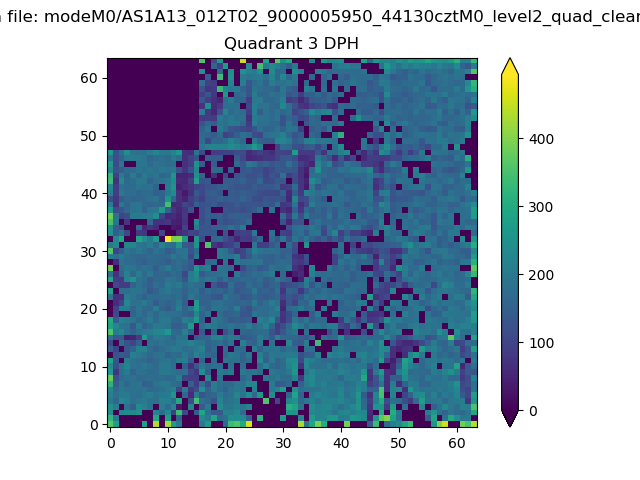 |
 |
Quadrant C |
| Plot type | Count rate plots | Images |
|---|---|---|
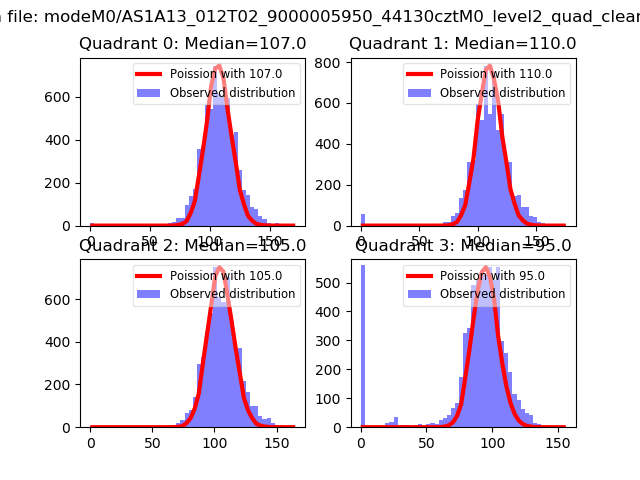
| Comparison with Poisson distribution Blue bars denote a histogram of data divided into 1 sec bins. Red curve is a Poisson curve with rate = median count rate of data. |
 |
 |
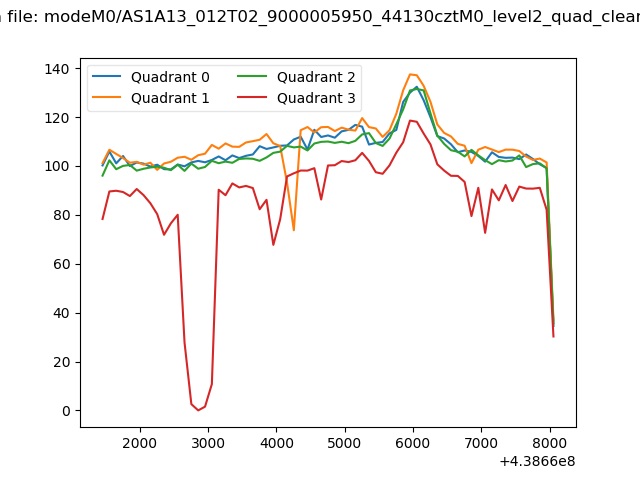
| Quadrant-wise count rates Data is divided into 100 sec bins |
 |
|
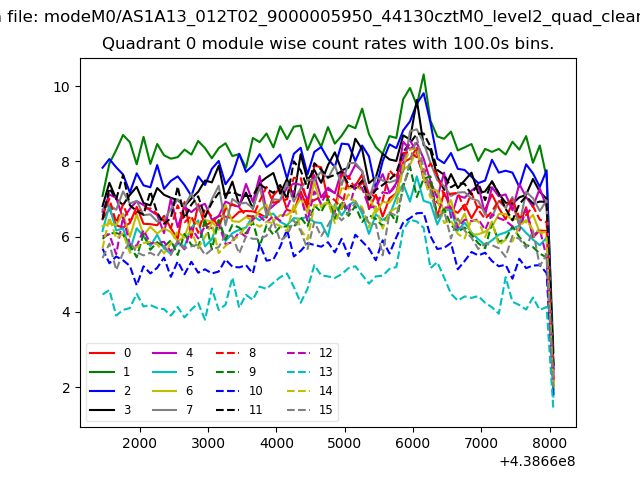
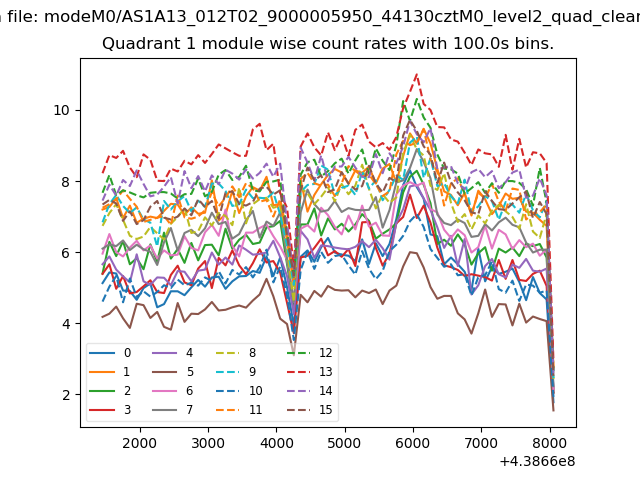
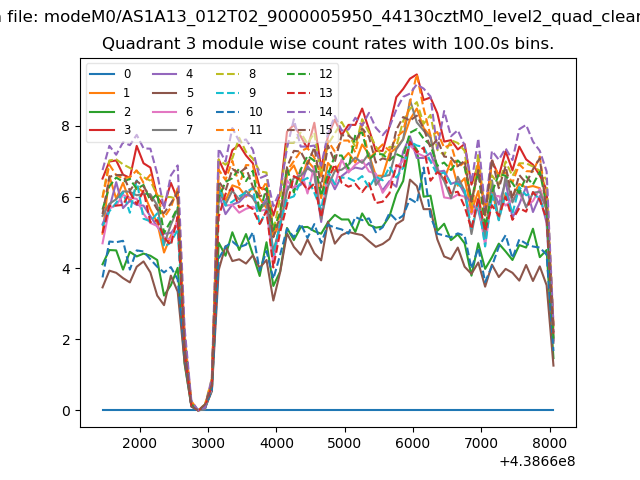
| Module-wise count rates for Quadrant A Data is divided into 100 sec bins |
 |
 |
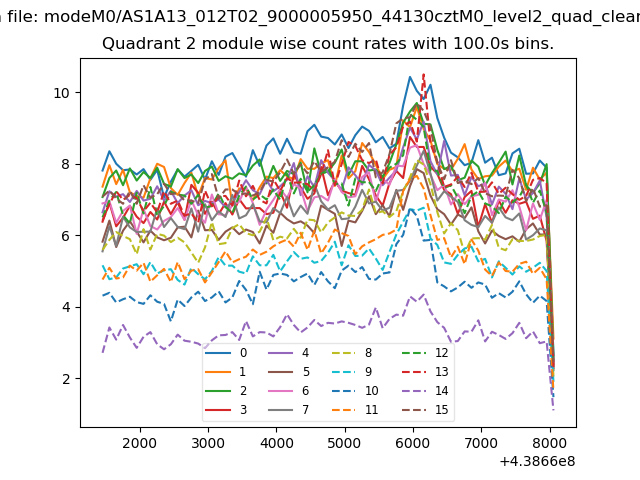
| Module-wise count rates for Quadrant B Data is divided into 100 sec bins |
 |
 |
| Module-wise count rates for Quadrant C Data is divided into 100 sec bins |
 |
 |
| Module-wise count rates for Quadrant D Data is divided into 100 sec bins |
 |
 |
| Parameter | Plot |
|---|---|
| CZT HV Monitor | 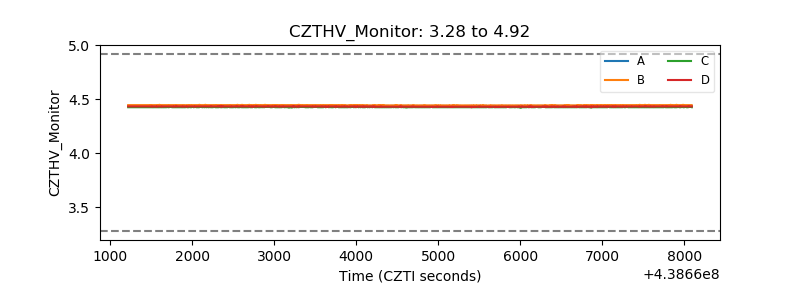 |
| D_VDD | 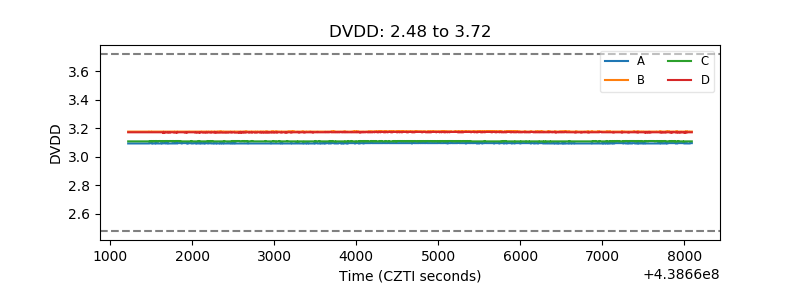 |
| Temperature 1 | 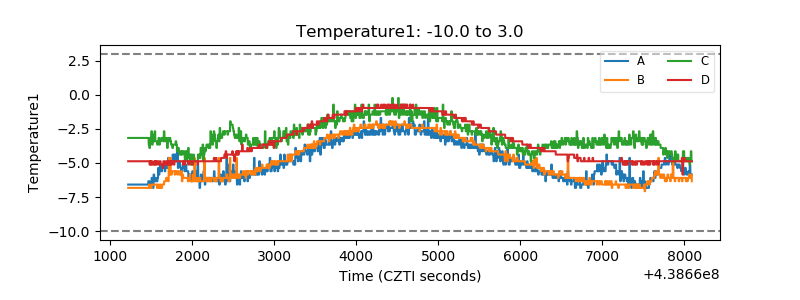 |
| Veto HV Monitor | 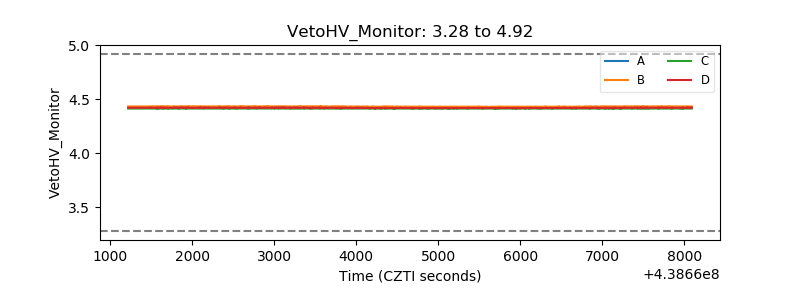 |
| Veto LLD | 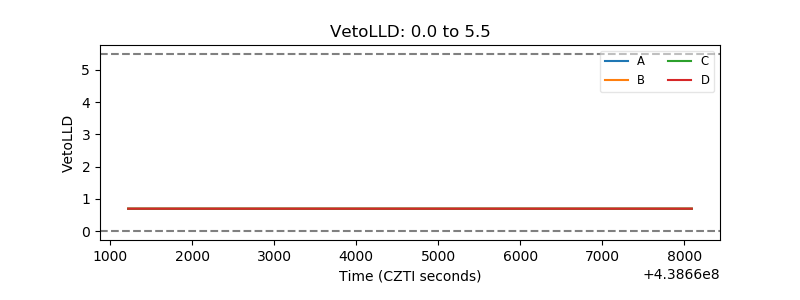 |
| Alpha Counter | 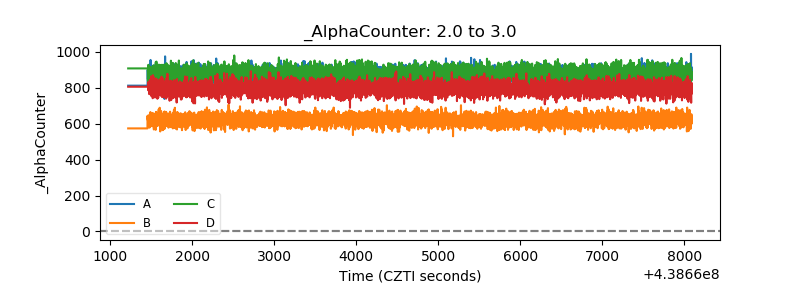 |
| _CPM_Rate | 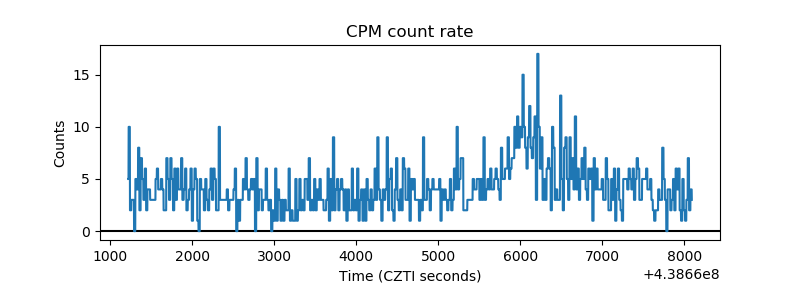 |
| CZT Counter | 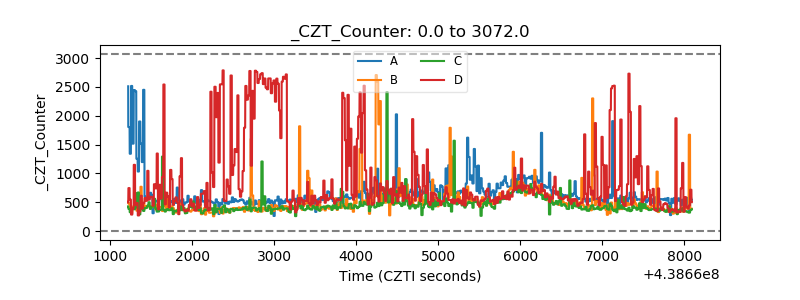 |
| +2.5 Volts monitor | 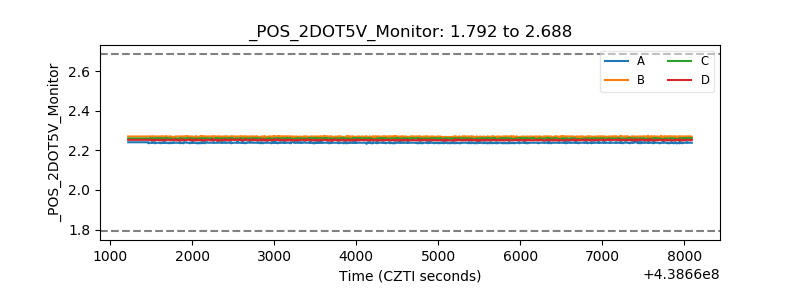 |
| +5 Volts monitor | 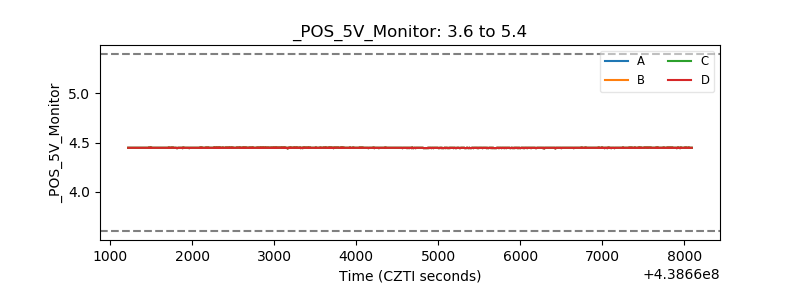 |
| _ROLL_ROT | 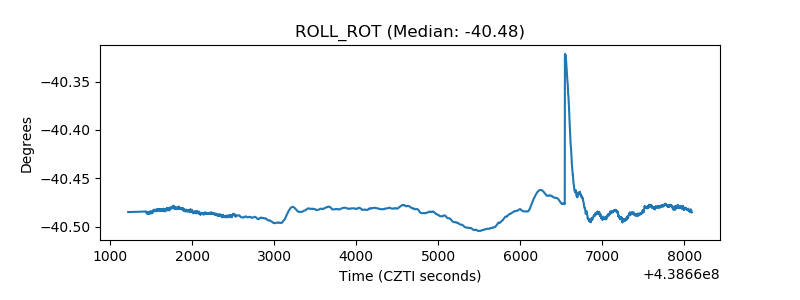 |
| _Roll_DEC | 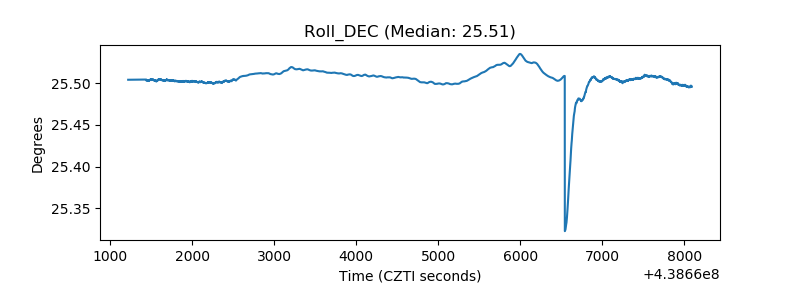 |
| _Roll_RA | 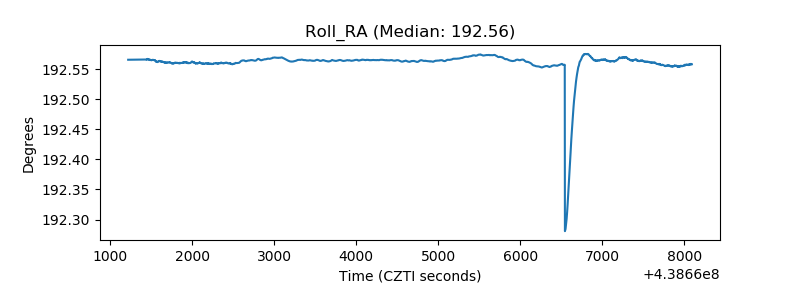 |
| Veto Counter | 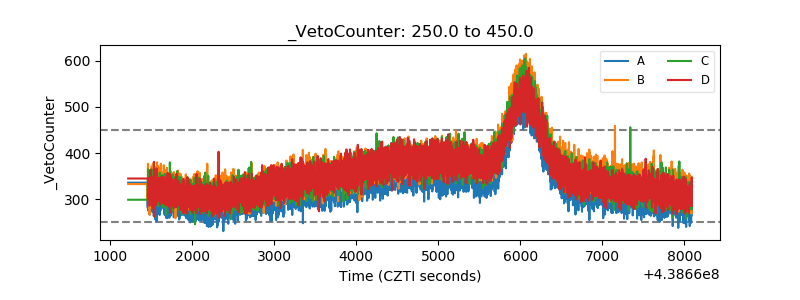 |