| Param | Original file | Final file |
|---|---|---|
| Filename | modeM0/AS1A13_012T02_9000005950_44131cztM0_level2.fits | modeM0/AS1A13_012T02_9000005950_44131cztM0_level2_quad_clean.evt |
| Size (bytes) | 444,905,280 | 109,713,600 |
| Size | 424.3 MB | 104.6 MB |
| Events in quadrant A | 4,145,260 | 736,296 |
| Events in quadrant B | 3,603,327 | 743,506 |
| Events in quadrant C | 3,032,099 | 721,955 |
| Events in quadrant D | 5,149,493 | 637,417 |
| Mode M9 | |||
|---|---|---|---|
| Quadrant | BADHDUFLAG | Total packets | Discarded packets |
| A | 0 | 3 | 3 |
| B | 1 | 3 | 3 |
| C | 1 | -1 | -1 |
| D | 1 | -1 | -1 |
| Mode SS | |||
|---|---|---|---|
| Quadrant | BADHDUFLAG | Total packets | Discarded packets |
| A | 0 | 138 | 0 |
| B | 0 | 138 | 0 |
| C | 0 | 138 | 0 |
| D | 0 | 138 | 0 |
| Mode M0 | |||
|---|---|---|---|
| Quadrant | BADHDUFLAG | Total packets | Discarded packets |
| A | 0 | 16969 | 0 |
| B | 0 | 15744 | 9 |
| C | 0 | 14399 | 6 |
| D | 0 | 20357 | 3 |
| Quadrant | Total seconds | Saturated seconds | Saturation percentage |
|---|---|---|---|
| A | 6934 | 12 | 0.173060% |
| B | 6929 | 135 | 1.948333% |
| C | 6930 | 12 | 0.173160% |
| D | 6933 | 321 | 4.630030% |
Noise dominated data is calculated using 1-second bins in cleaned event files. If a bin has >2000 counts, and if more than 50% of those come from <1% of pixels, then it is considered to be noise-dominated and hence unusable.
| Quadrant | # 1 sec bins | Bins with >0 counts | Bins with >2000 counts | High rate bins dominated by noise | Noise dominated (total time) | Noise dominated (detector-on time) | Marked lightcurve |
|---|---|---|---|---|---|---|---|
| A | 6934 | 6934 | 1 | 1 | 0.01% | 0.01% | 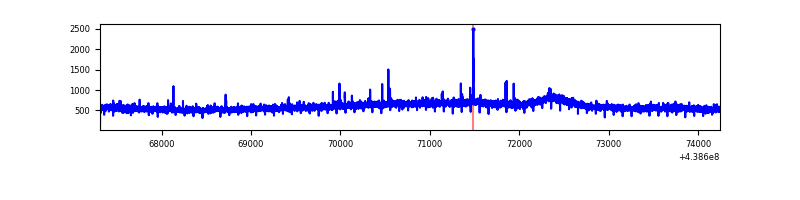 |
| B | 6934 | 6931 | 90 | 90 | 1.30% | 1.30% | 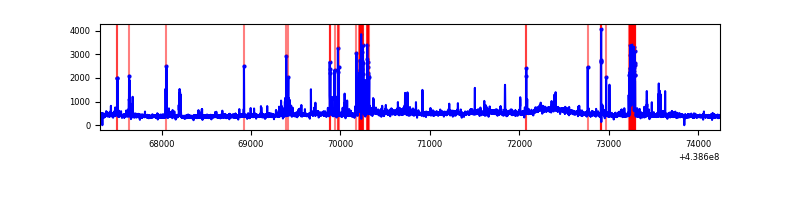 |
| C | 6934 | 6932 | 4 | 4 | 0.06% | 0.06% | 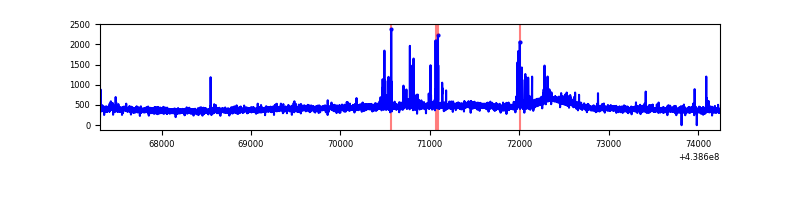 |
| D | 6935 | 6934 | 239 | 239 | 3.45% | 3.45% | 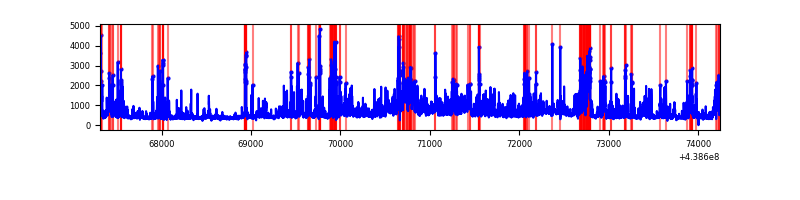 |
Top three noisy pixels from each quadrant. If the there are fewer than three noisy pixels in the level2.evt file, extra rows are filled as -1
| Pixel properties | Quadrant properties | ||||||
|---|---|---|---|---|---|---|---|
| Quadrant | DetID | PixID | Counts | Sigma | Mean | Median | Sigma |
| A | 10 | 83 | 1155171 | 7245.71 | 761 | 745 | 159.3 |
| A | 13 | 6 | 15276 | 91.2 | 761 | 745 | 159.3 |
| A | 15 | 174 | 14450 | 86.02 | 761 | 745 | 159.3 |
| B | 5 | 172 | 358828 | 2373.58 | 754 | 732 | 150.9 |
| B | 0 | 200 | 82003 | 538.69 | 754 | 732 | 150.9 |
| B | 4 | 171 | 49343 | 322.21 | 754 | 732 | 150.9 |
| C | 1 | 241 | 67238 | 379.39 | 741 | 747 | 175.3 |
| C | 14 | 96 | 36312 | 202.93 | 741 | 747 | 175.3 |
| C | 14 | 254 | 23271 | 128.52 | 741 | 747 | 175.3 |
| D | 2 | 249 | 498748 | 2722.05 | 728 | 708 | 183.0 |
| D | 1 | 47 | 406058 | 2215.45 | 728 | 708 | 183.0 |
| D | 1 | 52 | 324794 | 1771.3 | 728 | 708 | 183.0 |
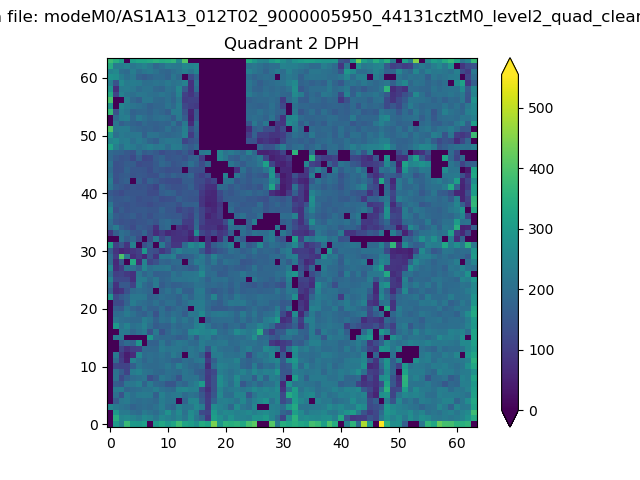
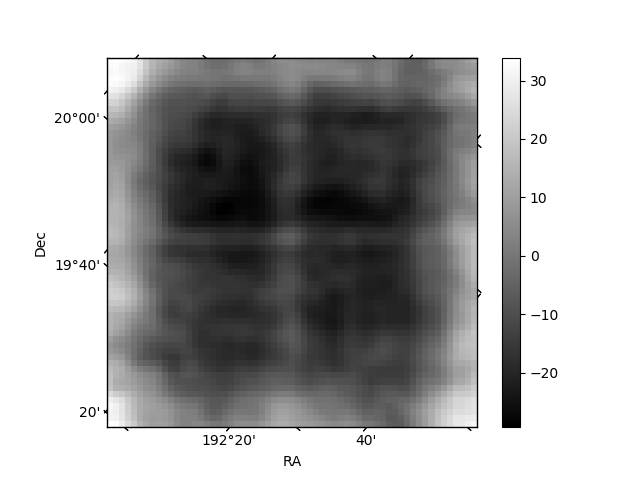
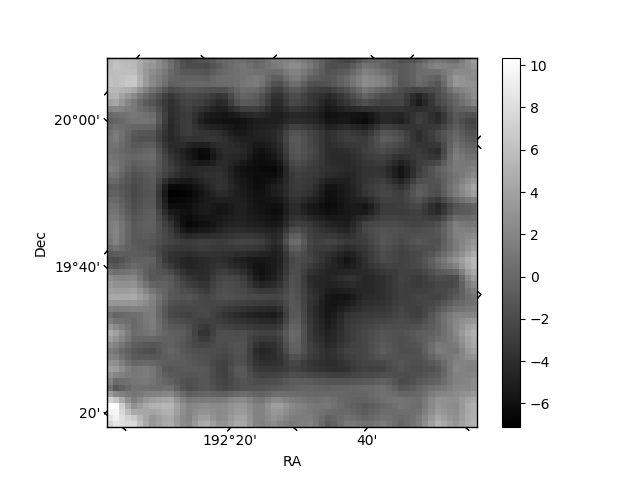
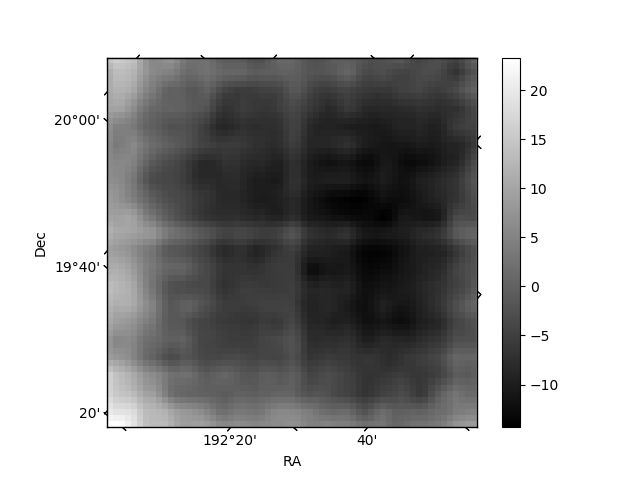
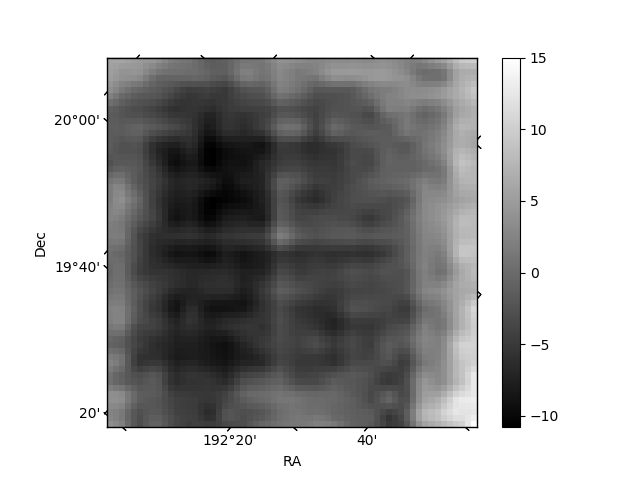
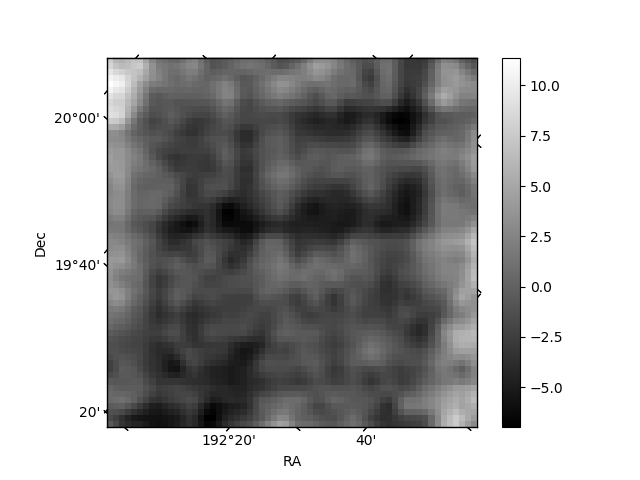
Histogram calculated using DETX and DETY for each event in the final _common_clean file
| Quadrant A | 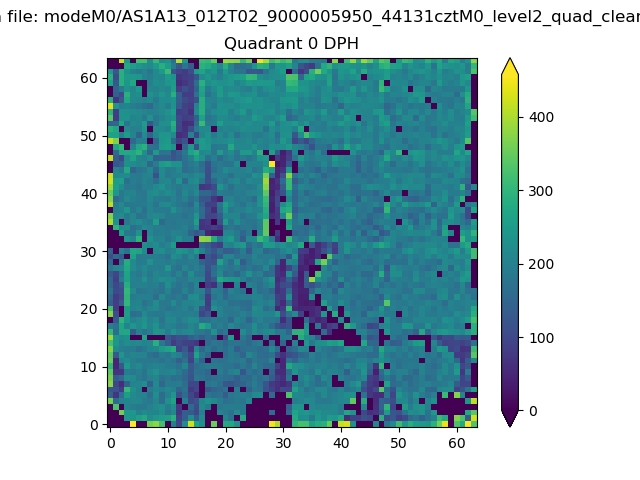 |
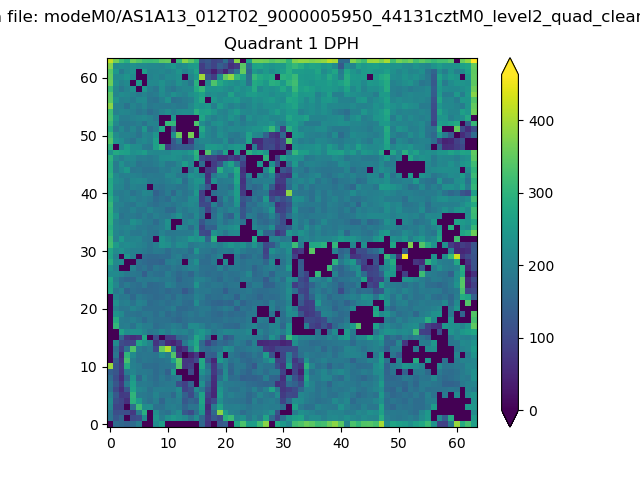 |
Quadrant B |
|---|---|---|---|
| Quadrant D | 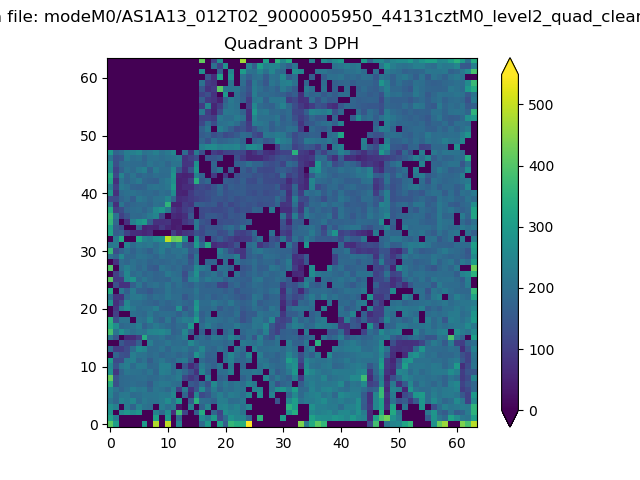 |
 |
Quadrant C |
| Plot type | Count rate plots | Images |
|---|---|---|
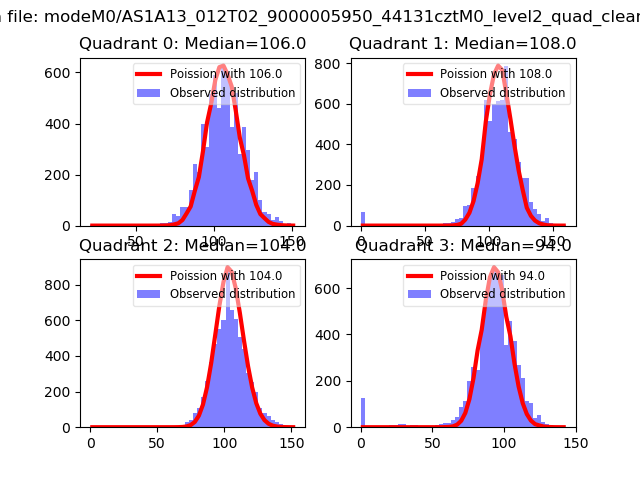
| Comparison with Poisson distribution Blue bars denote a histogram of data divided into 1 sec bins. Red curve is a Poisson curve with rate = median count rate of data. |
 |
 |
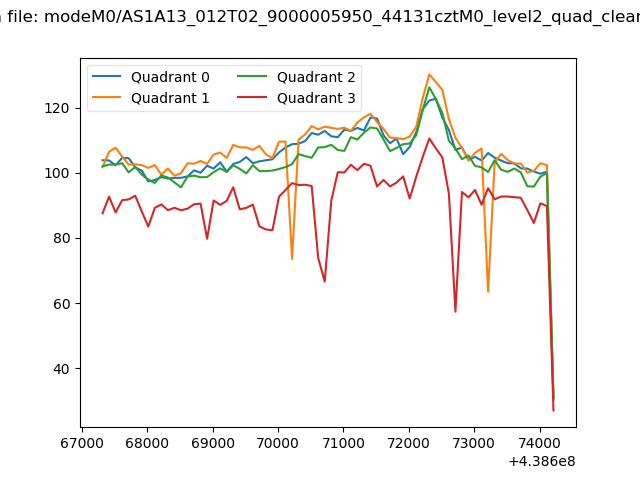
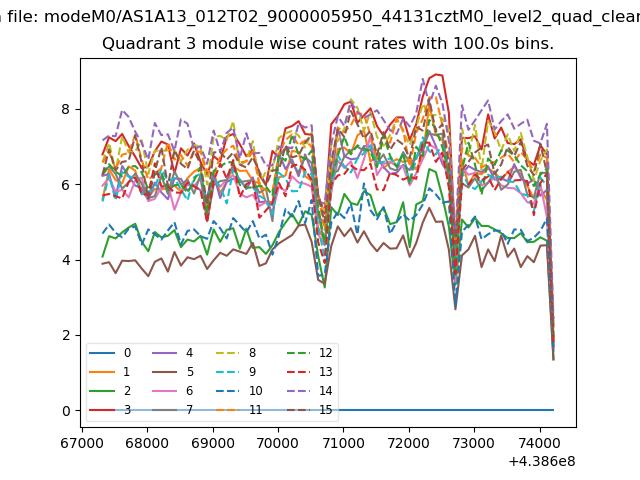
| Quadrant-wise count rates Data is divided into 100 sec bins |
 |
|
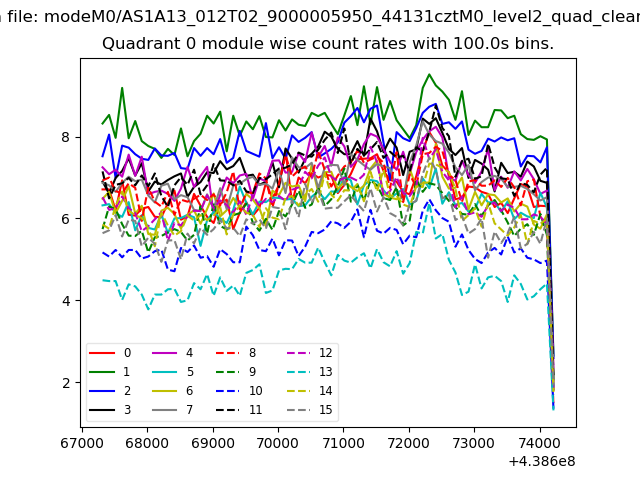
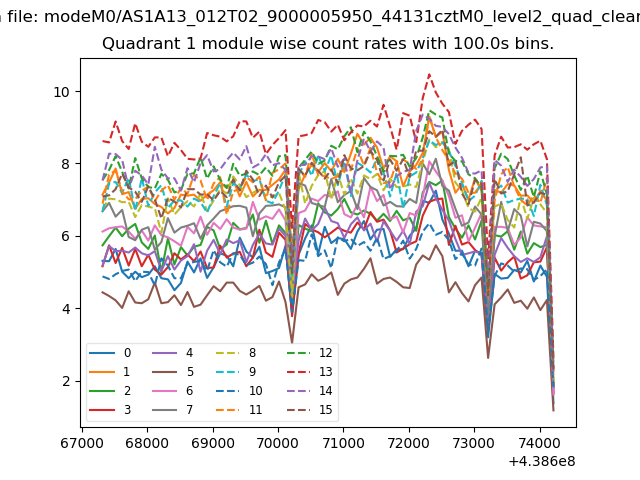
| Module-wise count rates for Quadrant A Data is divided into 100 sec bins |
 |
 |
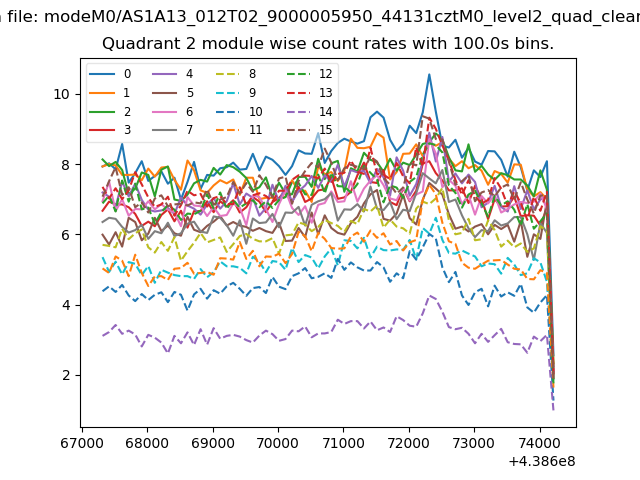
| Module-wise count rates for Quadrant B Data is divided into 100 sec bins |
 |
 |
| Module-wise count rates for Quadrant C Data is divided into 100 sec bins |
 |
 |
| Module-wise count rates for Quadrant D Data is divided into 100 sec bins |
 |
 |
| Parameter | Plot |
|---|---|
| CZT HV Monitor | 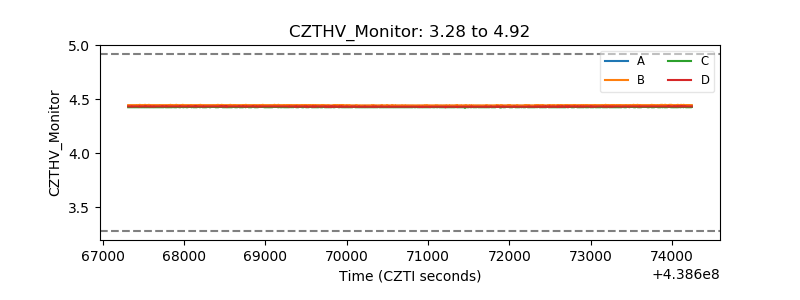 |
| D_VDD | 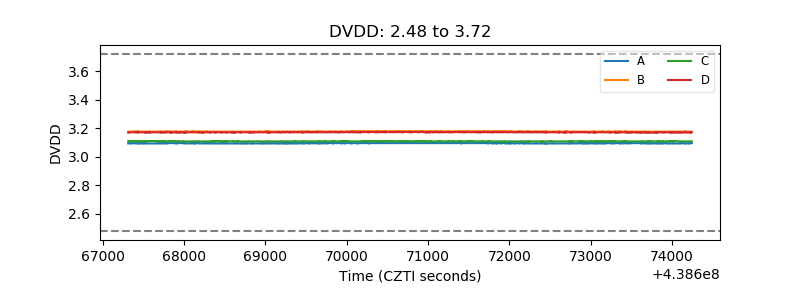 |
| Temperature 1 | 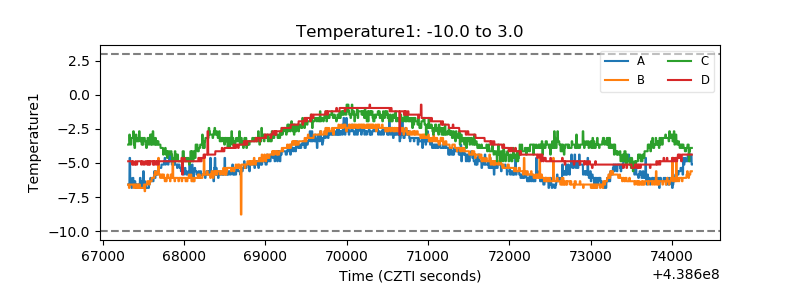 |
| Veto HV Monitor | 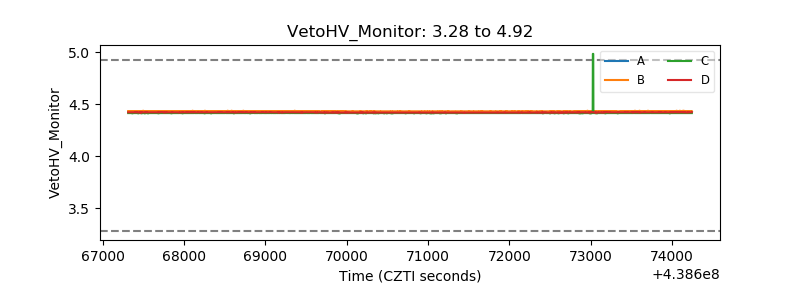 |
| Veto LLD | 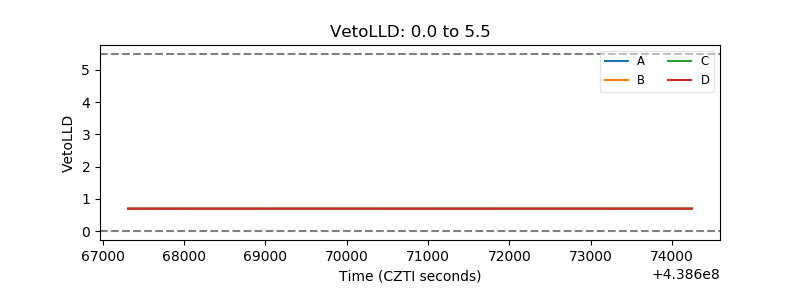 |
| Alpha Counter | 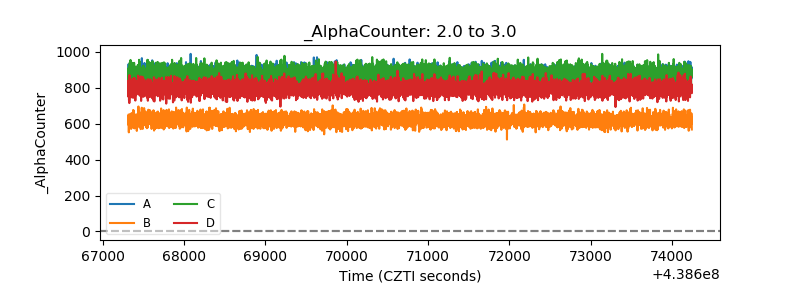 |
| _CPM_Rate | 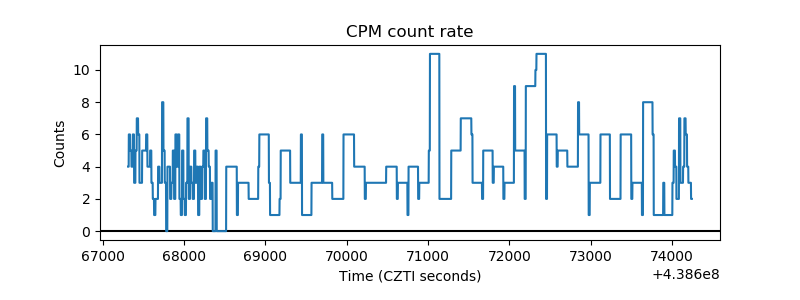 |
| CZT Counter | 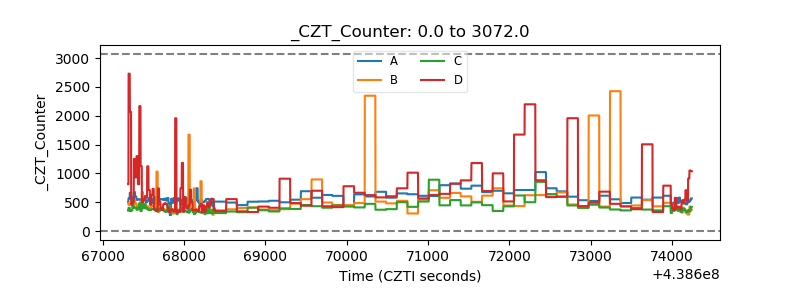 |
| +2.5 Volts monitor | 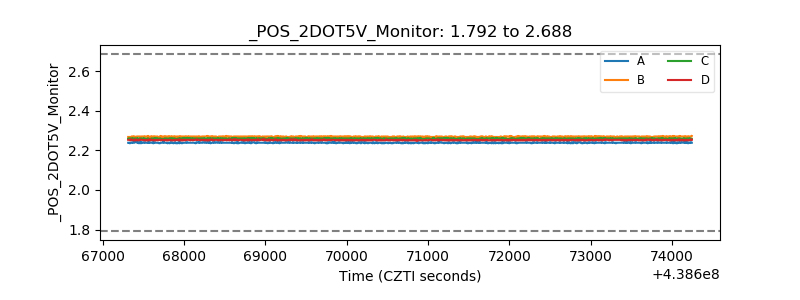 |
| +5 Volts monitor | 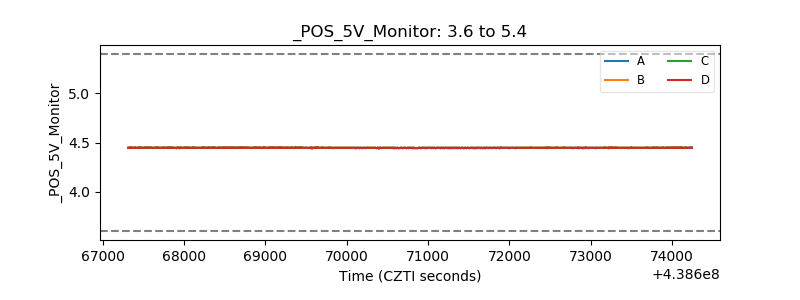 |
| _ROLL_ROT | 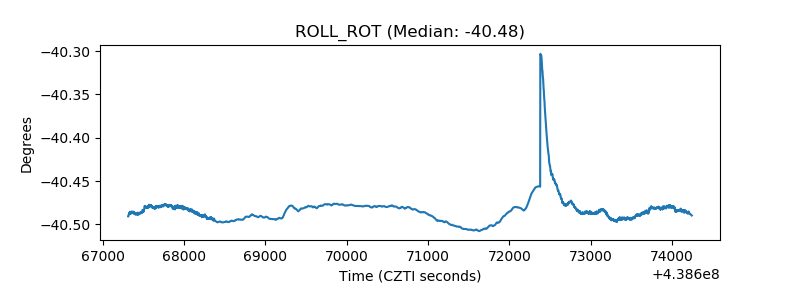 |
| _Roll_DEC | 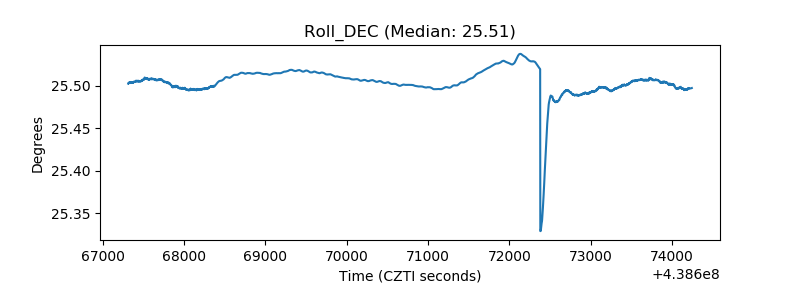 |
| _Roll_RA | 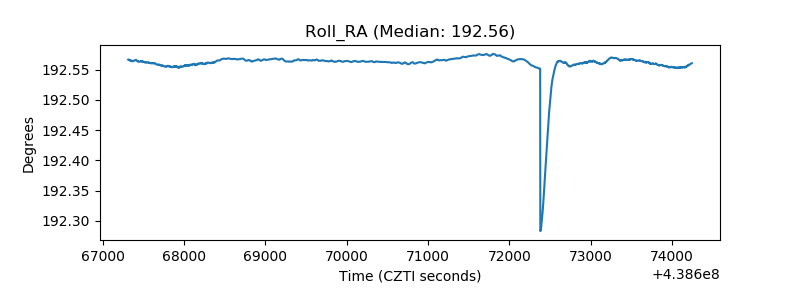 |
| Veto Counter | 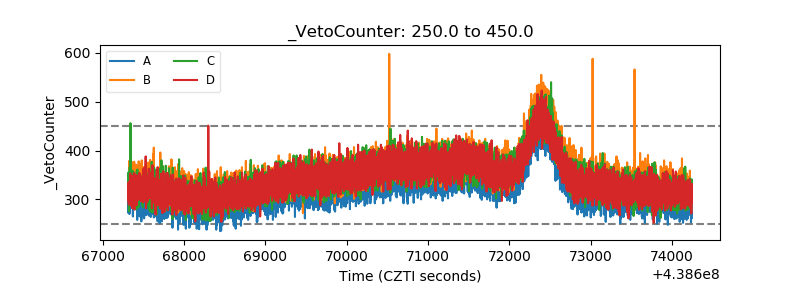 |