| Param | Original file | Final file |
|---|---|---|
| Filename | modeM0/AS1A13_012T02_9000005950_44132cztM0_level2.fits | modeM0/AS1A13_012T02_9000005950_44132cztM0_level2_quad_clean.evt |
| Size (bytes) | 485,956,800 | 108,927,360 |
| Size | 463.4 MB | 103.9 MB |
| Events in quadrant A | 4,657,438 | 738,327 |
| Events in quadrant B | 3,458,134 | 751,876 |
| Events in quadrant C | 3,095,575 | 724,341 |
| Events in quadrant D | 6,235,138 | 598,009 |
| Mode SS | |||
|---|---|---|---|
| Quadrant | BADHDUFLAG | Total packets | Discarded packets |
| A | 0 | 140 | 2 |
| B | 0 | 140 | 4 |
| C | 0 | 140 | 4 |
| D | 0 | 140 | 4 |
| Mode M0 | |||
|---|---|---|---|
| Quadrant | BADHDUFLAG | Total packets | Discarded packets |
| A | 0 | 18558 | 107 |
| B | 0 | 15375 | 111 |
| C | 0 | 14635 | 105 |
| D | 0 | 23815 | 385 |
| Quadrant | Total seconds | Saturated seconds | Saturation percentage |
|---|---|---|---|
| A | 6985 | 89 | 1.274159% |
| B | 6980 | 106 | 1.518625% |
| C | 6983 | 8 | 0.114564% |
| D | 6965 | 750 | 10.768126% |
Noise dominated data is calculated using 1-second bins in cleaned event files. If a bin has >2000 counts, and if more than 50% of those come from <1% of pixels, then it is considered to be noise-dominated and hence unusable.
| Quadrant | # 1 sec bins | Bins with >0 counts | Bins with >2000 counts | High rate bins dominated by noise | Noise dominated (total time) | Noise dominated (detector-on time) | Marked lightcurve |
|---|---|---|---|---|---|---|---|
| A | 7036 | 6995 | 40 | 40 | 0.57% | 0.57% | 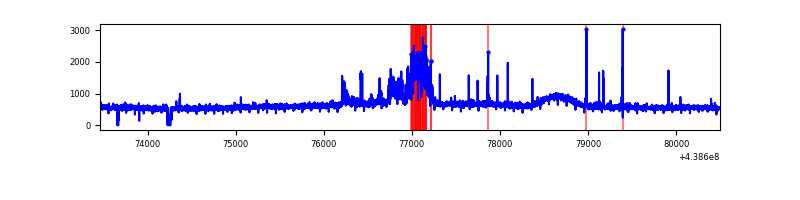 |
| B | 7036 | 6996 | 48 | 48 | 0.68% | 0.69% | 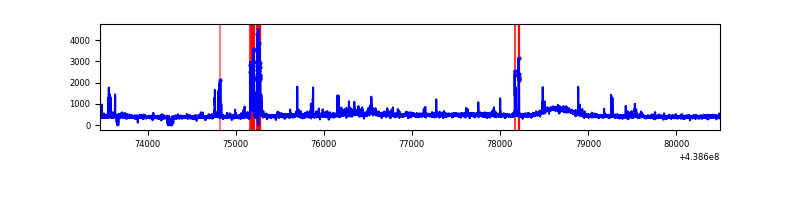 |
| C | 7036 | 7002 | 6 | 6 | 0.09% | 0.09% | 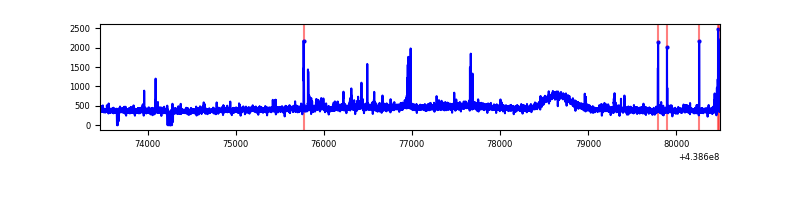 |
| D | 7036 | 6977 | 690 | 690 | 9.81% | 9.89% | 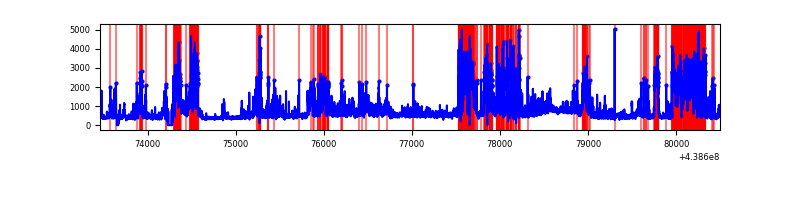 |
Top three noisy pixels from each quadrant. If the there are fewer than three noisy pixels in the level2.evt file, extra rows are filled as -1
| Pixel properties | Quadrant properties | ||||||
|---|---|---|---|---|---|---|---|
| Quadrant | DetID | PixID | Counts | Sigma | Mean | Median | Sigma |
| A | 10 | 83 | 1196160 | 7275.07 | 776 | 758 | 164.3 |
| A | 7 | 3 | 407865 | 2477.6 | 776 | 758 | 164.3 |
| A | 10 | 255 | 25551 | 150.89 | 776 | 758 | 164.3 |
| B | 5 | 172 | 221594 | 1439.71 | 770 | 744 | 153.4 |
| B | 4 | 171 | 53869 | 346.32 | 770 | 744 | 153.4 |
| B | 0 | 199 | 47164 | 302.61 | 770 | 744 | 153.4 |
| C | 14 | 254 | 48225 | 263.12 | 757 | 760 | 180.4 |
| C | 15 | 157 | 26412 | 142.2 | 757 | 760 | 180.4 |
| C | 2 | 14 | 21115 | 112.84 | 757 | 760 | 180.4 |
| D | 1 | 47 | 1510813 | 8182.27 | 721 | 696 | 184.6 |
| D | 13 | 171 | 740605 | 4009.05 | 721 | 696 | 184.6 |
| D | 1 | 52 | 600572 | 3250.31 | 721 | 696 | 184.6 |
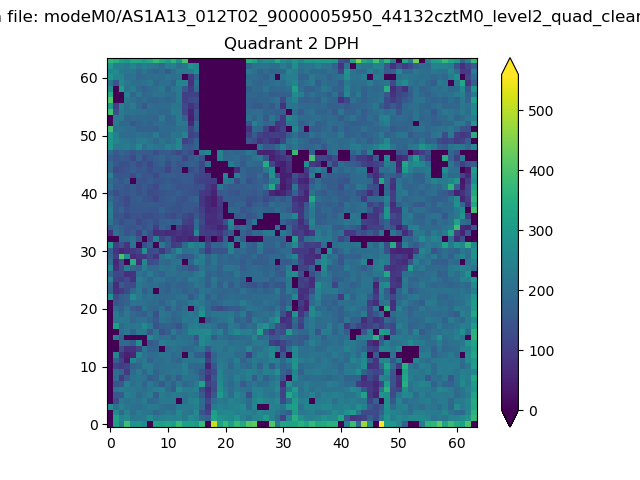
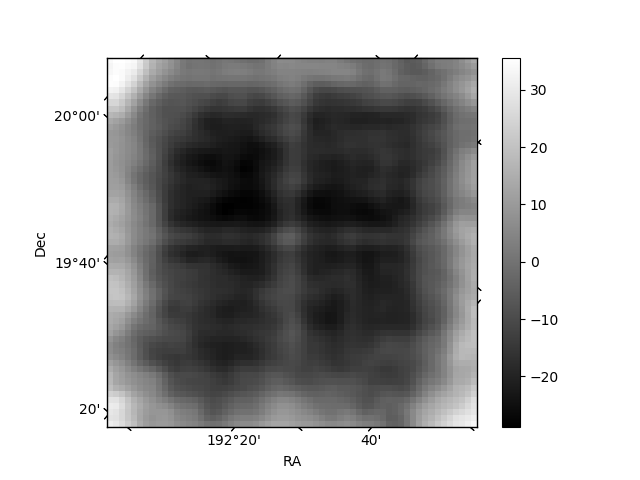
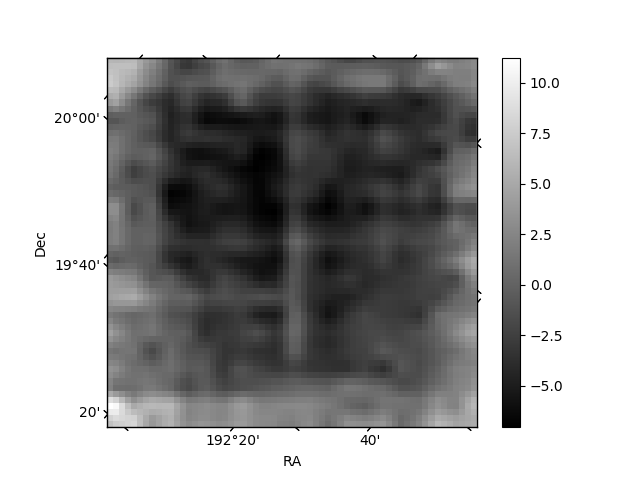
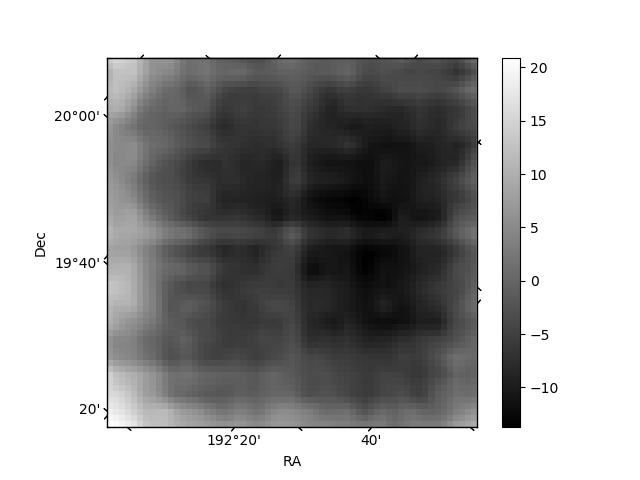
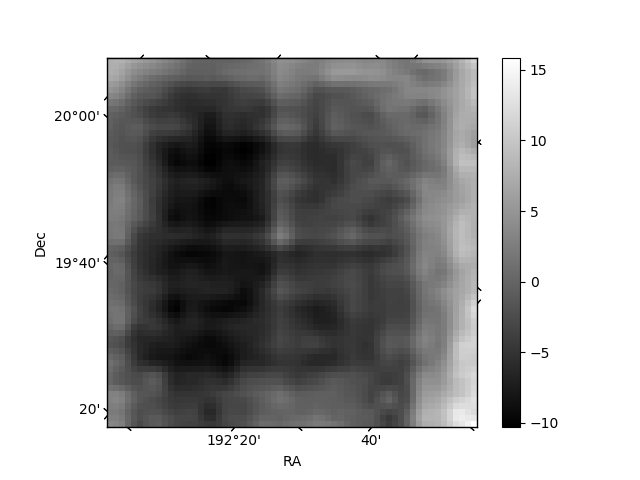
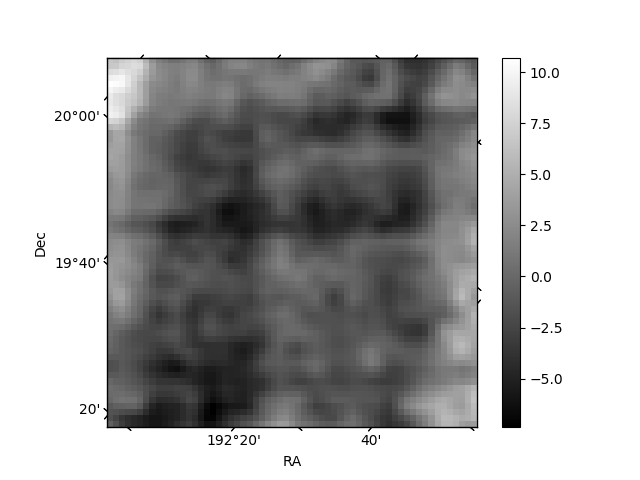
Histogram calculated using DETX and DETY for each event in the final _common_clean file
| Quadrant A | 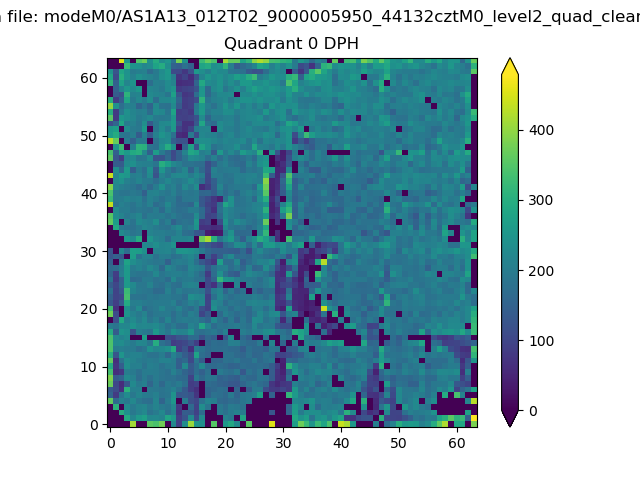 |
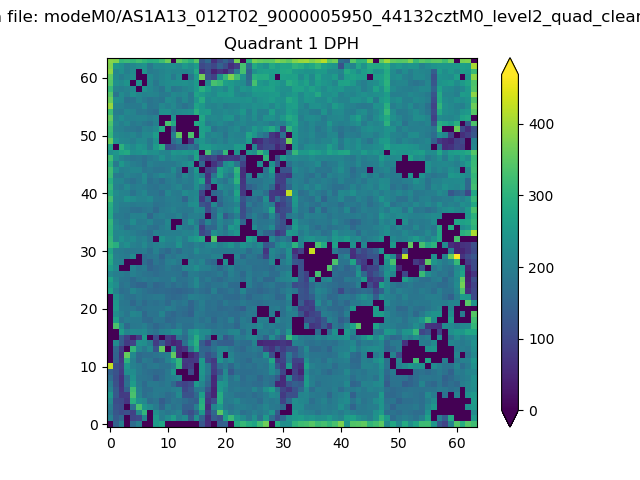 |
Quadrant B |
|---|---|---|---|
| Quadrant D | 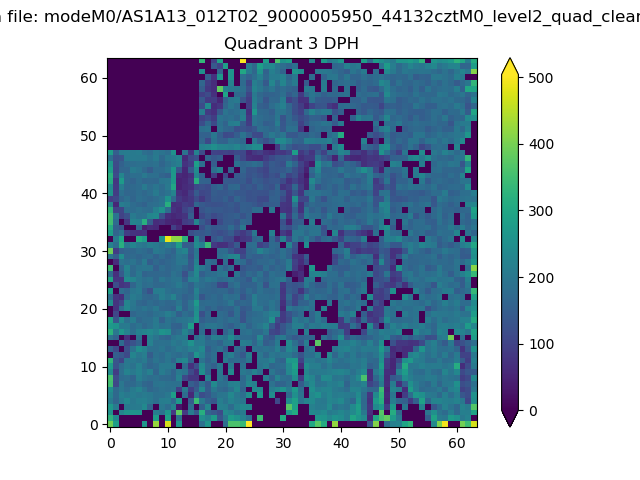 |
 |
Quadrant C |
| Plot type | Count rate plots | Images |
|---|---|---|
| Comparison with Poisson distribution Blue bars denote a histogram of data divided into 1 sec bins. Red curve is a Poisson curve with rate = median count rate of data. |
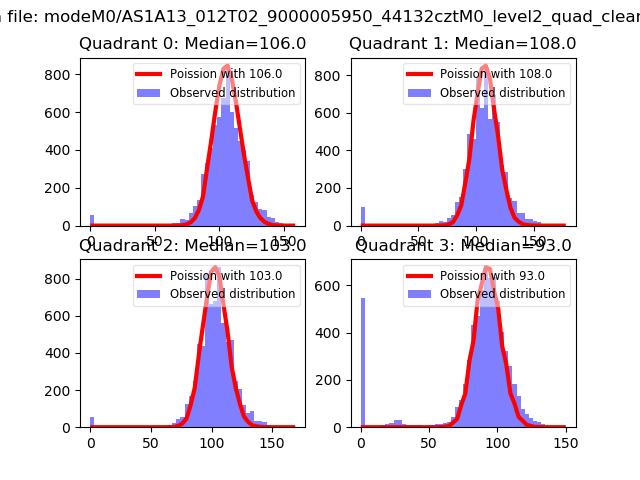 |
 |
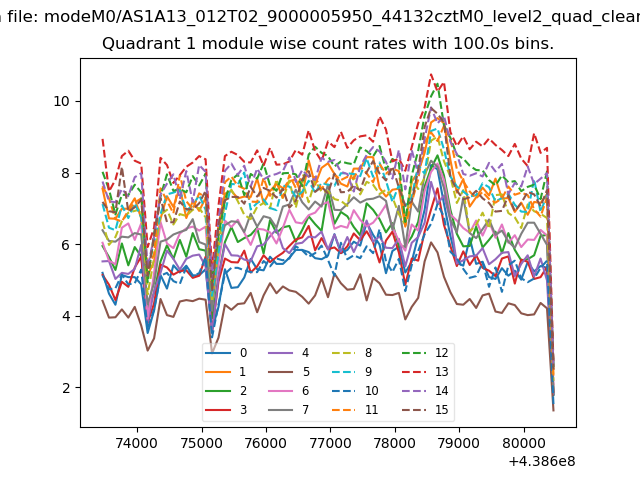
| Quadrant-wise count rates Data is divided into 100 sec bins |
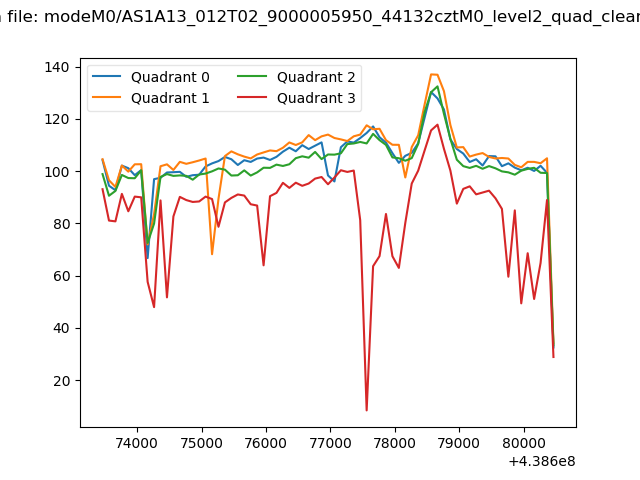 |
|
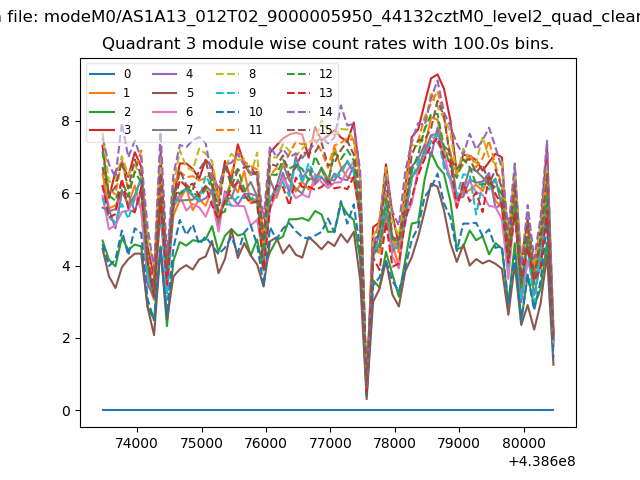
| Module-wise count rates for Quadrant A Data is divided into 100 sec bins |
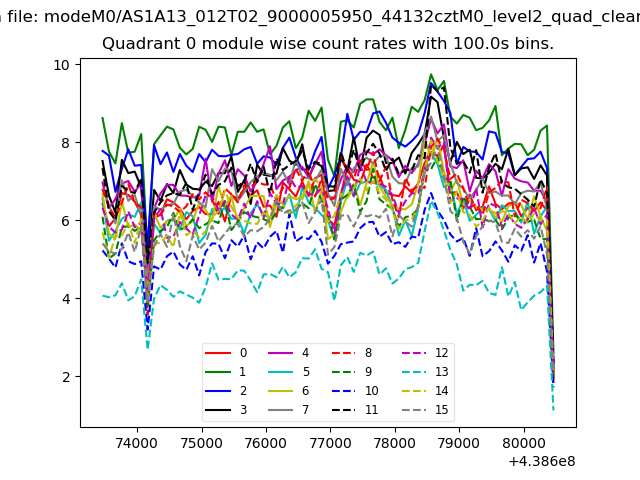 |
 |
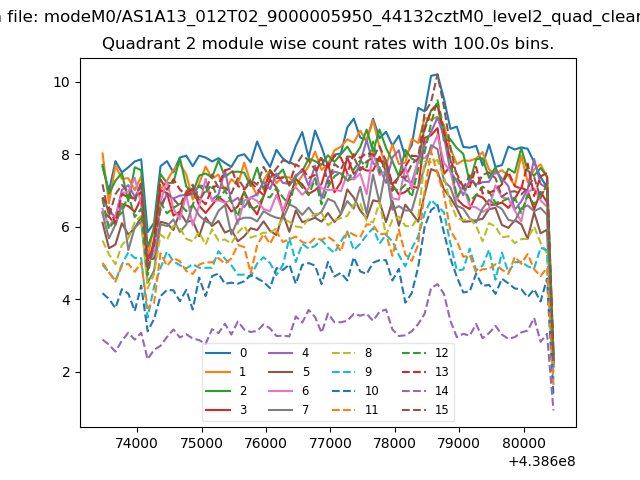
| Module-wise count rates for Quadrant B Data is divided into 100 sec bins |
 |
 |
| Module-wise count rates for Quadrant C Data is divided into 100 sec bins |
 |
 |
| Module-wise count rates for Quadrant D Data is divided into 100 sec bins |
 |
 |
| Parameter | Plot |
|---|---|
| CZT HV Monitor | 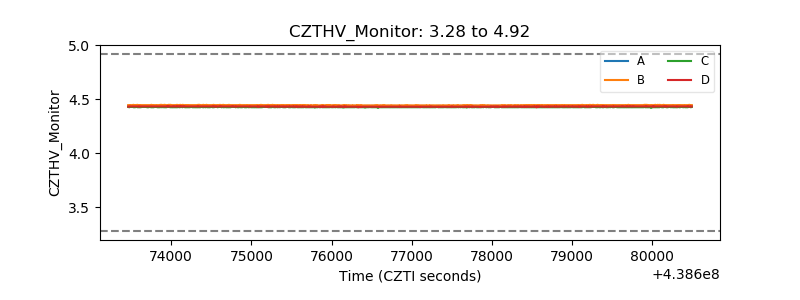 |
| D_VDD | 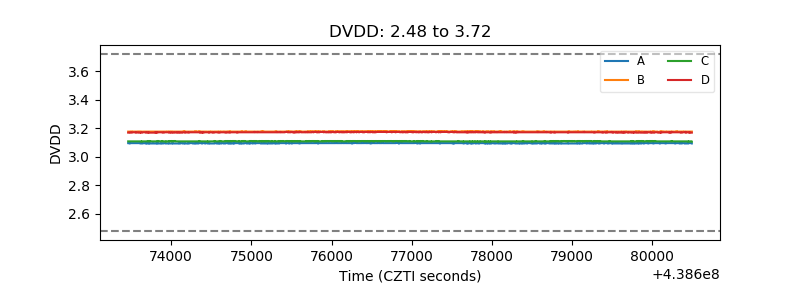 |
| Temperature 1 | 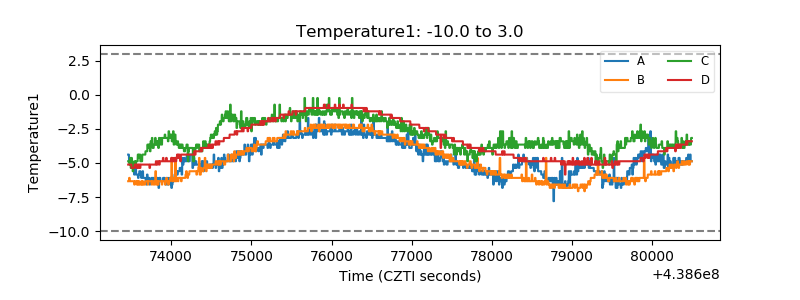 |
| Veto HV Monitor | 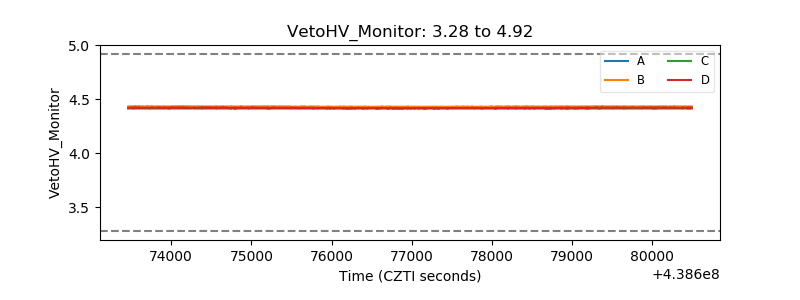 |
| Veto LLD | 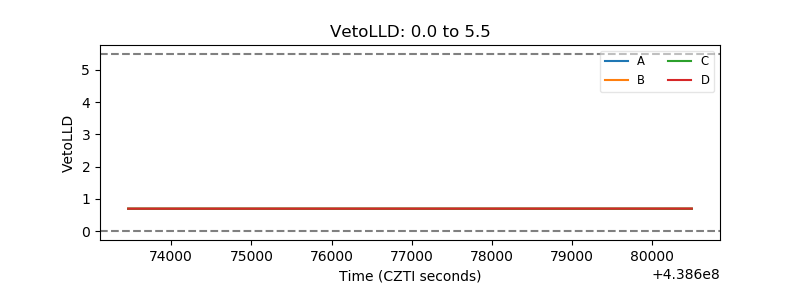 |
| Alpha Counter | 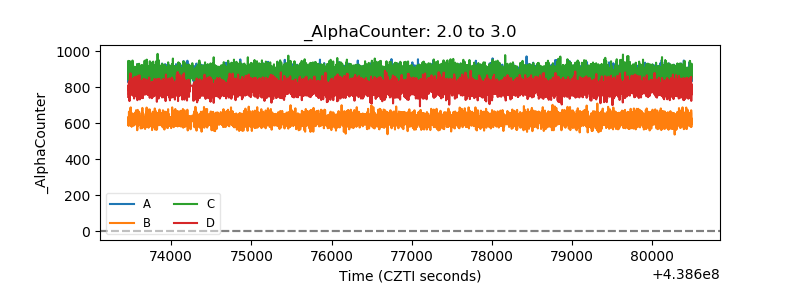 |
| _CPM_Rate | 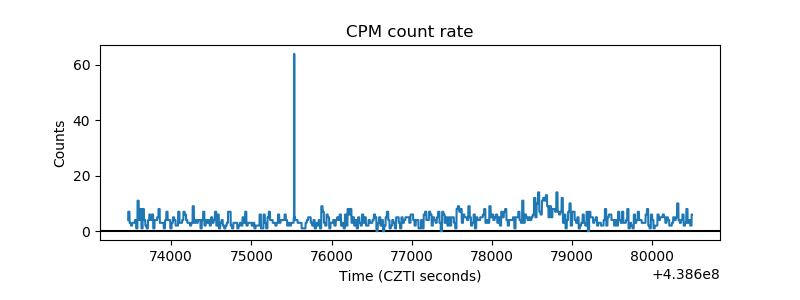 |
| CZT Counter | 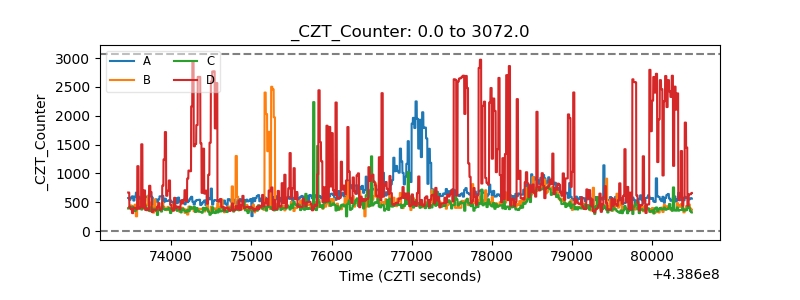 |
| +2.5 Volts monitor | 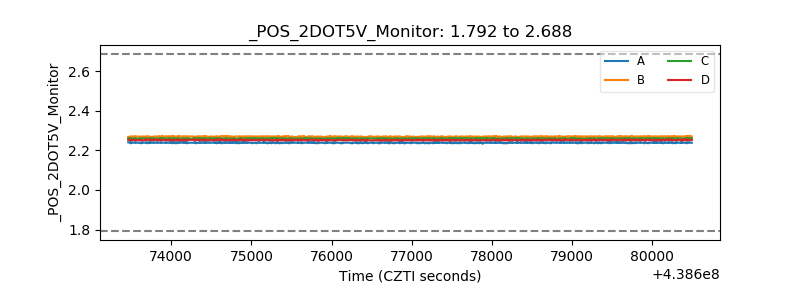 |
| +5 Volts monitor | 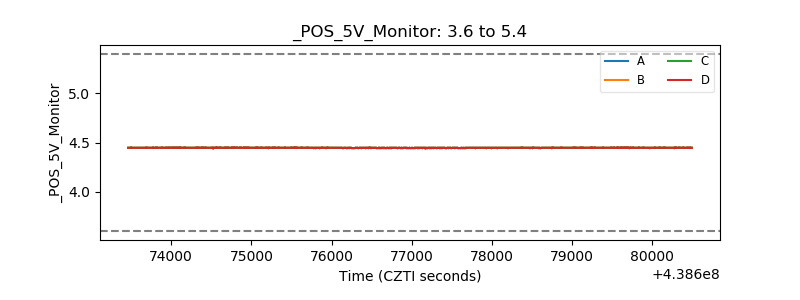 |
| _ROLL_ROT | 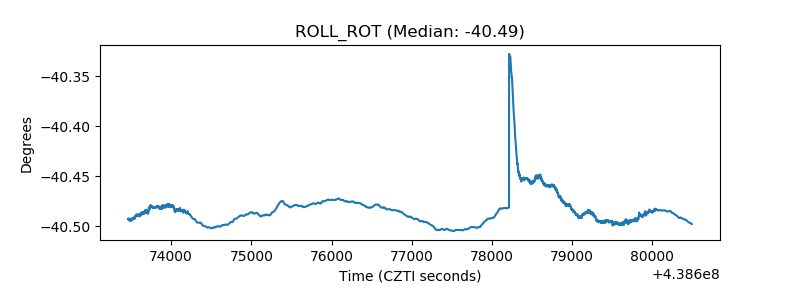 |
| _Roll_DEC | 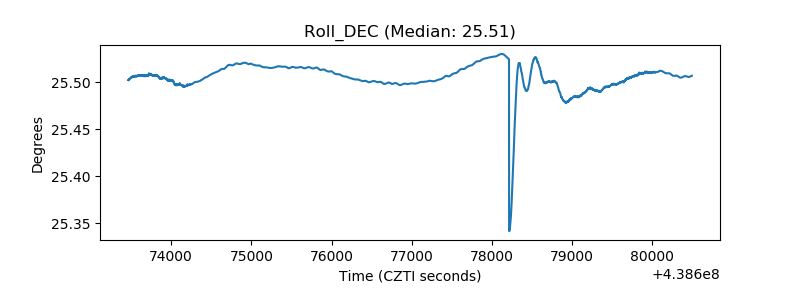 |
| _Roll_RA | 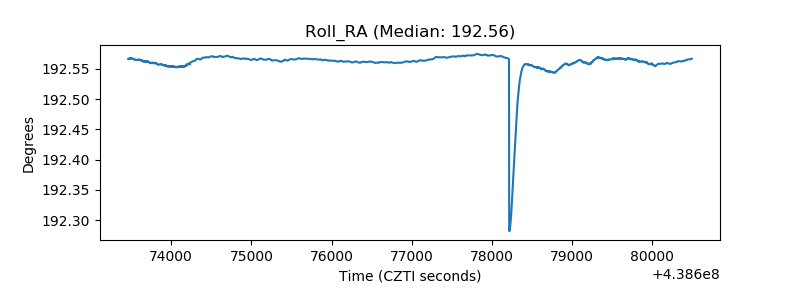 |
| Veto Counter | 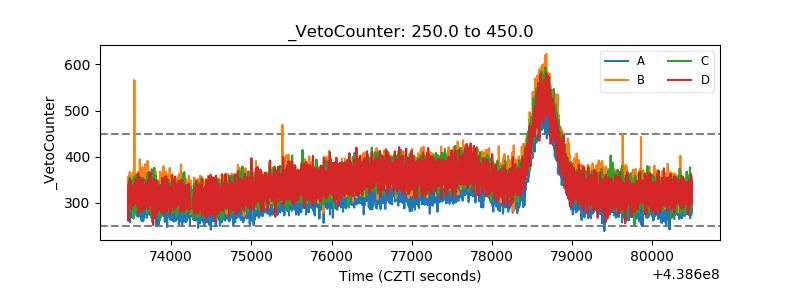 |