| Param | Original file | Final file |
|---|---|---|
| Filename | modeM0/AS1A13_012T02_9000005950_44134cztM0_level2.fits | modeM0/AS1A13_012T02_9000005950_44134cztM0_level2_quad_clean.evt |
| Size (bytes) | 773,760,960 | 170,193,600 |
| Size | 737.9 MB | 162.3 MB |
| Events in quadrant A | 7,545,500 | 1,118,197 |
| Events in quadrant B | 5,679,219 | 1,168,504 |
| Events in quadrant C | 5,099,050 | 1,133,873 |
| Events in quadrant D | 9,454,605 | 959,898 |
| Mode M9 | |||
|---|---|---|---|
| Quadrant | BADHDUFLAG | Total packets | Discarded packets |
| A | 0 | 6 | 0 |
| B | 0 | 6 | 0 |
| C | 0 | 6 | 0 |
| D | 0 | 6 | 0 |
| Mode SS | |||
|---|---|---|---|
| Quadrant | BADHDUFLAG | Total packets | Discarded packets |
| A | 0 | 234 | 0 |
| B | 0 | 234 | 0 |
| C | 0 | 234 | 0 |
| D | 0 | 234 | 0 |
| Mode M0 | |||
|---|---|---|---|
| Quadrant | BADHDUFLAG | Total packets | Discarded packets |
| A | 0 | 30491 | 18 |
| B | 0 | 24690 | 17 |
| C | 0 | 23494 | 13 |
| D | 0 | 35816 | 72 |
| Quadrant | Total seconds | Saturated seconds | Saturation percentage |
|---|---|---|---|
| A | 11146 | 518 | 4.647407% |
| B | 11143 | 402 | 3.607646% |
| C | 11146 | 180 | 1.614929% |
| D | 11136 | 1113 | 9.994612% |
Noise dominated data is calculated using 1-second bins in cleaned event files. If a bin has >2000 counts, and if more than 50% of those come from <1% of pixels, then it is considered to be noise-dominated and hence unusable.
| Quadrant | # 1 sec bins | Bins with >0 counts | Bins with >2000 counts | High rate bins dominated by noise | Noise dominated (total time) | Noise dominated (detector-on time) | Marked lightcurve |
|---|---|---|---|---|---|---|---|
| A | 11907 | 11156 | 234 | 234 | 1.97% | 2.10% | 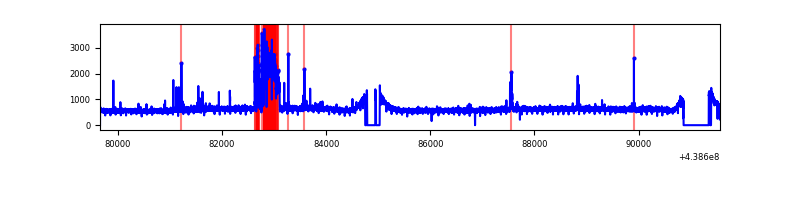 |
| B | 11908 | 11154 | 115 | 115 | 0.97% | 1.03% | 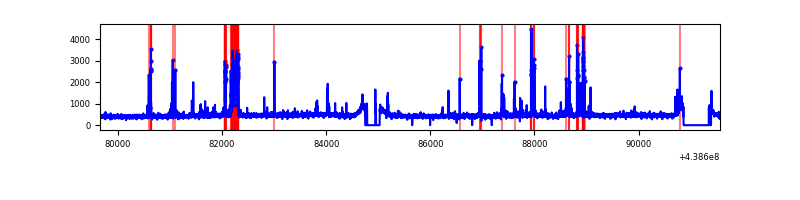 |
| C | 11908 | 11155 | 33 | 33 | 0.28% | 0.30% | 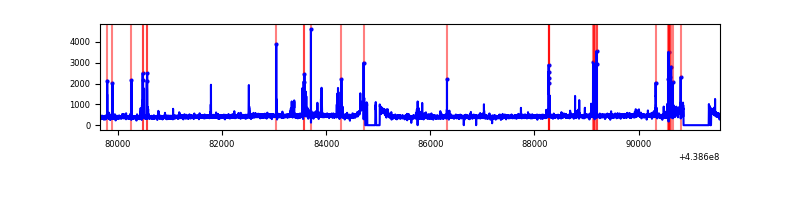 |
| D | 11908 | 11152 | 833 | 833 | 7.00% | 7.47% | 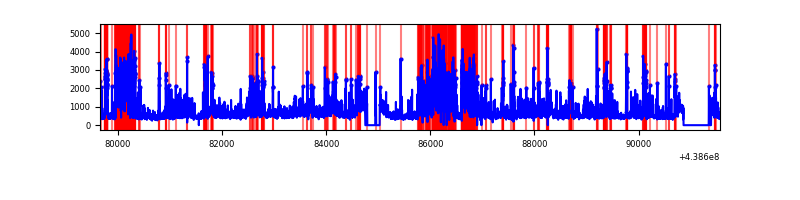 |
Top three noisy pixels from each quadrant. If the there are fewer than three noisy pixels in the level2.evt file, extra rows are filled as -1
| Pixel properties | Quadrant properties | ||||||
|---|---|---|---|---|---|---|---|
| Quadrant | DetID | PixID | Counts | Sigma | Mean | Median | Sigma |
| A | 10 | 83 | 2004412 | 7771.48 | 1236 | 1208 | 257.8 |
| A | 14 | 238 | 638324 | 2471.71 | 1236 | 1208 | 257.8 |
| A | 15 | 174 | 51531 | 195.23 | 1236 | 1208 | 257.8 |
| B | 5 | 235 | 378308 | 1548.42 | 1233 | 1195 | 243.5 |
| B | 5 | 172 | 254711 | 1040.93 | 1233 | 1195 | 243.5 |
| B | 0 | 200 | 82027 | 331.89 | 1233 | 1195 | 243.5 |
| C | 14 | 254 | 165158 | 566.71 | 1224 | 1231 | 289.3 |
| C | 15 | 158 | 61122 | 207.05 | 1224 | 1231 | 289.3 |
| C | 15 | 157 | 35819 | 119.57 | 1224 | 1231 | 289.3 |
| D | 1 | 47 | 1409707 | 4696.65 | 1183 | 1143 | 299.9 |
| D | 5 | 235 | 1187774 | 3956.65 | 1183 | 1143 | 299.9 |
| D | 1 | 52 | 710738 | 2366.04 | 1183 | 1143 | 299.9 |
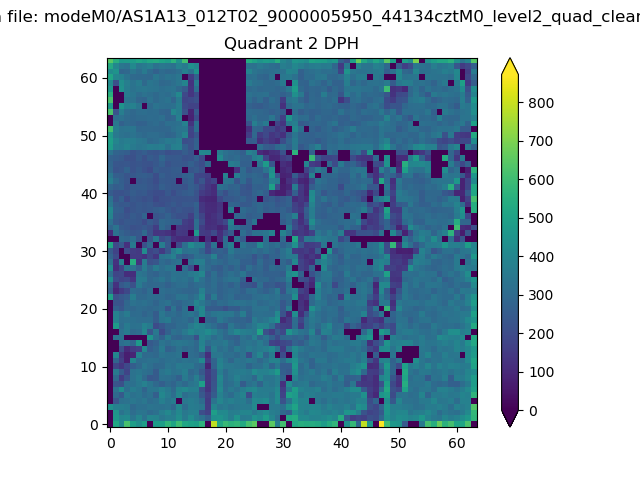
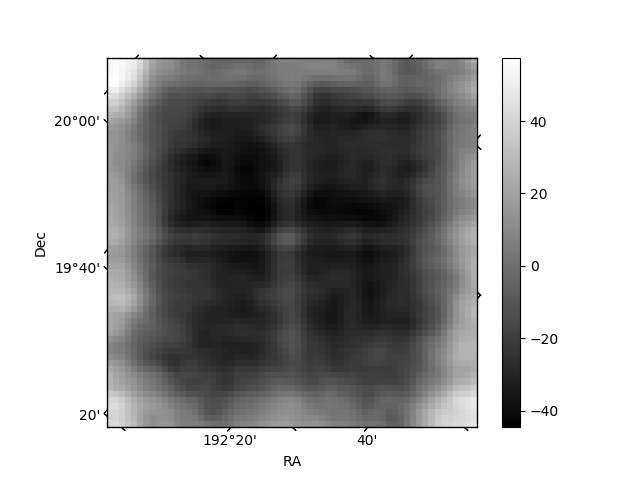
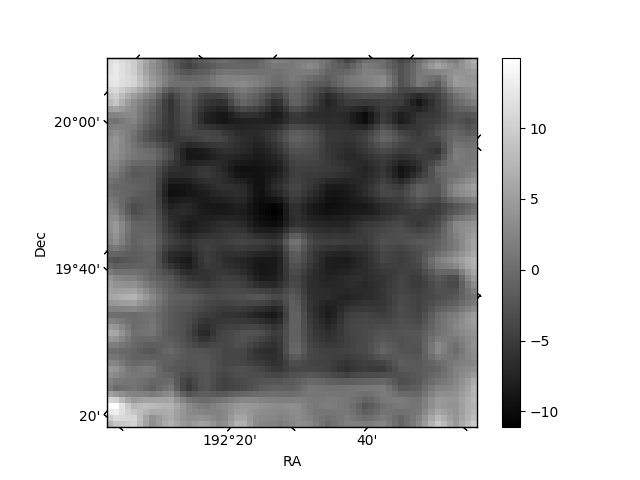
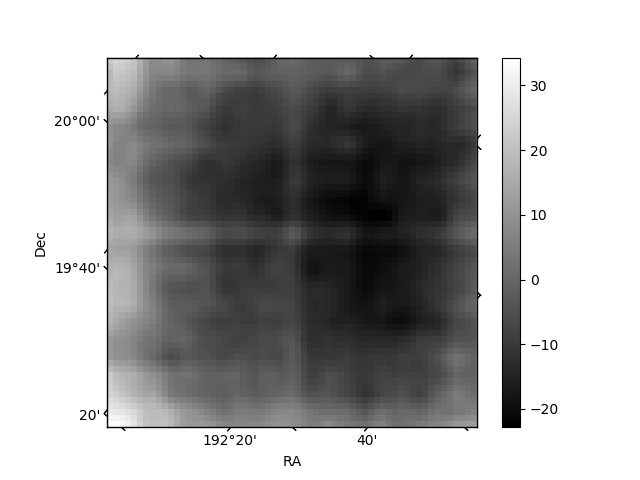
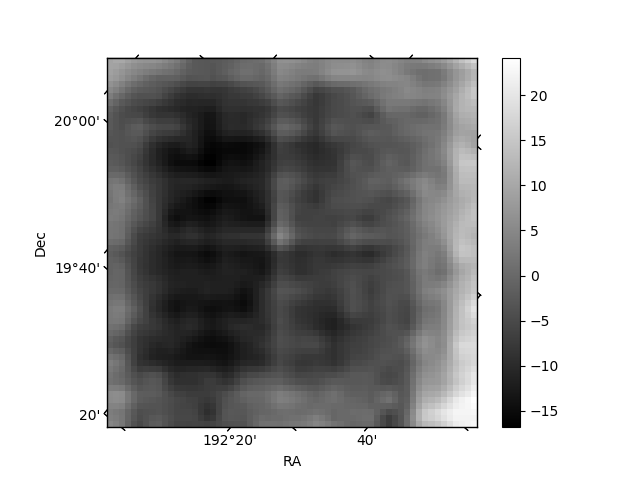
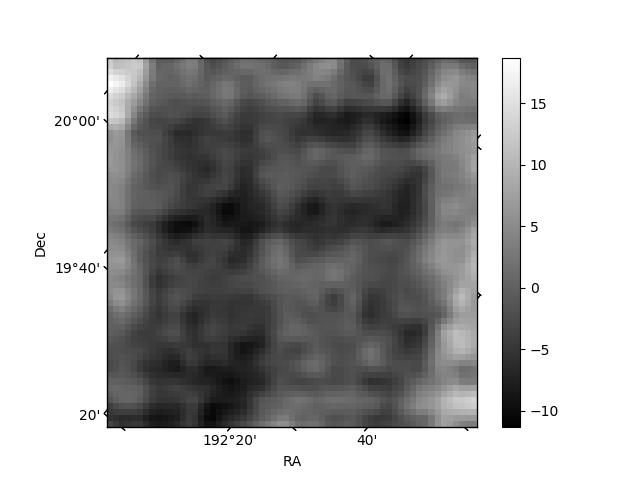
Histogram calculated using DETX and DETY for each event in the final _common_clean file
| Quadrant A | 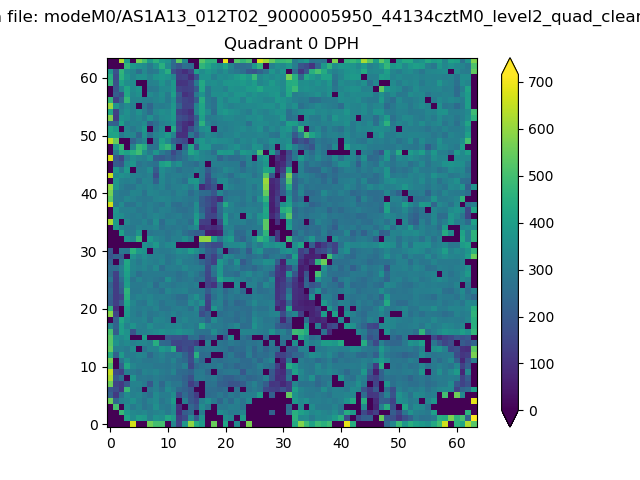 |
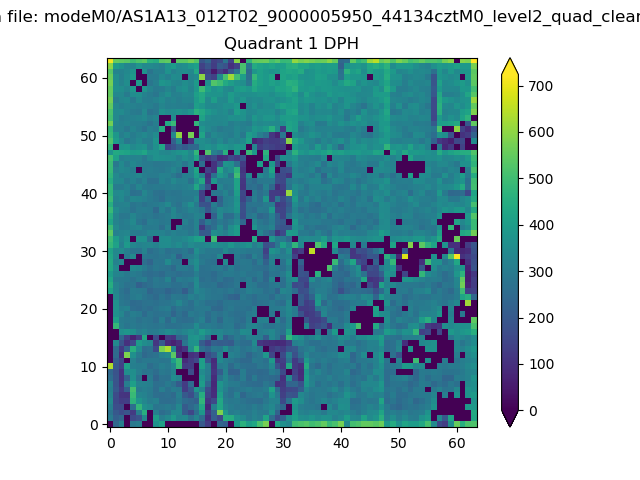 |
Quadrant B |
|---|---|---|---|
| Quadrant D | 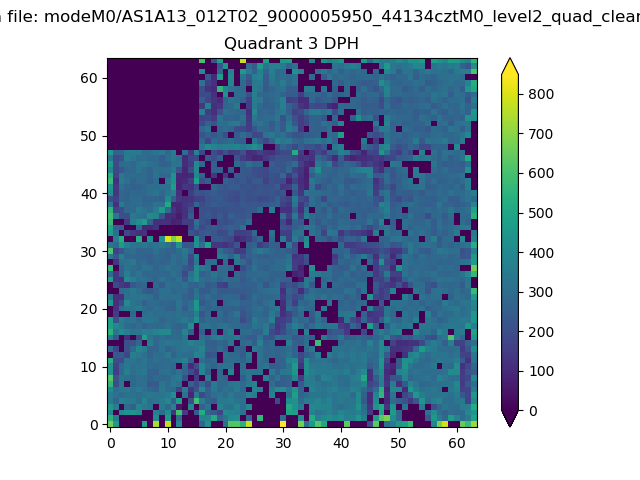 |
 |
Quadrant C |
| Plot type | Count rate plots | Images |
|---|---|---|
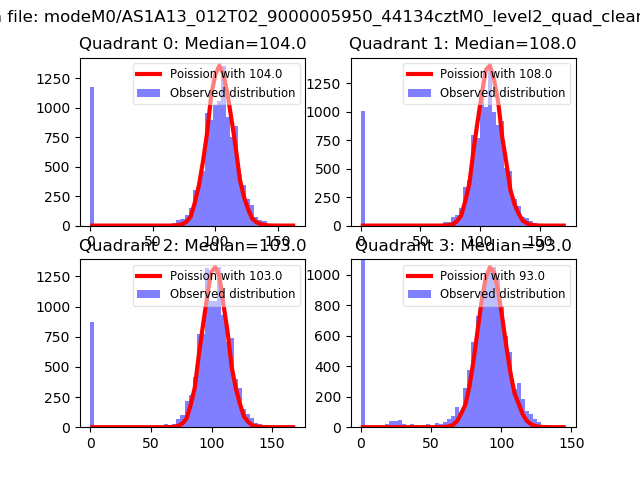
| Comparison with Poisson distribution Blue bars denote a histogram of data divided into 1 sec bins. Red curve is a Poisson curve with rate = median count rate of data. |
 |
 |
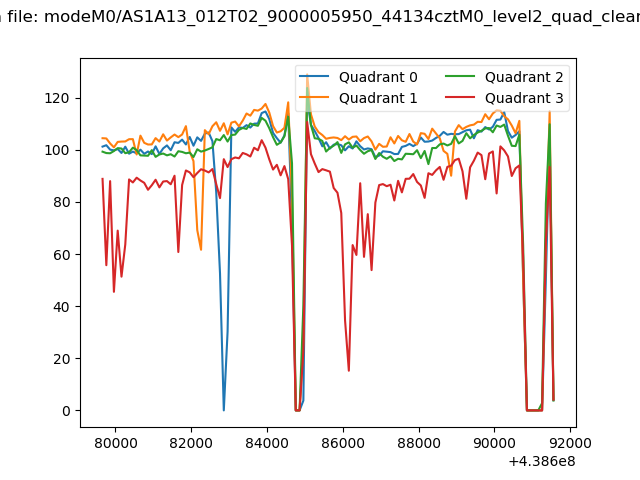
| Quadrant-wise count rates Data is divided into 100 sec bins |
 |
|
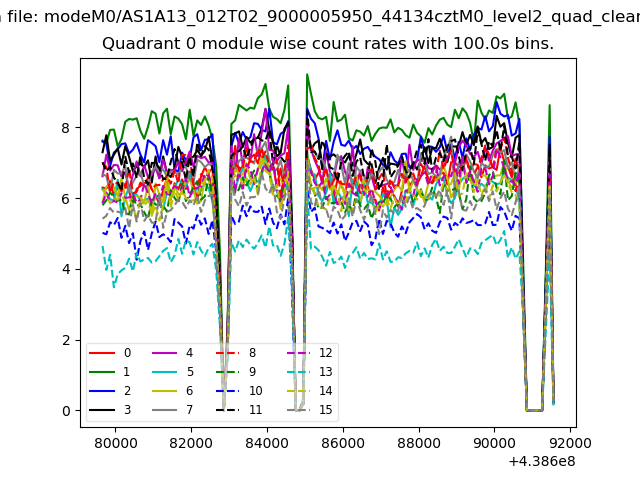
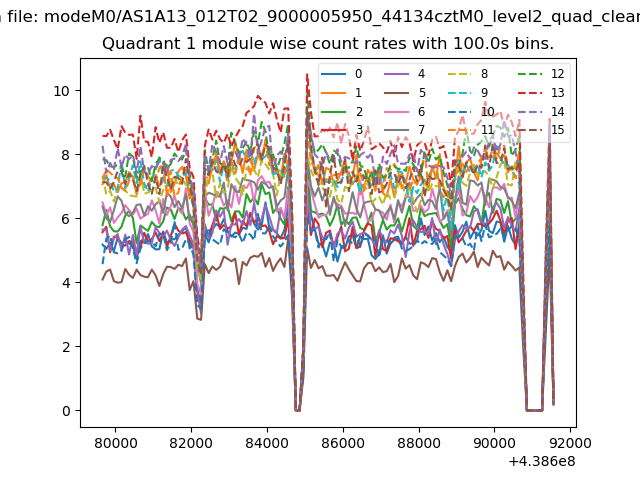
| Module-wise count rates for Quadrant A Data is divided into 100 sec bins |
 |
 |
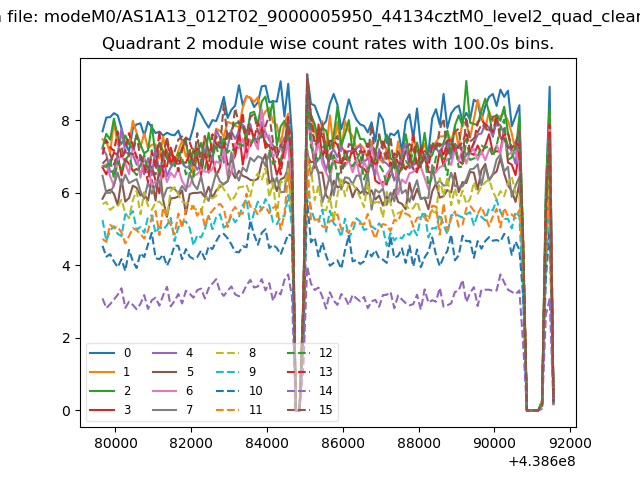
| Module-wise count rates for Quadrant B Data is divided into 100 sec bins |
 |
 |
| Module-wise count rates for Quadrant C Data is divided into 100 sec bins |
 |
 |
| Module-wise count rates for Quadrant D Data is divided into 100 sec bins |
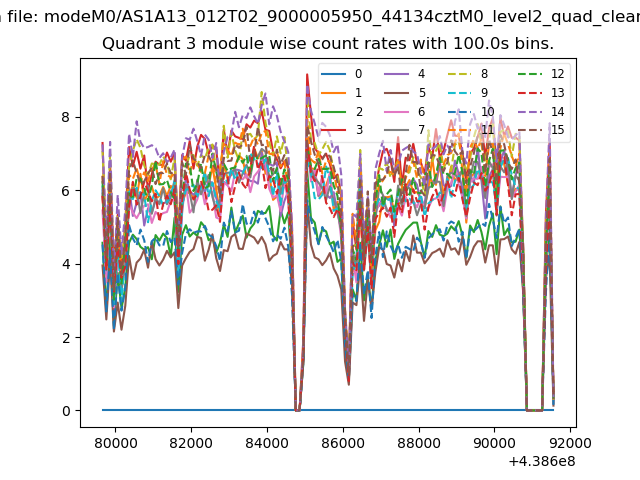 |
 |
| Parameter | Plot |
|---|---|
| CZT HV Monitor | 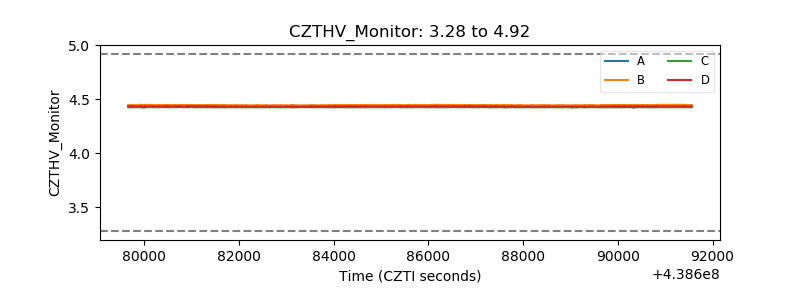 |
| D_VDD | 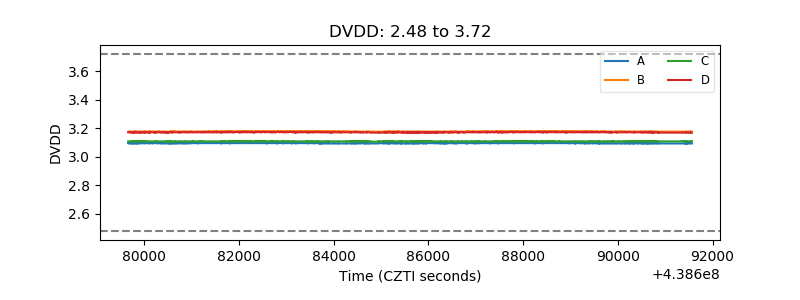 |
| Temperature 1 | 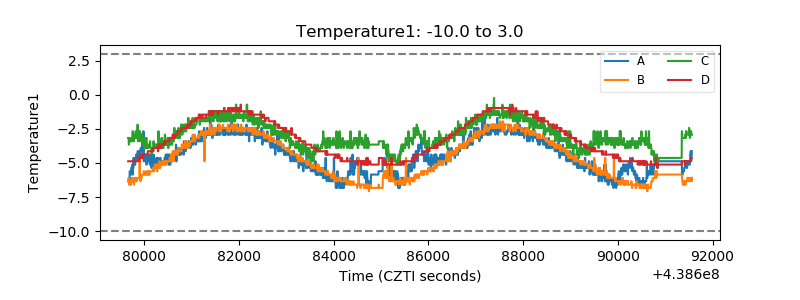 |
| Veto HV Monitor | 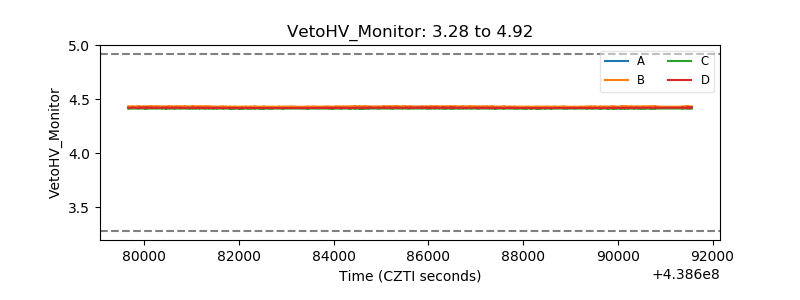 |
| Veto LLD | 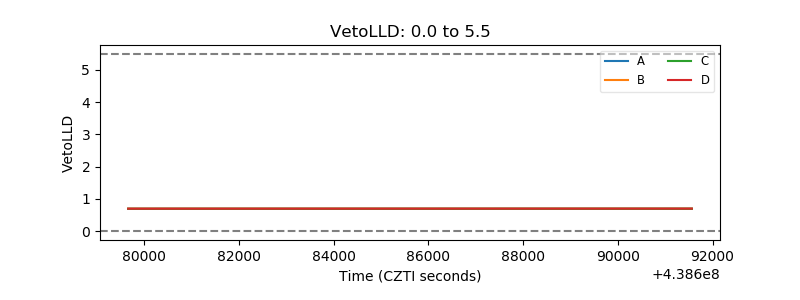 |
| Alpha Counter | 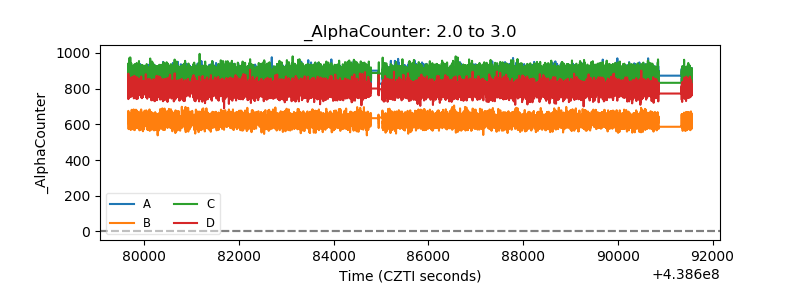 |
| _CPM_Rate | 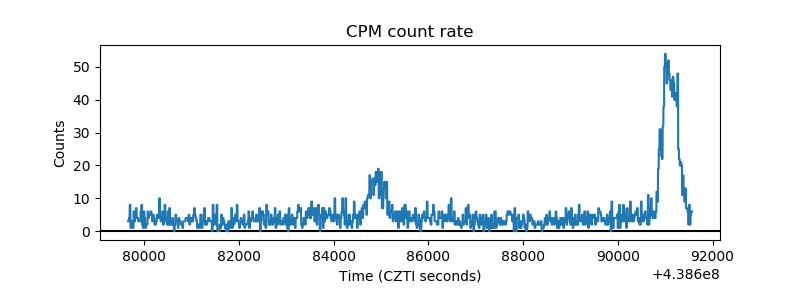 |
| CZT Counter | 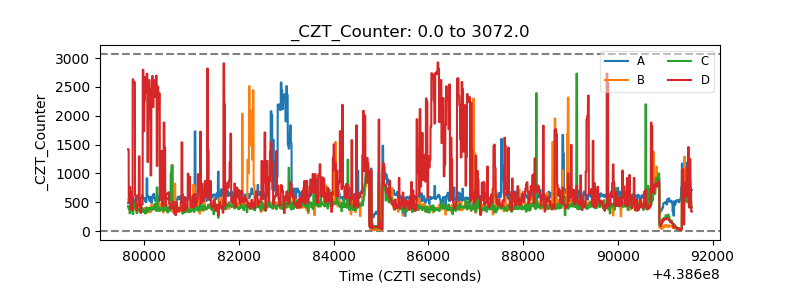 |
| +2.5 Volts monitor | 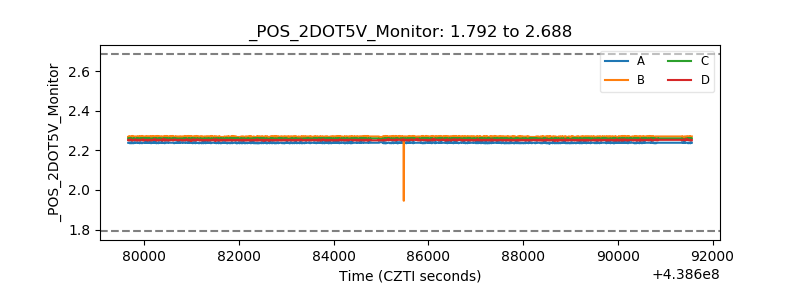 |
| +5 Volts monitor | 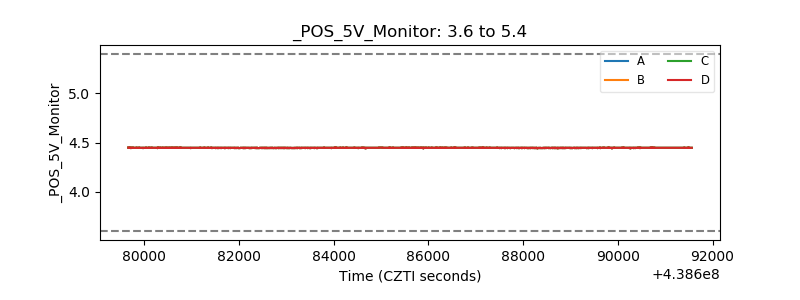 |
| _ROLL_ROT |  |
| _Roll_DEC | 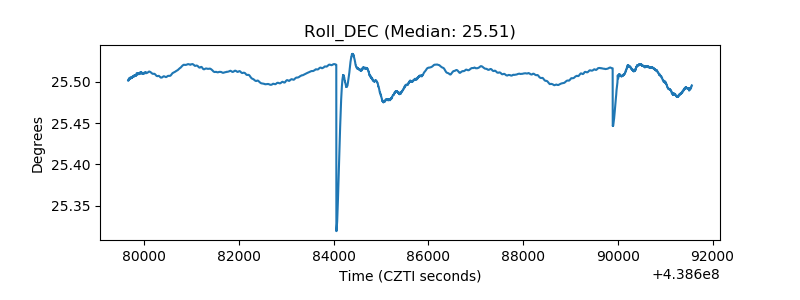 |
| _Roll_RA | 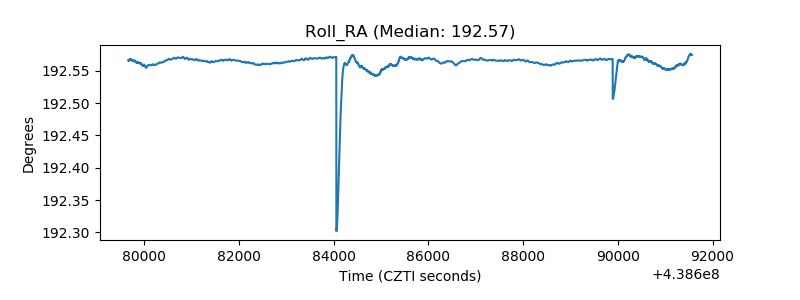 |
| Veto Counter | 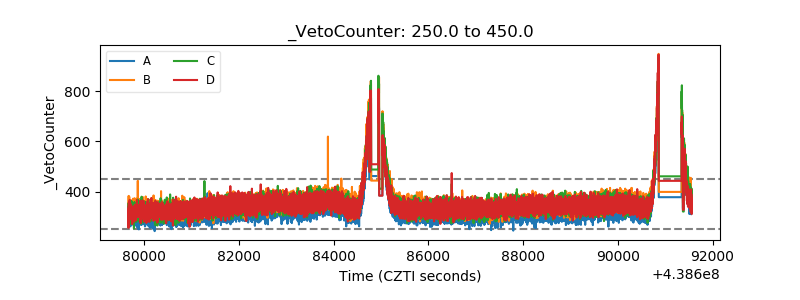 |