| Param | Original file | Final file |
|---|---|---|
| Filename | modeM0/AS1A13_012T02_9000005950_44135cztM0_level2.fits | modeM0/AS1A13_012T02_9000005950_44135cztM0_level2_quad_clean.evt |
| Size (bytes) | 444,873,600 | 111,202,560 |
| Size | 424.3 MB | 106.1 MB |
| Events in quadrant A | 4,553,371 | 736,691 |
| Events in quadrant B | 3,595,834 | 756,806 |
| Events in quadrant C | 3,633,127 | 728,892 |
| Events in quadrant D | 4,136,046 | 651,557 |
| Mode M9 | |||
|---|---|---|---|
| Quadrant | BADHDUFLAG | Total packets | Discarded packets |
| A | 0 | 7 | 0 |
| B | 0 | 8 | 0 |
| C | 0 | 8 | 0 |
| D | 0 | 8 | 0 |
| Mode SS | |||
|---|---|---|---|
| Quadrant | BADHDUFLAG | Total packets | Discarded packets |
| A | 0 | 144 | 0 |
| B | 0 | 144 | 0 |
| C | 0 | 144 | 0 |
| D | 0 | 144 | 0 |
| Mode M0 | |||
|---|---|---|---|
| Quadrant | BADHDUFLAG | Total packets | Discarded packets |
| A | 0 | 18828 | 3 |
| B | 0 | 15612 | 3 |
| C | 0 | 15852 | 3 |
| D | 0 | 17174 | 3 |
| Quadrant | Total seconds | Saturated seconds | Saturation percentage |
|---|---|---|---|
| A | 7069 | 157 | 2.220965% |
| B | 7069 | 203 | 2.871693% |
| C | 7069 | 99 | 1.400481% |
| D | 7069 | 253 | 3.579007% |
Noise dominated data is calculated using 1-second bins in cleaned event files. If a bin has >2000 counts, and if more than 50% of those come from <1% of pixels, then it is considered to be noise-dominated and hence unusable.
| Quadrant | # 1 sec bins | Bins with >0 counts | Bins with >2000 counts | High rate bins dominated by noise | Noise dominated (total time) | Noise dominated (detector-on time) | Marked lightcurve |
|---|---|---|---|---|---|---|---|
| A | 7864 | 7071 | 9 | 9 | 0.11% | 0.13% | 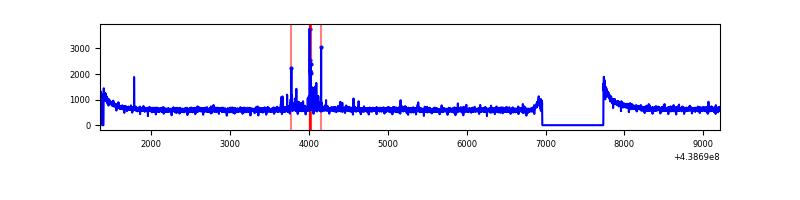 |
| B | 7864 | 7071 | 86 | 86 | 1.09% | 1.22% | 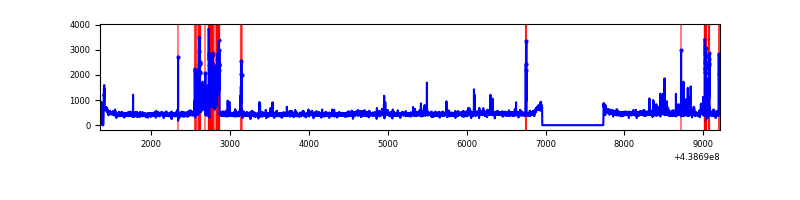 |
| C | 7864 | 7071 | 16 | 16 | 0.20% | 0.23% | 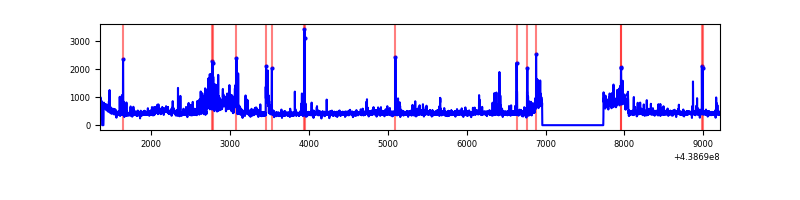 |
| D | 7864 | 7071 | 124 | 124 | 1.58% | 1.75% | 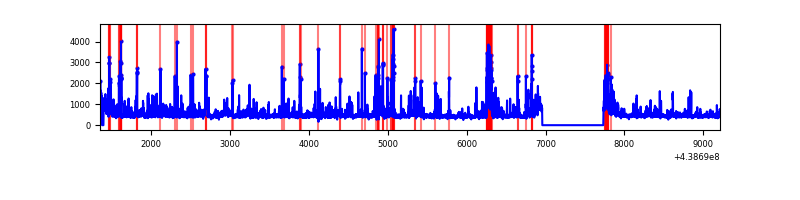 |
Top three noisy pixels from each quadrant. If the there are fewer than three noisy pixels in the level2.evt file, extra rows are filled as -1
| Pixel properties | Quadrant properties | ||||||
|---|---|---|---|---|---|---|---|
| Quadrant | DetID | PixID | Counts | Sigma | Mean | Median | Sigma |
| A | 10 | 83 | 1412100 | 8504.95 | 791 | 773 | 165.9 |
| A | 14 | 159 | 65733 | 391.46 | 791 | 773 | 165.9 |
| A | 13 | 6 | 16791 | 96.53 | 791 | 773 | 165.9 |
| B | 5 | 235 | 236437 | 1521.62 | 781 | 758 | 154.9 |
| B | 5 | 172 | 162682 | 1045.43 | 781 | 758 | 154.9 |
| B | 0 | 200 | 82290 | 526.4 | 781 | 758 | 154.9 |
| C | 1 | 241 | 316523 | 1726.69 | 773 | 776 | 182.9 |
| C | 14 | 96 | 169506 | 922.71 | 773 | 776 | 182.9 |
| C | 14 | 254 | 68515 | 370.44 | 773 | 776 | 182.9 |
| D | 5 | 235 | 266884 | 1370.68 | 767 | 743 | 194.2 |
| D | 2 | 249 | 136759 | 700.51 | 767 | 743 | 194.2 |
| D | 7 | 204 | 126354 | 646.92 | 767 | 743 | 194.2 |
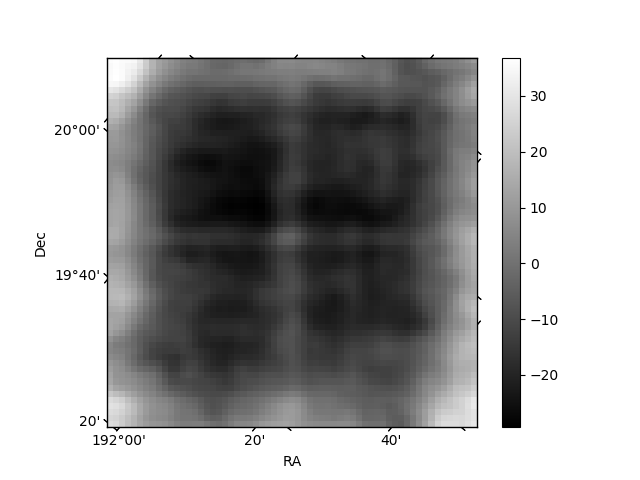
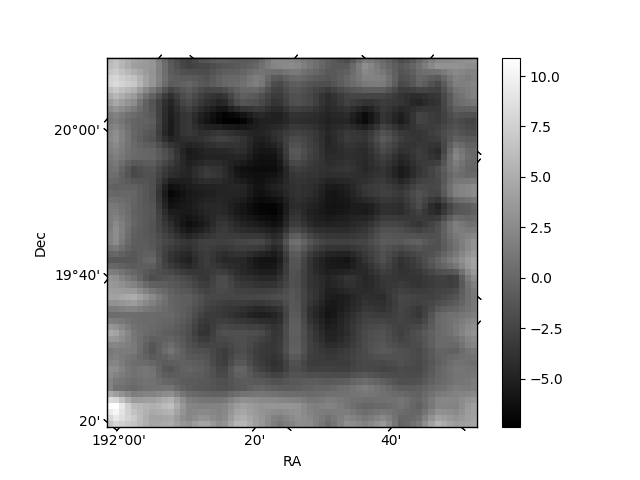
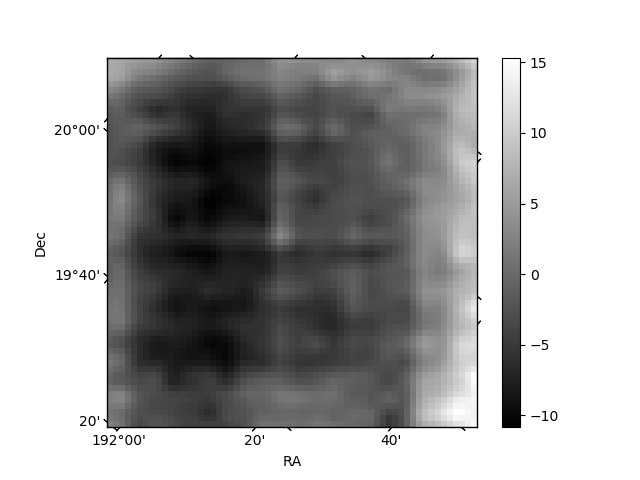
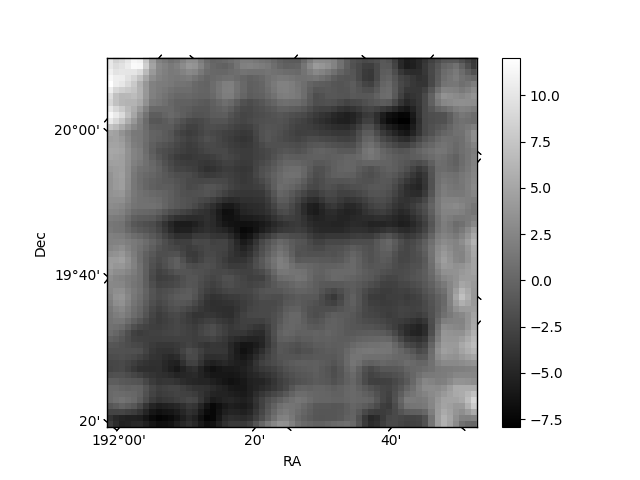
Histogram calculated using DETX and DETY for each event in the final _common_clean file
| Quadrant A | 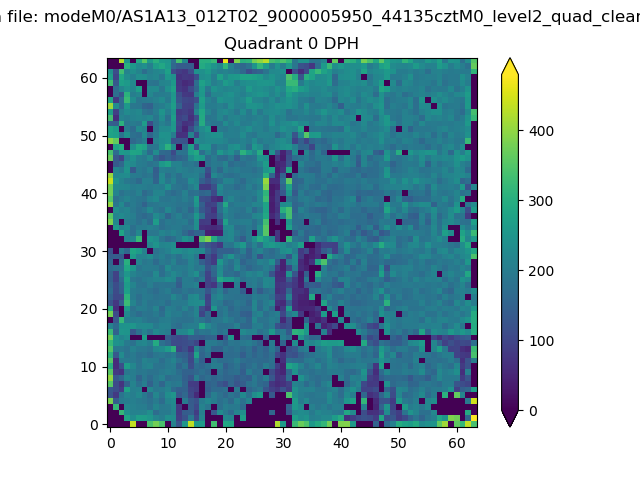 |
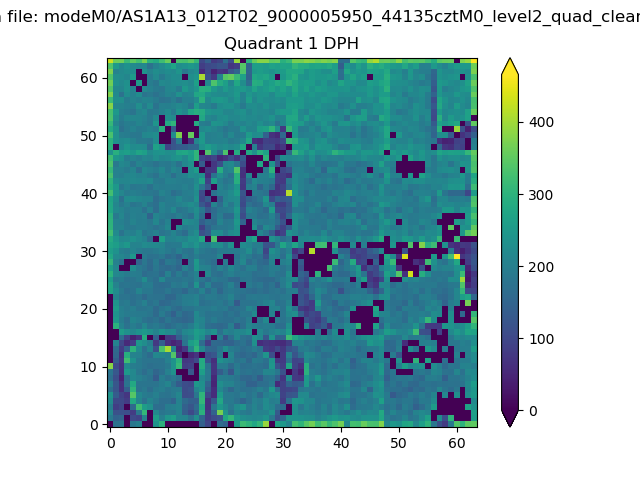 |
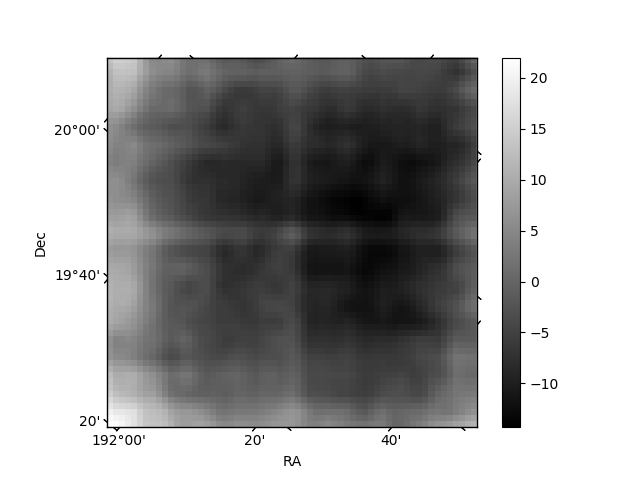
Quadrant B |
|---|---|---|---|
| Quadrant D | 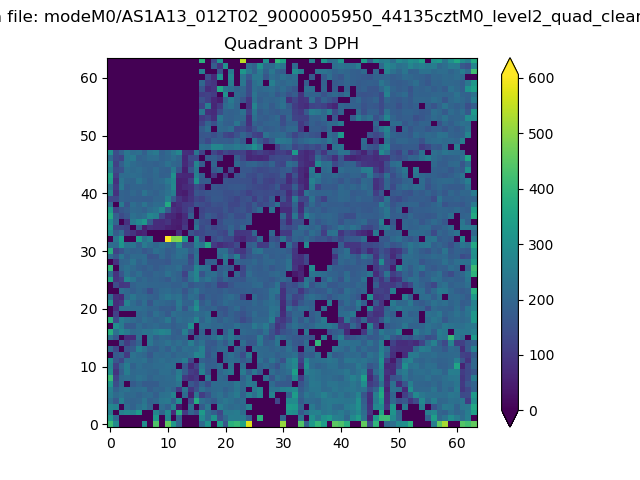 |
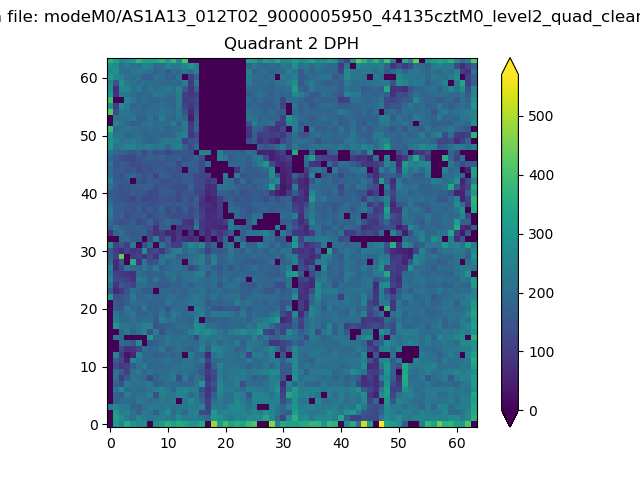 |
Quadrant C |
| Plot type | Count rate plots | Images |
|---|---|---|
| Comparison with Poisson distribution Blue bars denote a histogram of data divided into 1 sec bins. Red curve is a Poisson curve with rate = median count rate of data. |
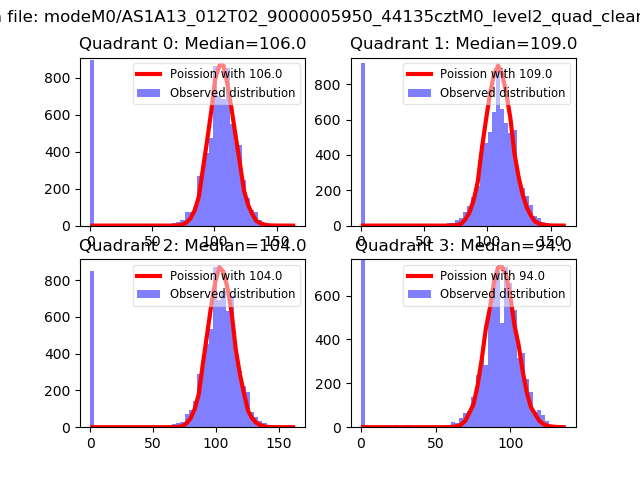 |
 |
| Quadrant-wise count rates Data is divided into 100 sec bins |
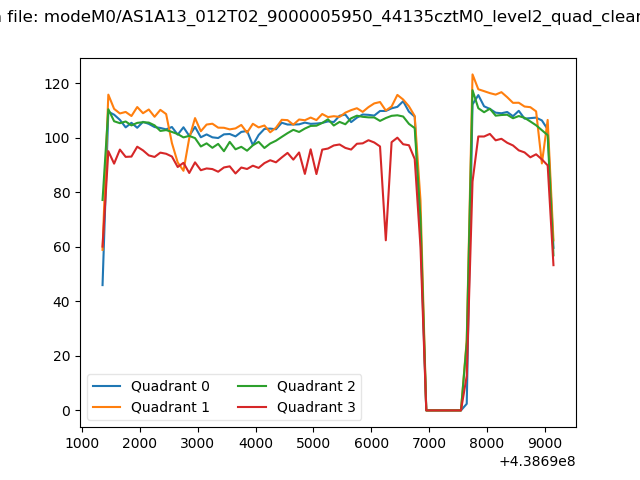 |
|
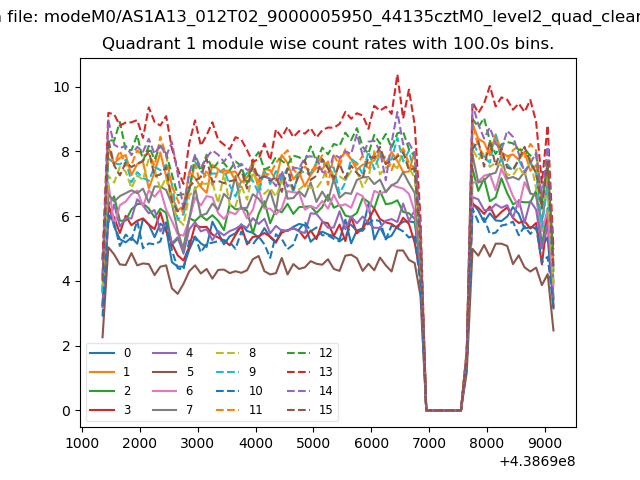
| Module-wise count rates for Quadrant A Data is divided into 100 sec bins |
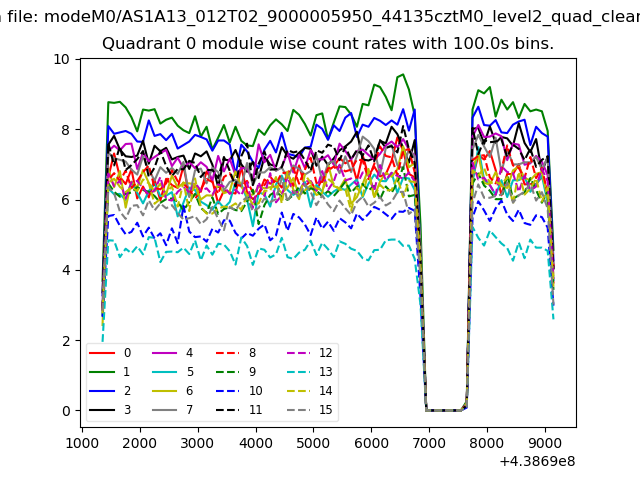 |
 |
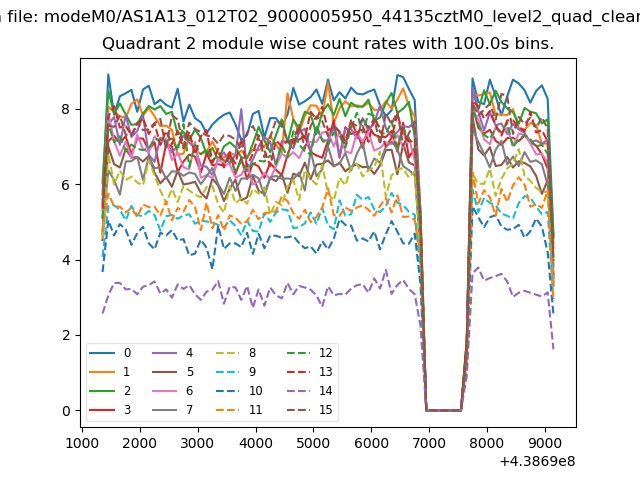
| Module-wise count rates for Quadrant B Data is divided into 100 sec bins |
 |
 |
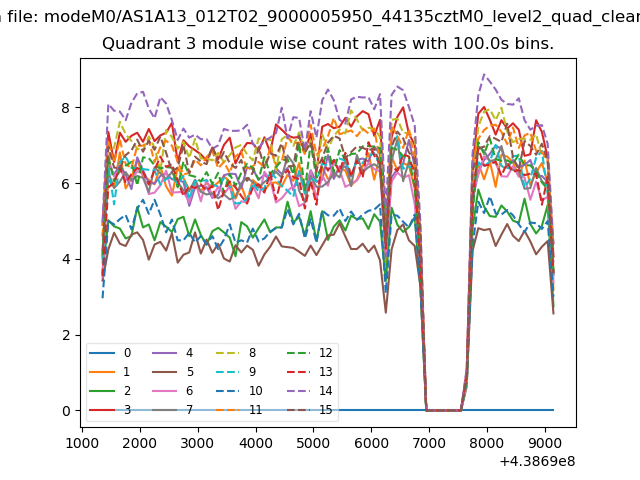
| Module-wise count rates for Quadrant C Data is divided into 100 sec bins |
 |
 |
| Module-wise count rates for Quadrant D Data is divided into 100 sec bins |
 |
 |
| Parameter | Plot |
|---|---|
| CZT HV Monitor | 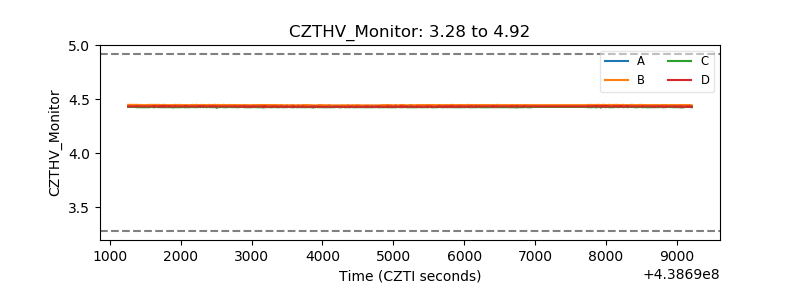 |
| D_VDD | 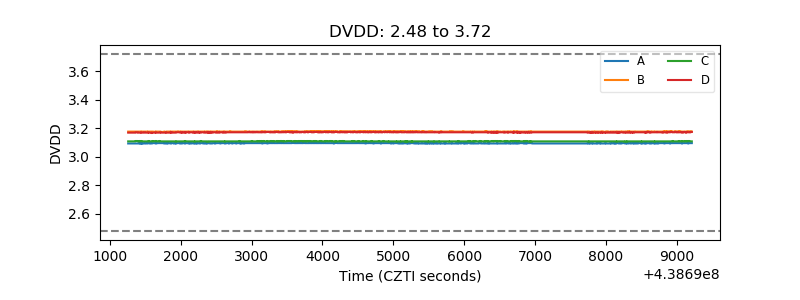 |
| Temperature 1 | 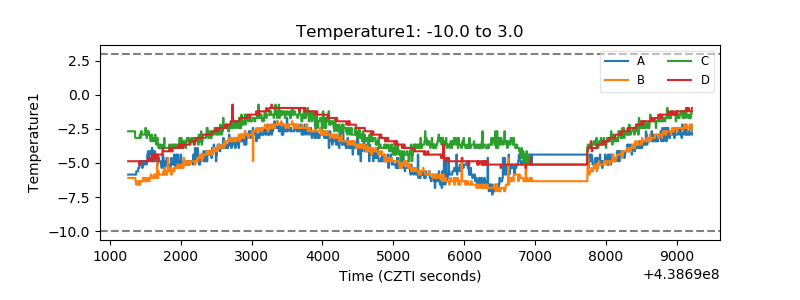 |
| Veto HV Monitor | 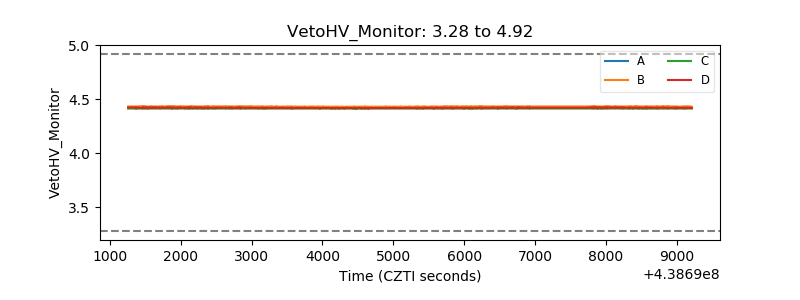 |
| Veto LLD | 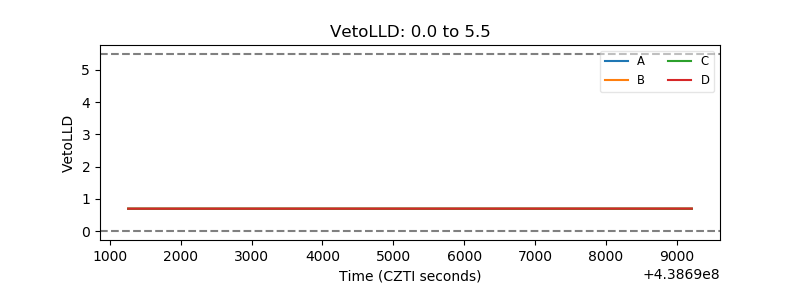 |
| Alpha Counter | 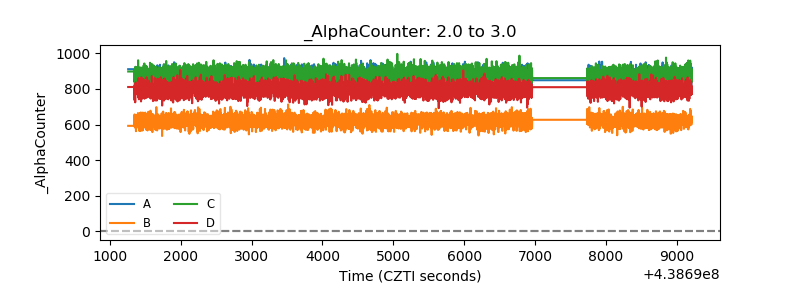 |
| _CPM_Rate | 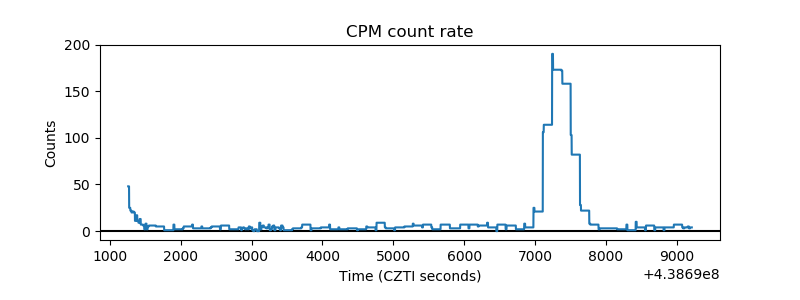 |
| CZT Counter | 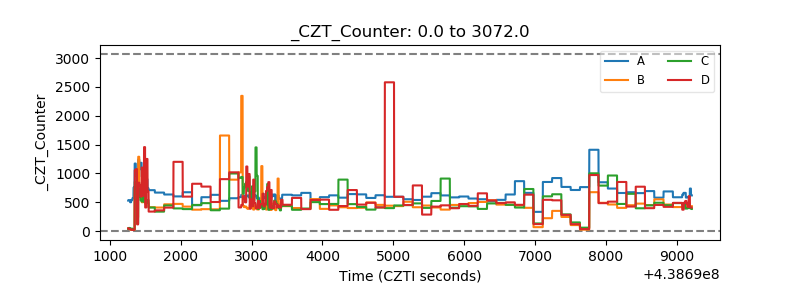 |
| +2.5 Volts monitor | 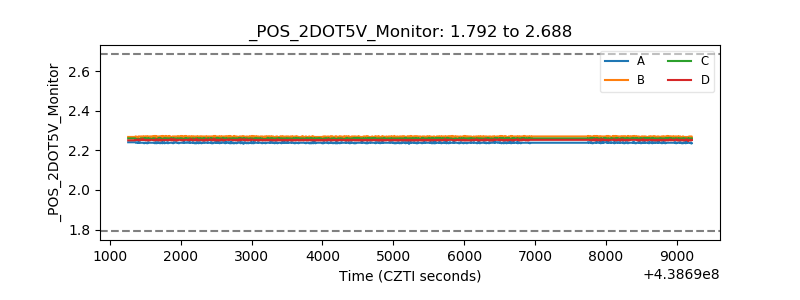 |
| +5 Volts monitor | 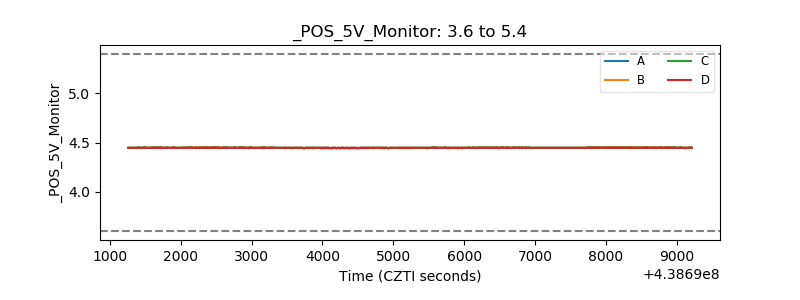 |
| _ROLL_ROT | 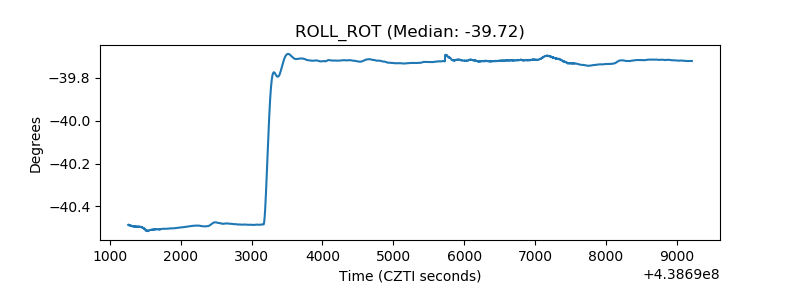 |
| _Roll_DEC | 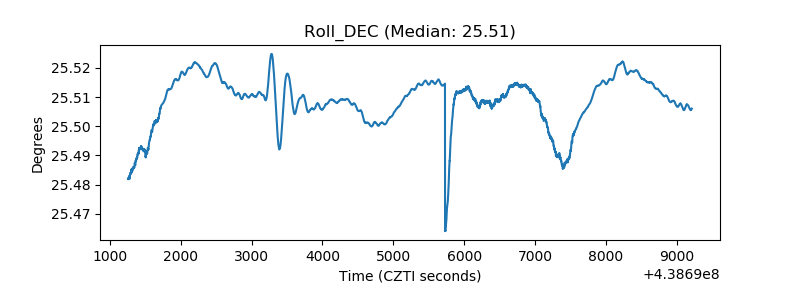 |
| _Roll_RA | 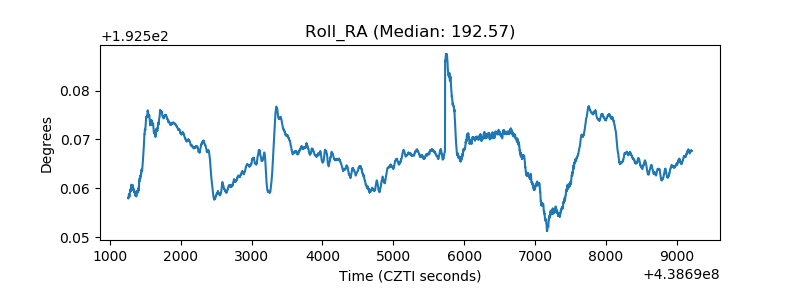 |
| Veto Counter | 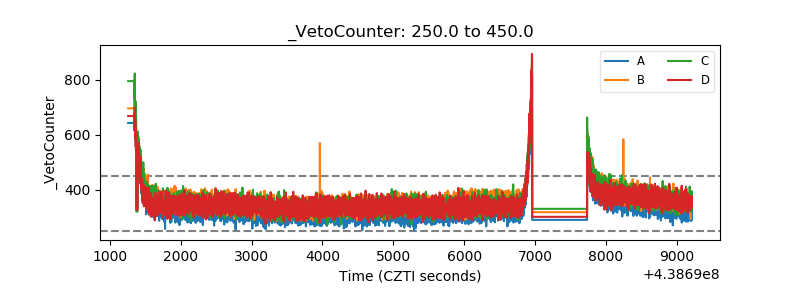 |