| Param | Original file | Final file |
|---|---|---|
| Filename | modeM0/AS1A13_012T02_9000005950_44136cztM0_level2.fits | modeM0/AS1A13_012T02_9000005950_44136cztM0_level2_quad_clean.evt |
| Size (bytes) | 442,578,240 | 109,235,520 |
| Size | 422.1 MB | 104.2 MB |
| Events in quadrant A | 4,474,549 | 729,665 |
| Events in quadrant B | 3,671,518 | 738,230 |
| Events in quadrant C | 3,758,997 | 715,526 |
| Events in quadrant D | 3,949,975 | 650,405 |
| Mode M9 | |||
|---|---|---|---|
| Quadrant | BADHDUFLAG | Total packets | Discarded packets |
| A | 0 | 9 | 0 |
| B | 0 | 10 | 0 |
| C | 0 | 10 | 0 |
| D | 0 | 10 | 0 |
| Mode SS | |||
|---|---|---|---|
| Quadrant | BADHDUFLAG | Total packets | Discarded packets |
| A | 0 | 140 | 0 |
| B | 0 | 140 | 0 |
| C | 0 | 140 | 0 |
| D | 0 | 140 | 0 |
| Mode M0 | |||
|---|---|---|---|
| Quadrant | BADHDUFLAG | Total packets | Discarded packets |
| A | 0 | 18382 | 2 |
| B | 0 | 15459 | 2 |
| C | 0 | 15959 | 2 |
| D | 0 | 16475 | 2 |
| Quadrant | Total seconds | Saturated seconds | Saturation percentage |
|---|---|---|---|
| A | 6788 | 126 | 1.856217% |
| B | 6788 | 243 | 3.579847% |
| C | 6788 | 130 | 1.915144% |
| D | 6787 | 179 | 2.637395% |
Noise dominated data is calculated using 1-second bins in cleaned event files. If a bin has >2000 counts, and if more than 50% of those come from <1% of pixels, then it is considered to be noise-dominated and hence unusable.
| Quadrant | # 1 sec bins | Bins with >0 counts | Bins with >2000 counts | High rate bins dominated by noise | Noise dominated (total time) | Noise dominated (detector-on time) | Marked lightcurve |
|---|---|---|---|---|---|---|---|
| A | 7728 | 6789 | 0 | 0 | 0.00% | 0.00% | 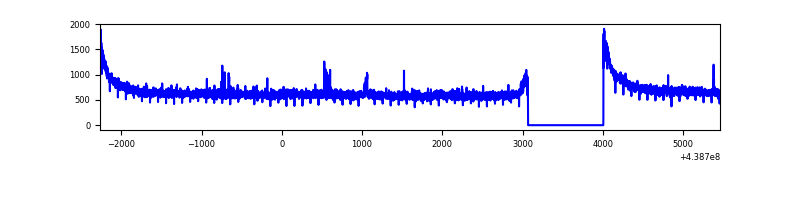 |
| B | 7728 | 6789 | 124 | 124 | 1.60% | 1.83% | 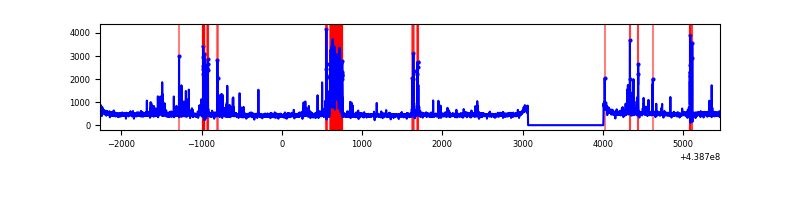 |
| C | 7728 | 6789 | 75 | 75 | 0.97% | 1.10% |  |
| D | 7727 | 6788 | 90 | 90 | 1.16% | 1.33% | 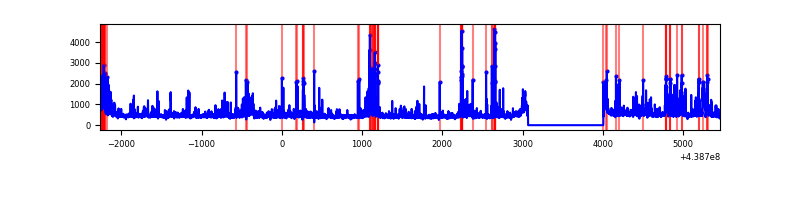 |
Top three noisy pixels from each quadrant. If the there are fewer than three noisy pixels in the level2.evt file, extra rows are filled as -1
| Pixel properties | Quadrant properties | ||||||
|---|---|---|---|---|---|---|---|
| Quadrant | DetID | PixID | Counts | Sigma | Mean | Median | Sigma |
| A | 10 | 83 | 1438707 | 8899.0 | 775 | 758 | 161.6 |
| A | 13 | 6 | 16575 | 97.89 | 775 | 758 | 161.6 |
| A | 7 | 3 | 11901 | 68.96 | 775 | 758 | 161.6 |
| B | 5 | 172 | 510103 | 3340.2 | 763 | 738 | 152.5 |
| B | 0 | 200 | 54466 | 352.33 | 763 | 738 | 152.5 |
| B | 12 | 111 | 18969 | 119.55 | 763 | 738 | 152.5 |
| C | 12 | 16 | 435968 | 2414.26 | 758 | 761 | 180.3 |
| C | 14 | 254 | 170329 | 940.66 | 758 | 761 | 180.3 |
| C | 1 | 241 | 154895 | 855.04 | 758 | 761 | 180.3 |
| D | 5 | 235 | 185787 | 973.58 | 757 | 735 | 190.1 |
| D | 2 | 249 | 169463 | 887.7 | 757 | 735 | 190.1 |
| D | 12 | 233 | 165539 | 867.05 | 757 | 735 | 190.1 |
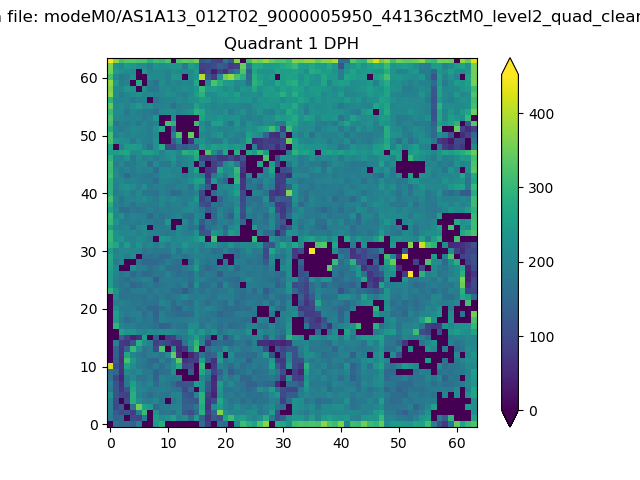
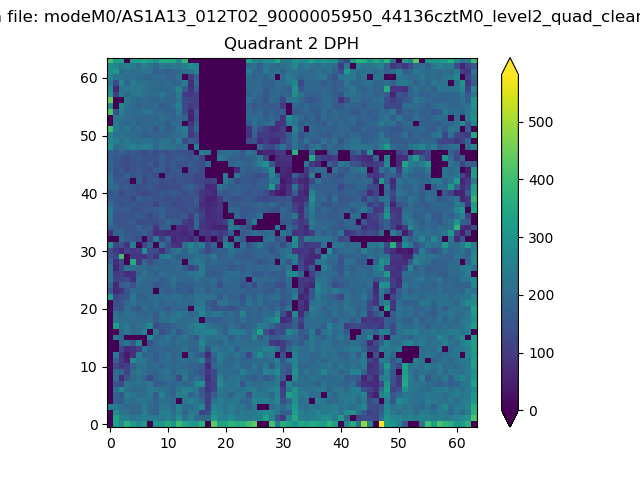
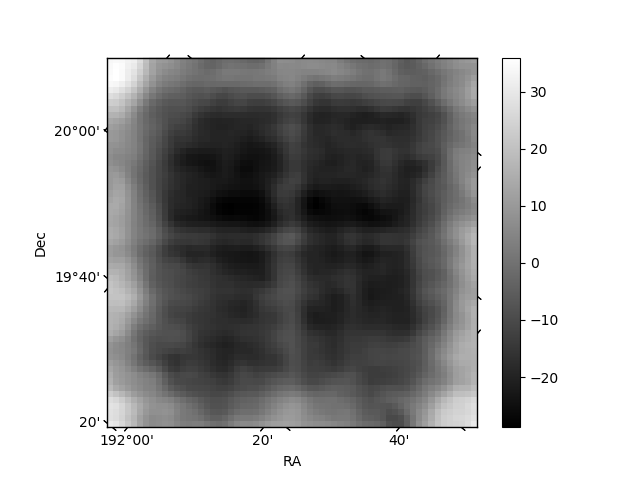
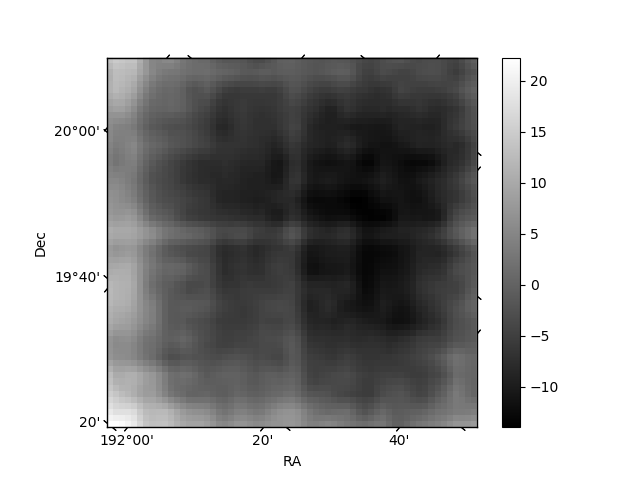
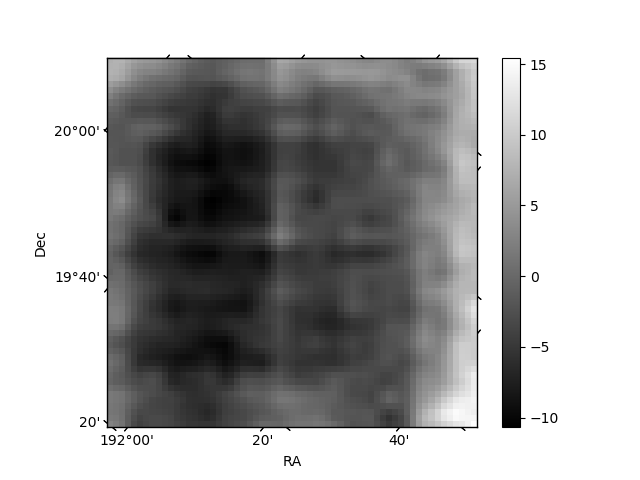
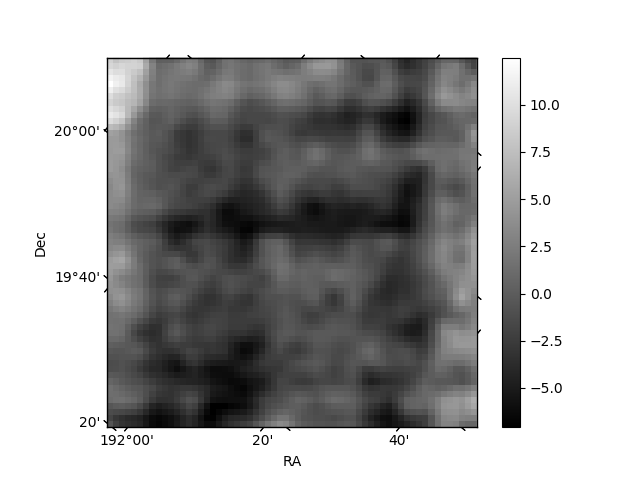
Histogram calculated using DETX and DETY for each event in the final _common_clean file
| Quadrant A | 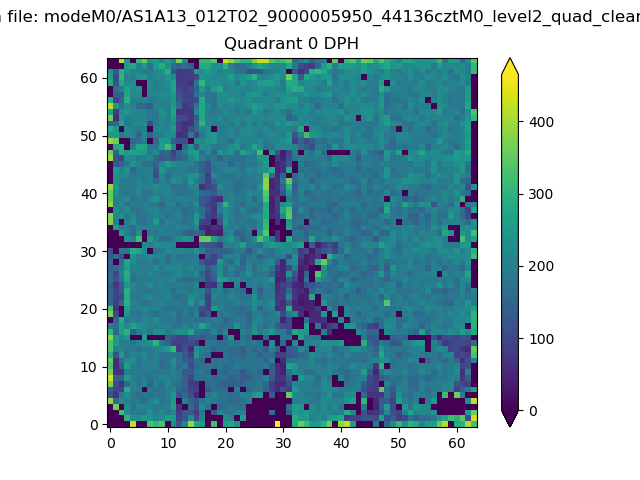 |
 |
Quadrant B |
|---|---|---|---|
| Quadrant D | 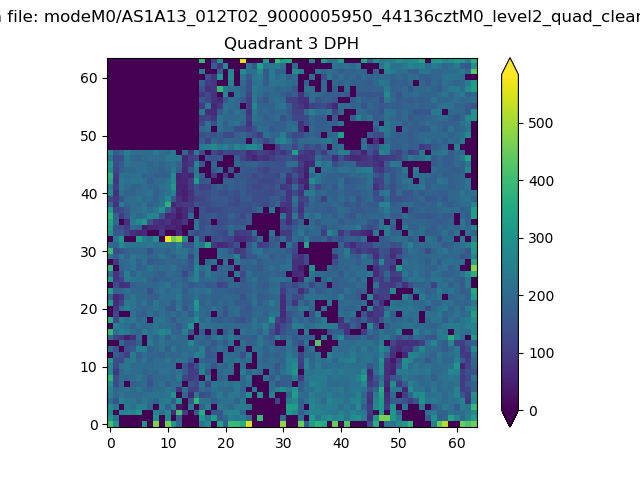 |
 |
Quadrant C |
| Plot type | Count rate plots | Images |
|---|---|---|
| Comparison with Poisson distribution Blue bars denote a histogram of data divided into 1 sec bins. Red curve is a Poisson curve with rate = median count rate of data. |
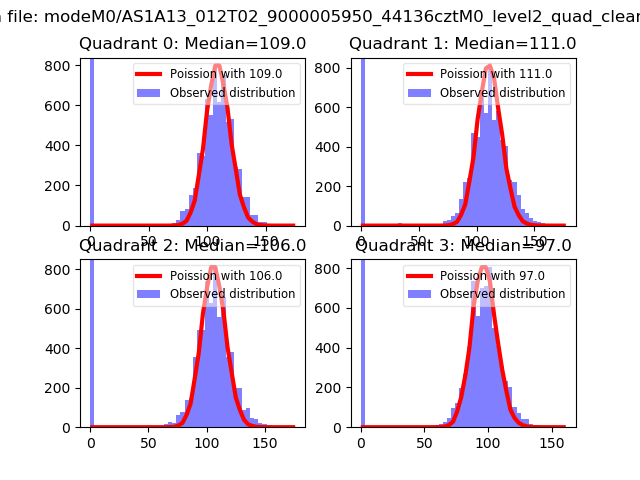 |
 |
| Quadrant-wise count rates Data is divided into 100 sec bins |
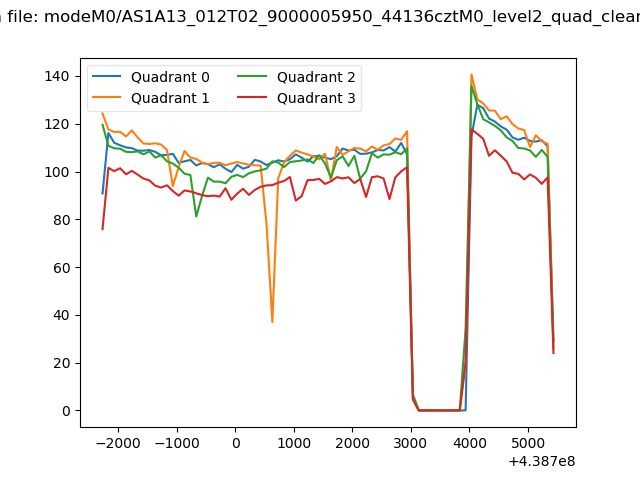 |
|
| Module-wise count rates for Quadrant A Data is divided into 100 sec bins |
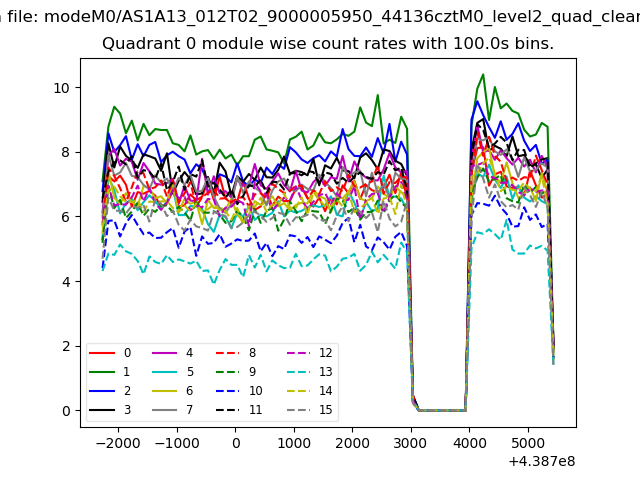 |
 |
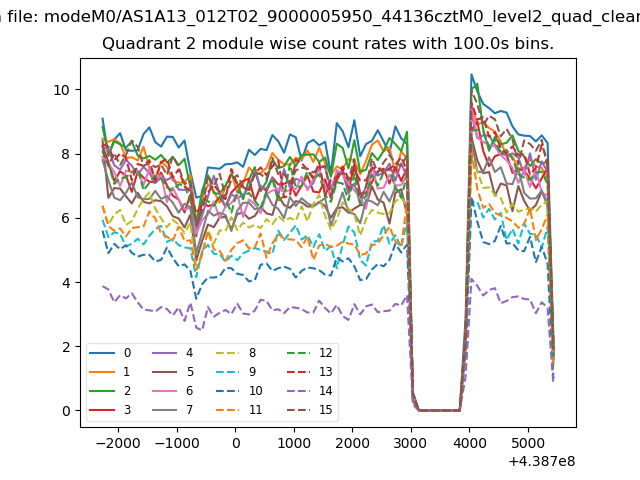
| Module-wise count rates for Quadrant B Data is divided into 100 sec bins |
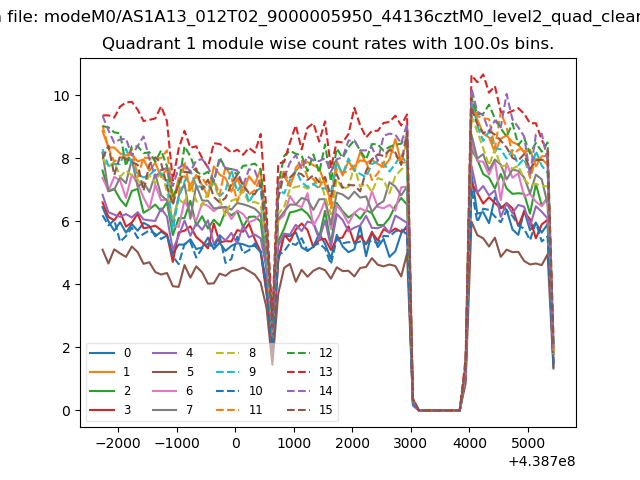 |
 |
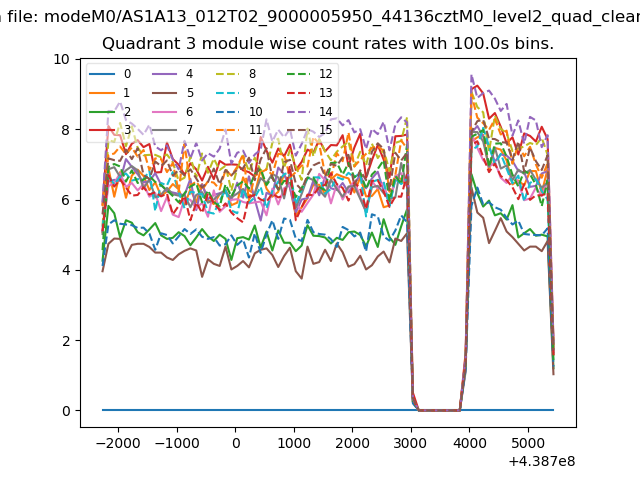
| Module-wise count rates for Quadrant C Data is divided into 100 sec bins |
 |
 |
| Module-wise count rates for Quadrant D Data is divided into 100 sec bins |
 |
 |
| Parameter | Plot |
|---|---|
| CZT HV Monitor | 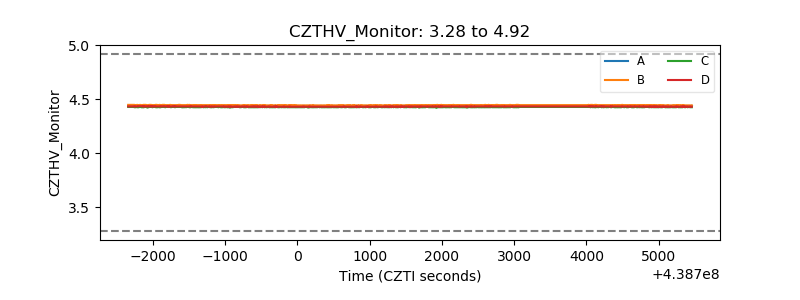 |
| D_VDD | 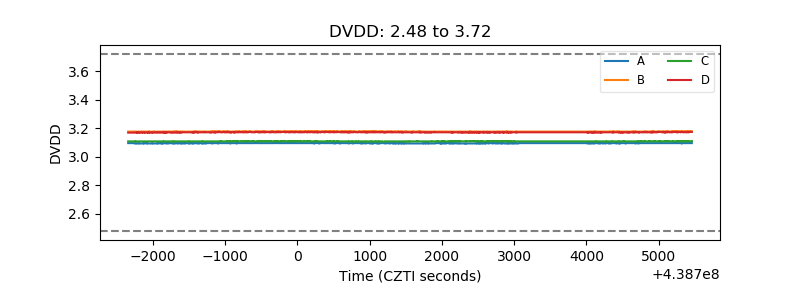 |
| Temperature 1 | 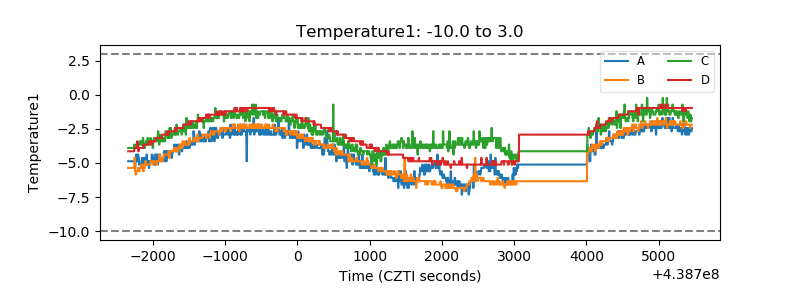 |
| Veto HV Monitor | 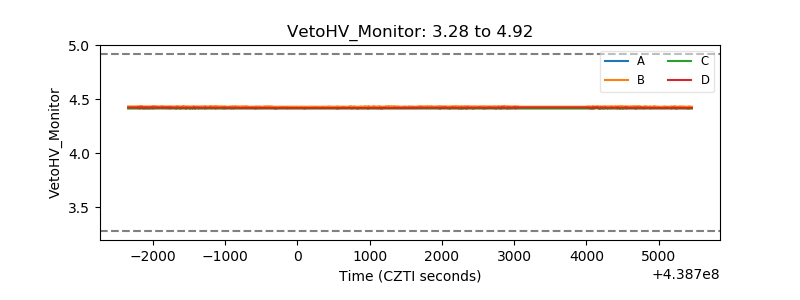 |
| Veto LLD | 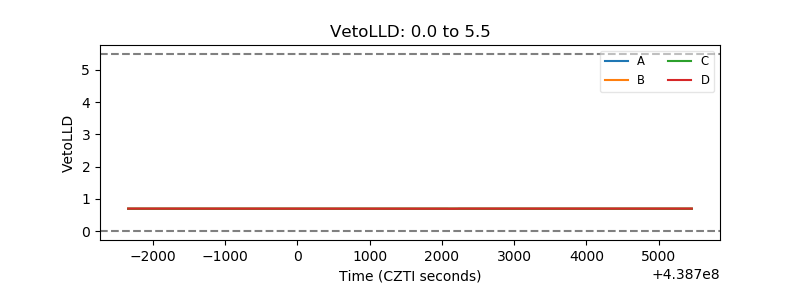 |
| Alpha Counter | 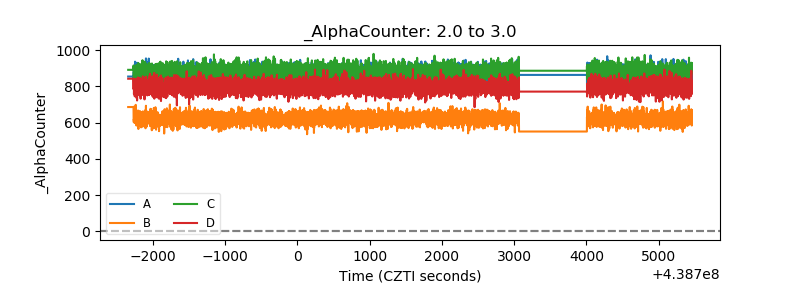 |
| _CPM_Rate | 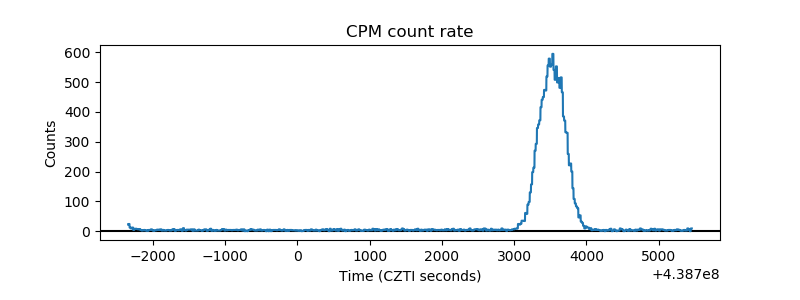 |
| CZT Counter | 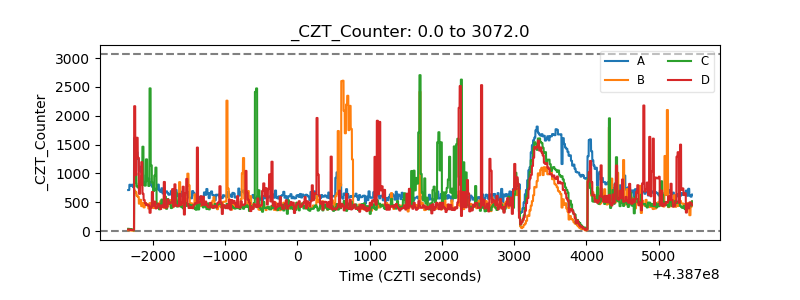 |
| +2.5 Volts monitor | 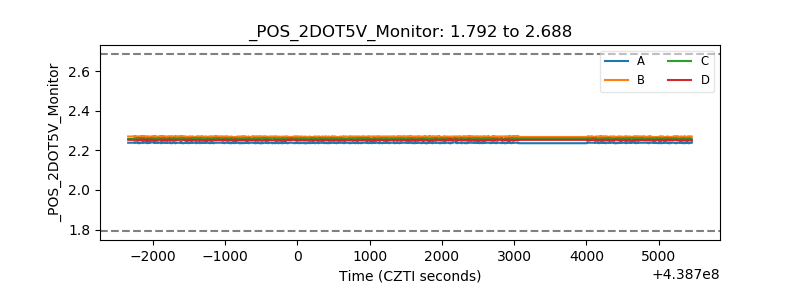 |
| +5 Volts monitor | 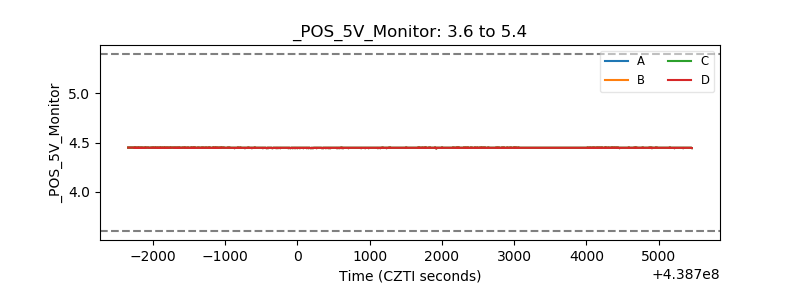 |
| _ROLL_ROT | 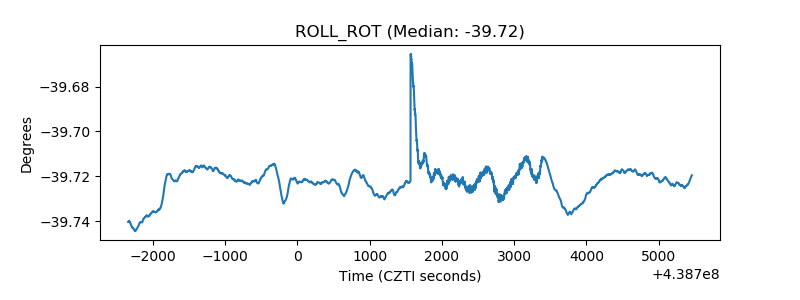 |
| _Roll_DEC | 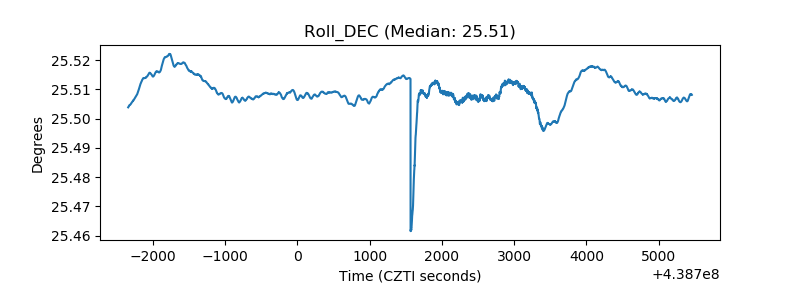 |
| _Roll_RA | 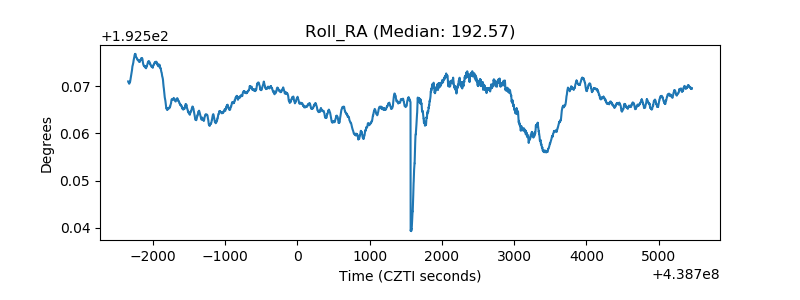 |
| Veto Counter | 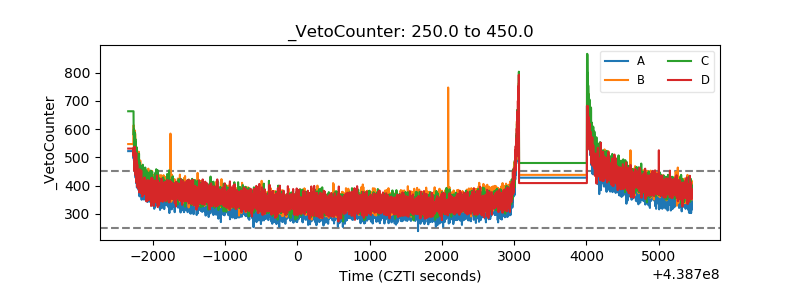 |