| Param | Original file | Final file |
|---|---|---|
| Filename | modeM0/AS1A13_012T02_9000005950_44138cztM0_level2.fits | modeM0/AS1A13_012T02_9000005950_44138cztM0_level2_quad_clean.evt |
| Size (bytes) | 377,530,560 | 95,273,280 |
| Size | 360.0 MB | 90.9 MB |
| Events in quadrant A | 3,838,688 | 643,917 |
| Events in quadrant B | 2,936,422 | 658,072 |
| Events in quadrant C | 2,827,375 | 630,324 |
| Events in quadrant D | 3,938,124 | 561,418 |
| Mode M9 | |||
|---|---|---|---|
| Quadrant | BADHDUFLAG | Total packets | Discarded packets |
| A | 0 | 8 | 1 |
| B | 0 | 8 | 1 |
| C | 0 | 8 | 1 |
| D | 0 | 8 | 1 |
| Mode SS | |||
|---|---|---|---|
| Quadrant | BADHDUFLAG | Total packets | Discarded packets |
| A | 0 | 114 | 0 |
| B | 0 | 114 | 2 |
| C | 0 | 114 | 0 |
| D | 0 | 114 | 1 |
| Mode M0 | |||
|---|---|---|---|
| Quadrant | BADHDUFLAG | Total packets | Discarded packets |
| A | 0 | 15739 | 58 |
| B | 0 | 12410 | 54 |
| C | 0 | 12211 | 63 |
| D | 0 | 15546 | 64 |
| Quadrant | Total seconds | Saturated seconds | Saturation percentage |
|---|---|---|---|
| A | 5588 | 51 | 0.912670% |
| B | 5584 | 101 | 1.808739% |
| C | 5588 | 37 | 0.662133% |
| D | 5584 | 237 | 4.244269% |
Noise dominated data is calculated using 1-second bins in cleaned event files. If a bin has >2000 counts, and if more than 50% of those come from <1% of pixels, then it is considered to be noise-dominated and hence unusable.
| Quadrant | # 1 sec bins | Bins with >0 counts | Bins with >2000 counts | High rate bins dominated by noise | Noise dominated (total time) | Noise dominated (detector-on time) | Marked lightcurve |
|---|---|---|---|---|---|---|---|
| A | 7616 | 5595 | 0 | 0 | 0.00% | 0.00% |  |
| B | 7616 | 5592 | 42 | 42 | 0.55% | 0.75% |  |
| C | 7617 | 5594 | 28 | 28 | 0.37% | 0.50% | 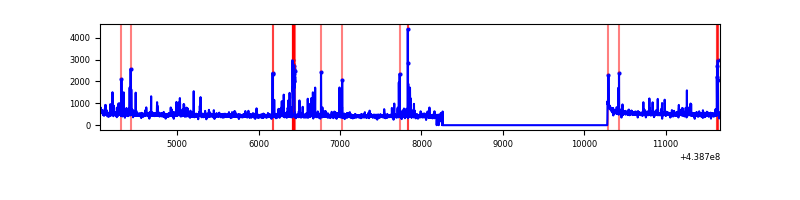 |
| D | 7616 | 5591 | 179 | 179 | 2.35% | 3.20% | 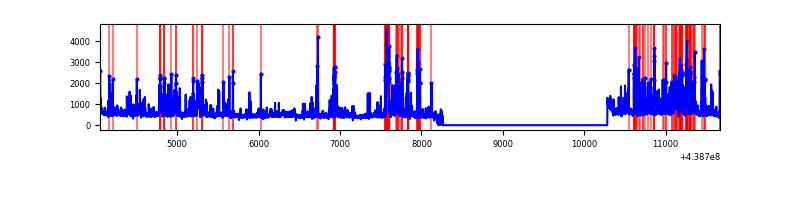 |
Top three noisy pixels from each quadrant. If the there are fewer than three noisy pixels in the level2.evt file, extra rows are filled as -1
| Pixel properties | Quadrant properties | ||||||
|---|---|---|---|---|---|---|---|
| Quadrant | DetID | PixID | Counts | Sigma | Mean | Median | Sigma |
| A | 10 | 83 | 1268488 | 9307.9 | 657 | 643 | 136.2 |
| A | 7 | 3 | 12983 | 90.59 | 657 | 643 | 136.2 |
| A | 13 | 6 | 10463 | 72.09 | 657 | 643 | 136.2 |
| B | 5 | 172 | 245250 | 1932.2 | 651 | 634 | 126.6 |
| B | 4 | 158 | 44707 | 348.13 | 651 | 634 | 126.6 |
| B | 0 | 183 | 25307 | 194.89 | 651 | 634 | 126.6 |
| C | 14 | 254 | 176828 | 1160.47 | 648 | 653 | 151.8 |
| C | 14 | 96 | 99322 | 649.93 | 648 | 653 | 151.8 |
| C | 1 | 241 | 14264 | 89.66 | 648 | 653 | 151.8 |
| D | 12 | 233 | 282685 | 1759.96 | 640 | 623 | 160.3 |
| D | 1 | 47 | 275862 | 1717.38 | 640 | 623 | 160.3 |
| D | 7 | 204 | 257901 | 1605.31 | 640 | 623 | 160.3 |
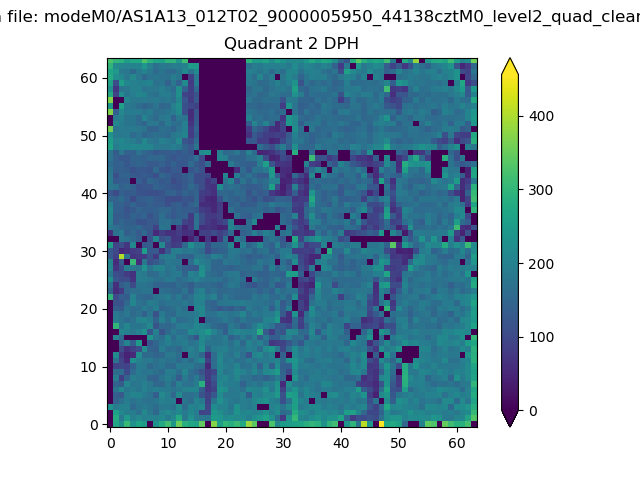
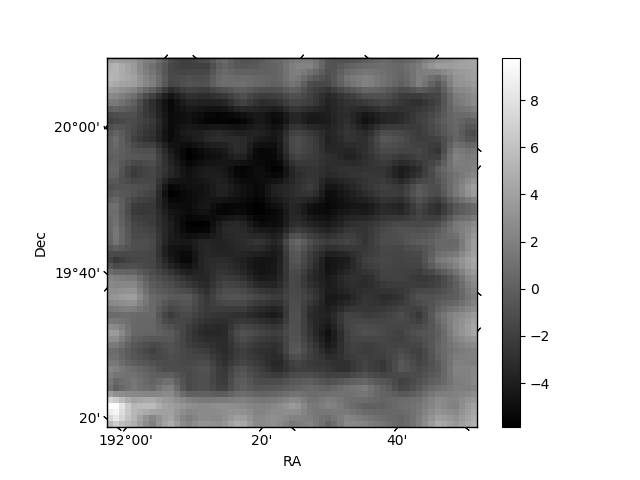
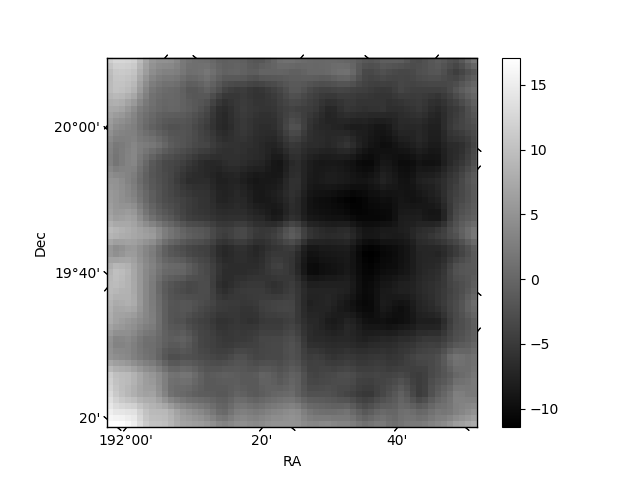
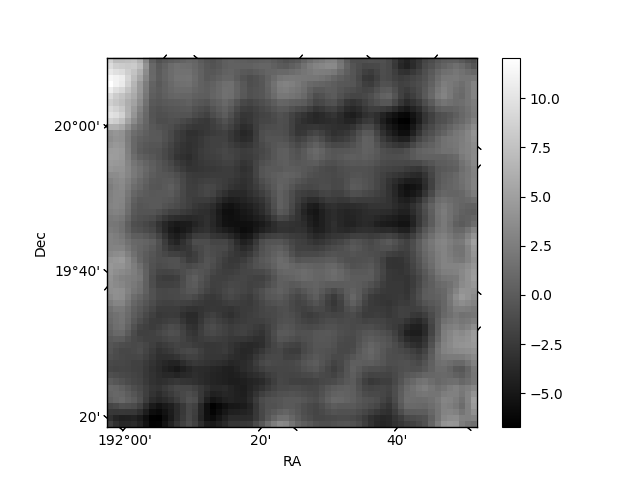
Histogram calculated using DETX and DETY for each event in the final _common_clean file
| Quadrant A | 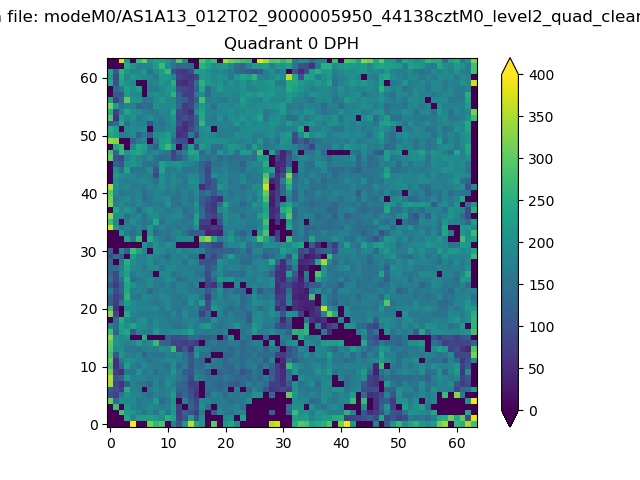 |
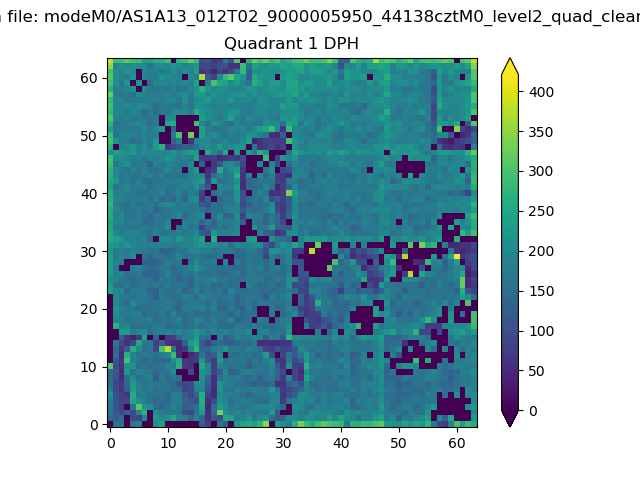 |
Quadrant B |
|---|---|---|---|
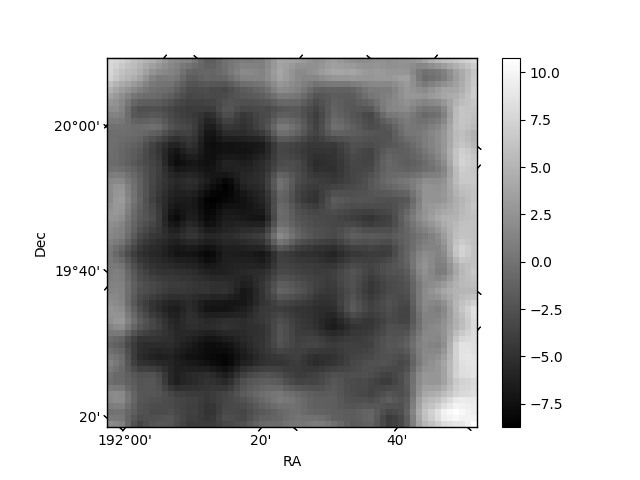
| Quadrant D | 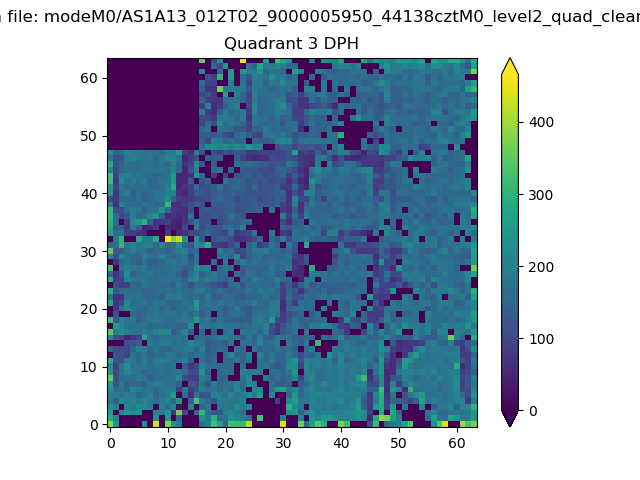 |
 |
Quadrant C |
| Plot type | Count rate plots | Images |
|---|---|---|
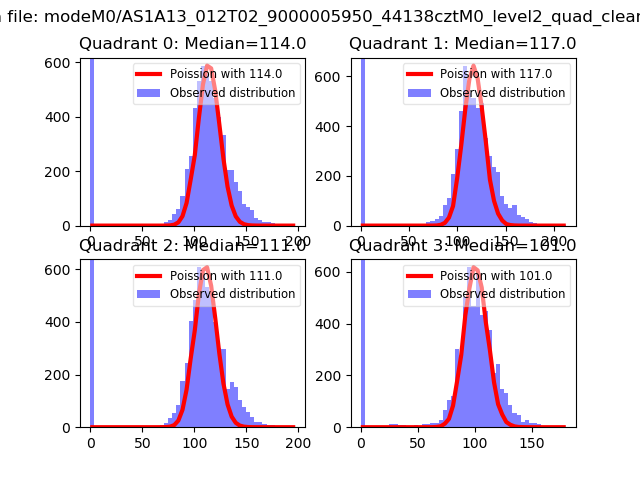
| Comparison with Poisson distribution Blue bars denote a histogram of data divided into 1 sec bins. Red curve is a Poisson curve with rate = median count rate of data. |
 |
 |
| Quadrant-wise count rates Data is divided into 100 sec bins |
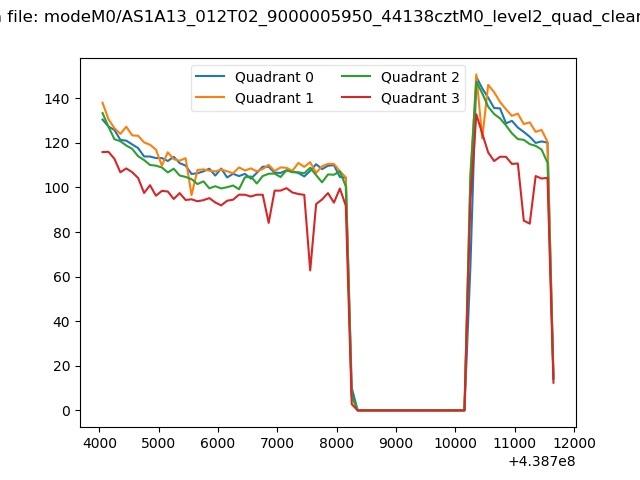 |
|
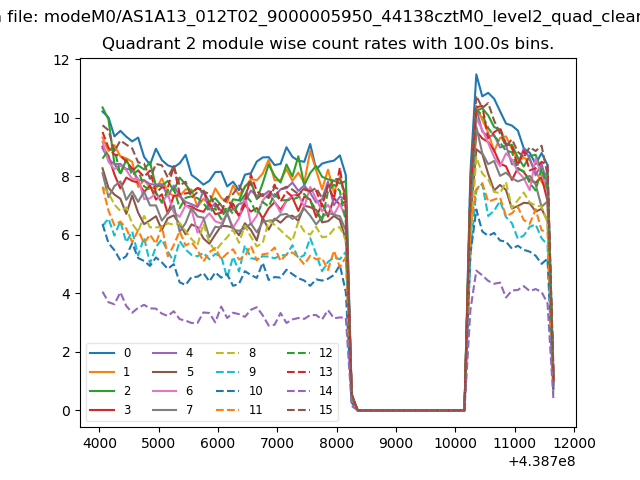
| Module-wise count rates for Quadrant A Data is divided into 100 sec bins |
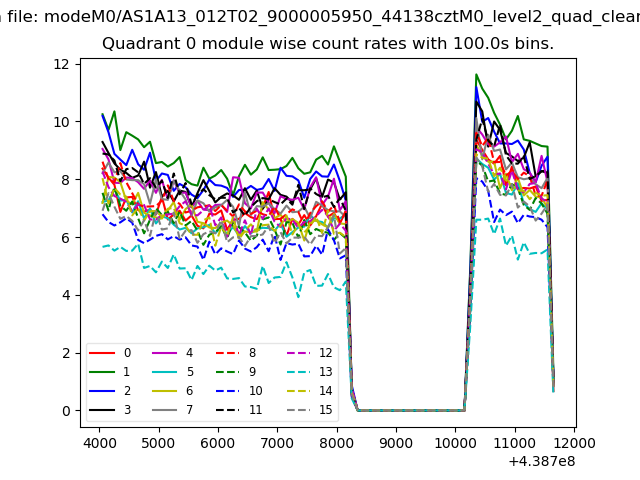 |
 |
| Module-wise count rates for Quadrant B Data is divided into 100 sec bins |
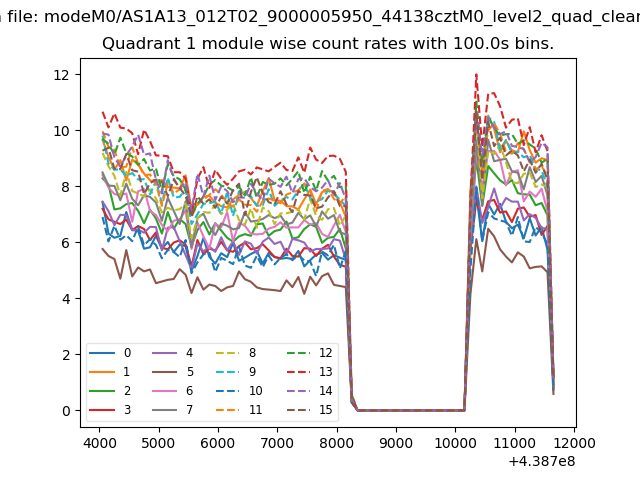 |
 |
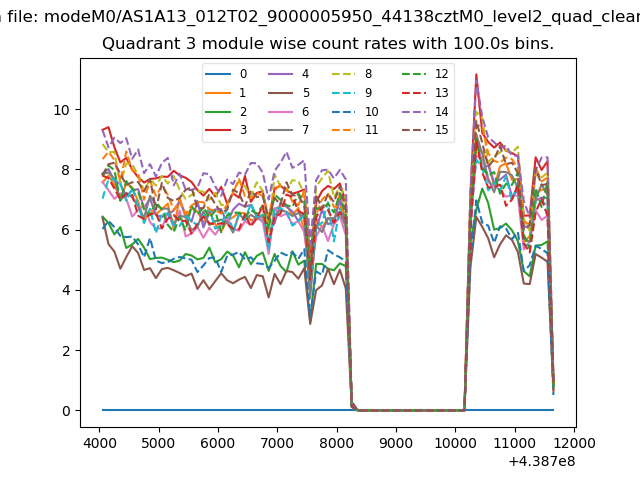
| Module-wise count rates for Quadrant C Data is divided into 100 sec bins |
 |
 |
| Module-wise count rates for Quadrant D Data is divided into 100 sec bins |
 |
 |
| Parameter | Plot |
|---|---|
| CZT HV Monitor | 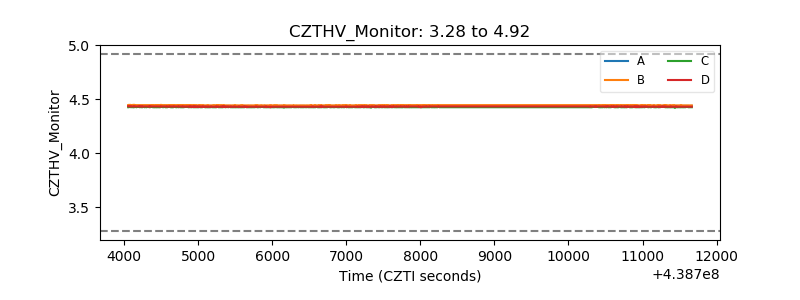 |
| D_VDD | 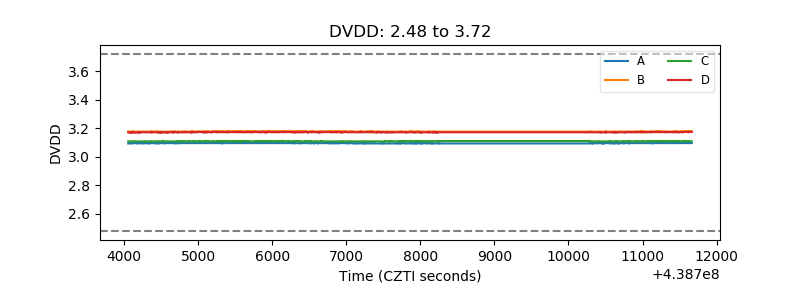 |
| Temperature 1 | 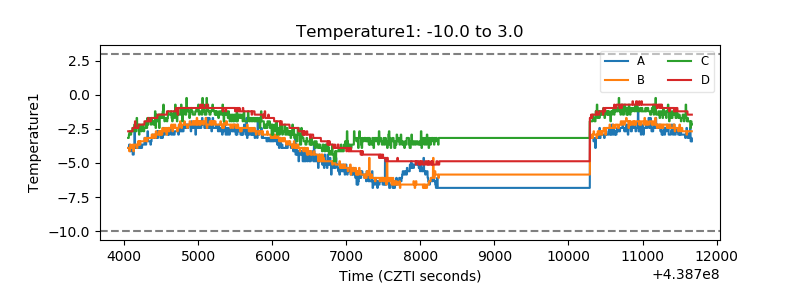 |
| Veto HV Monitor | 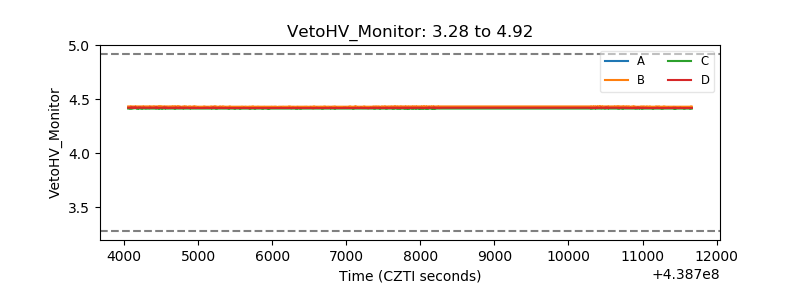 |
| Veto LLD | 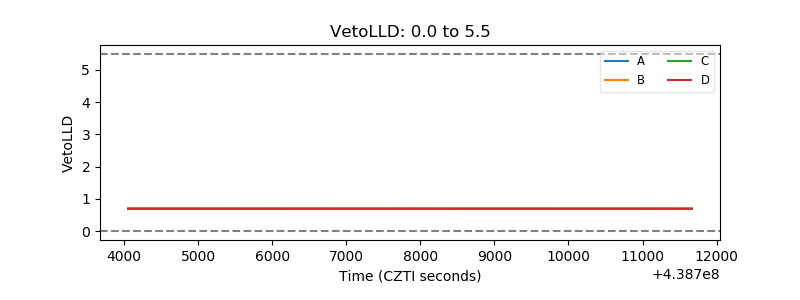 |
| Alpha Counter | 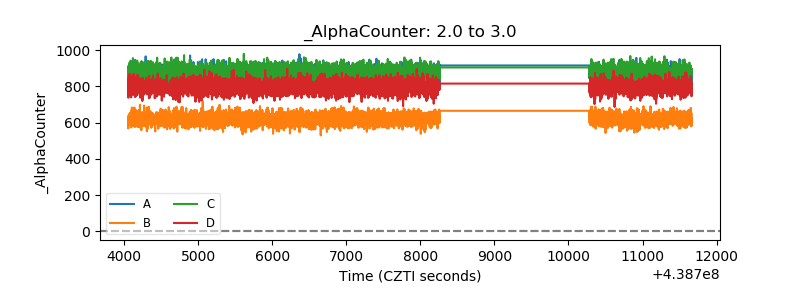 |
| _CPM_Rate | 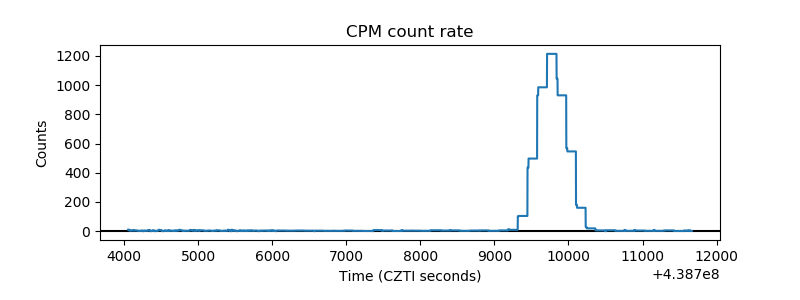 |
| CZT Counter | 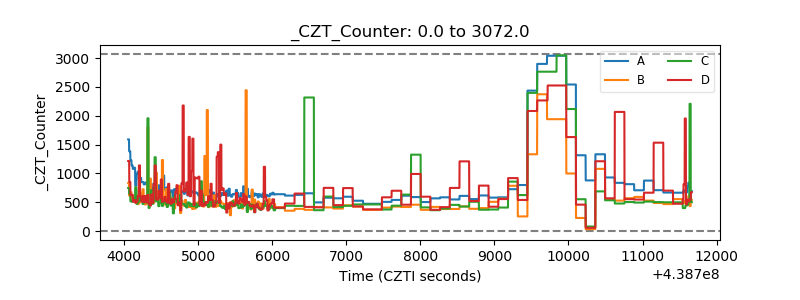 |
| +2.5 Volts monitor | 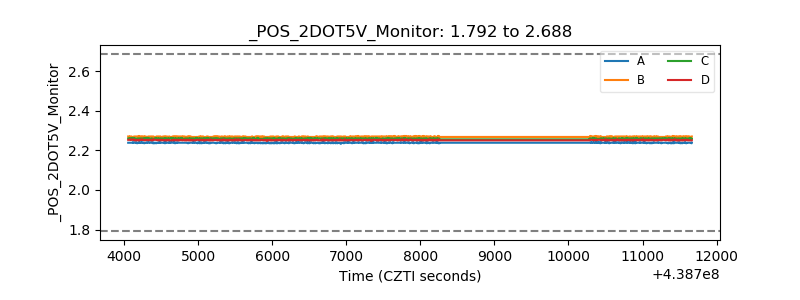 |
| +5 Volts monitor |  |
| _ROLL_ROT | 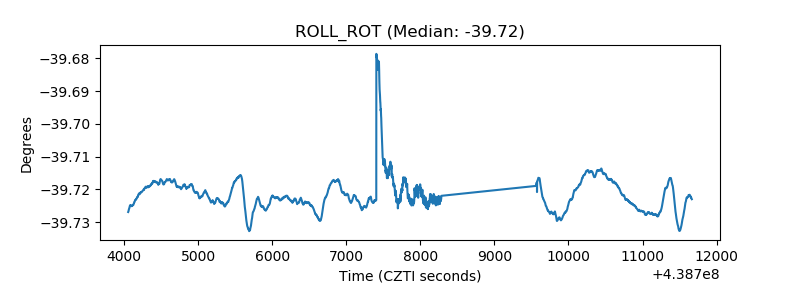 |
| _Roll_DEC | 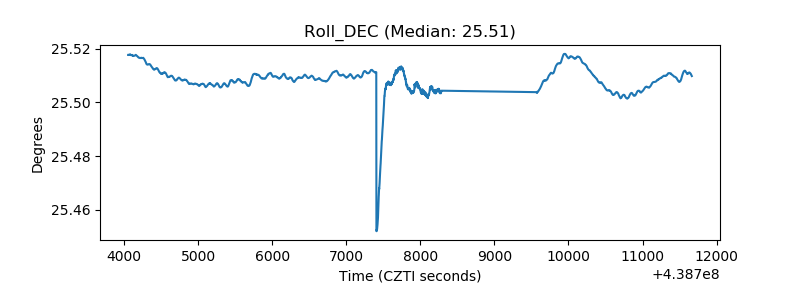 |
| _Roll_RA | 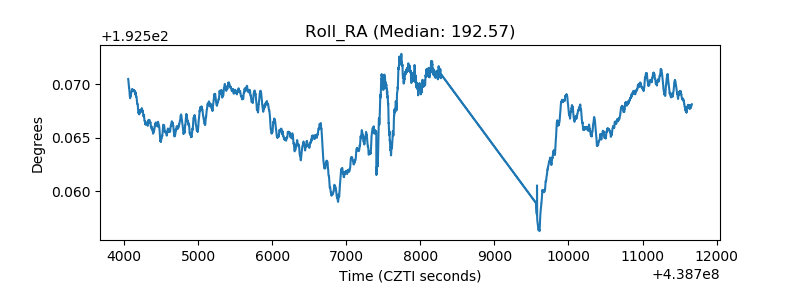 |
| Veto Counter | 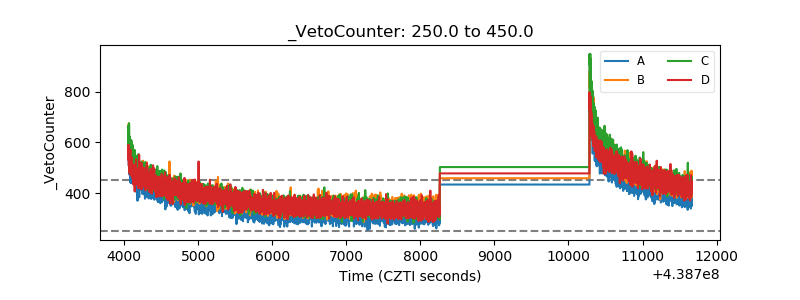 |