| Param | Original file | Final file |
|---|---|---|
| Filename | modeM0/AS1A13_012T02_9000005950_44139cztM0_level2.fits | modeM0/AS1A13_012T02_9000005950_44139cztM0_level2_quad_clean.evt |
| Size (bytes) | 462,634,560 | 113,512,320 |
| Size | 441.2 MB | 108.3 MB |
| Events in quadrant A | 4,689,333 | 760,234 |
| Events in quadrant B | 3,359,695 | 797,711 |
| Events in quadrant C | 3,240,951 | 763,226 |
| Events in quadrant D | 5,334,431 | 665,774 |
| Mode M9 | |||
|---|---|---|---|
| Quadrant | BADHDUFLAG | Total packets | Discarded packets |
| A | 0 | 11 | 0 |
| B | 0 | 11 | 0 |
| C | 0 | 11 | 0 |
| D | 0 | 11 | 0 |
| Mode SS | |||
|---|---|---|---|
| Quadrant | BADHDUFLAG | Total packets | Discarded packets |
| A | 0 | 130 | 0 |
| B | 0 | 130 | 0 |
| C | 0 | 130 | 0 |
| D | 0 | 130 | 0 |
| Mode M0 | |||
|---|---|---|---|
| Quadrant | BADHDUFLAG | Total packets | Discarded packets |
| A | 0 | 18588 | 1 |
| B | 0 | 14172 | 1 |
| C | 0 | 13930 | 1 |
| D | 0 | 20330 | 1 |
| Quadrant | Total seconds | Saturated seconds | Saturation percentage |
|---|---|---|---|
| A | 6448 | 228 | 3.535980% |
| B | 6449 | 107 | 1.659172% |
| C | 6449 | 79 | 1.224996% |
| D | 6449 | 469 | 7.272445% |
Noise dominated data is calculated using 1-second bins in cleaned event files. If a bin has >2000 counts, and if more than 50% of those come from <1% of pixels, then it is considered to be noise-dominated and hence unusable.
| Quadrant | # 1 sec bins | Bins with >0 counts | Bins with >2000 counts | High rate bins dominated by noise | Noise dominated (total time) | Noise dominated (detector-on time) | Marked lightcurve |
|---|---|---|---|---|---|---|---|
| A | 7628 | 6449 | 66 | 66 | 0.87% | 1.02% | 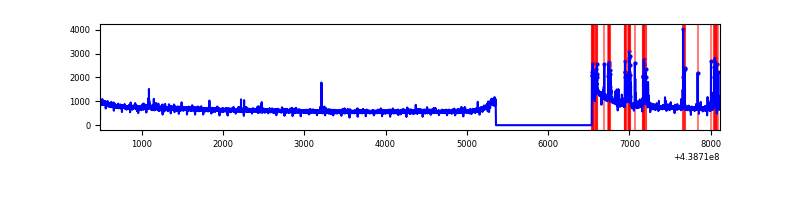 |
| B | 7629 | 6450 | 15 | 15 | 0.20% | 0.23% |  |
| C | 7629 | 6450 | 21 | 21 | 0.28% | 0.33% | 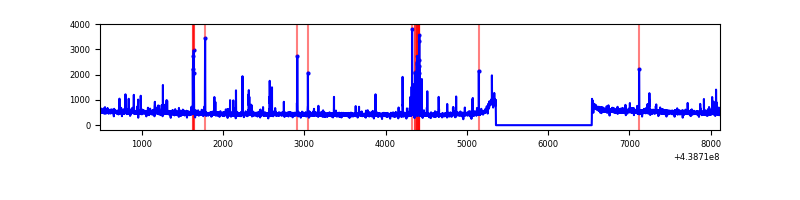 |
| D | 7629 | 6450 | 339 | 339 | 4.44% | 5.26% | 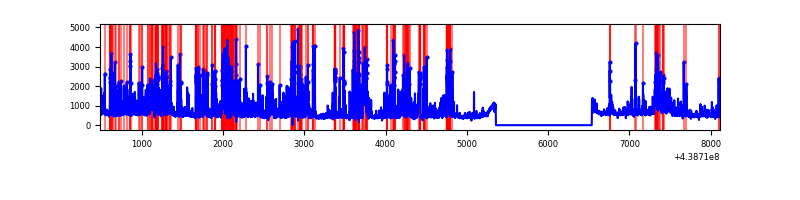 |
Top three noisy pixels from each quadrant. If the there are fewer than three noisy pixels in the level2.evt file, extra rows are filled as -1
| Pixel properties | Quadrant properties | ||||||
|---|---|---|---|---|---|---|---|
| Quadrant | DetID | PixID | Counts | Sigma | Mean | Median | Sigma |
| A | 10 | 83 | 1370169 | 8543.25 | 776 | 759 | 160.3 |
| A | 14 | 238 | 273643 | 1702.42 | 776 | 759 | 160.3 |
| A | 7 | 3 | 15821 | 93.97 | 776 | 759 | 160.3 |
| B | 5 | 172 | 107267 | 703.86 | 778 | 755 | 151.3 |
| B | 0 | 189 | 85729 | 561.53 | 778 | 755 | 151.3 |
| B | 5 | 235 | 21295 | 135.73 | 778 | 755 | 151.3 |
| C | 14 | 254 | 106281 | 583.94 | 774 | 780 | 180.7 |
| C | 14 | 96 | 85111 | 466.77 | 774 | 780 | 180.7 |
| C | 1 | 241 | 20224 | 107.62 | 774 | 780 | 180.7 |
| D | 1 | 47 | 1392757 | 7345.19 | 757 | 737 | 189.5 |
| D | 12 | 233 | 281282 | 1480.33 | 757 | 737 | 189.5 |
| D | 5 | 235 | 217200 | 1142.2 | 757 | 737 | 189.5 |
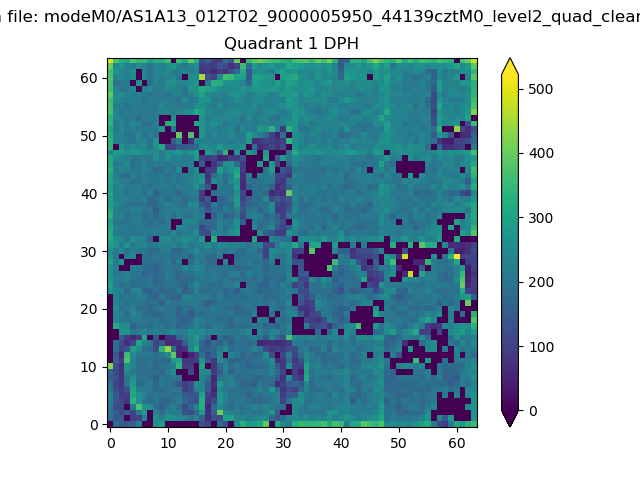
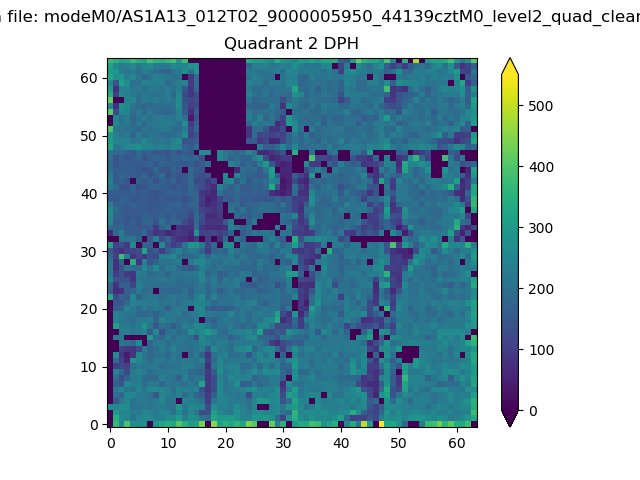
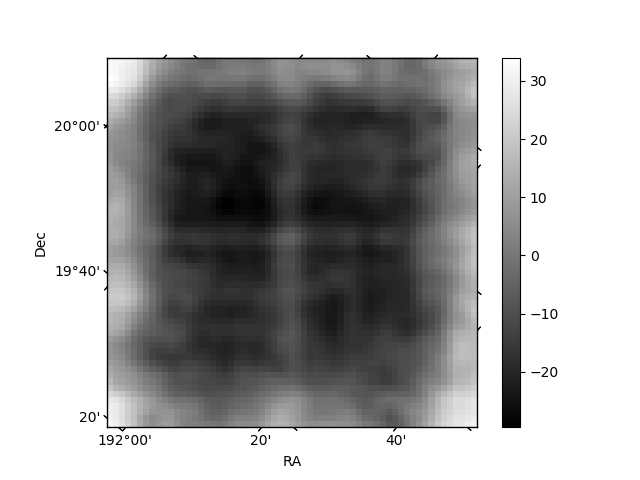
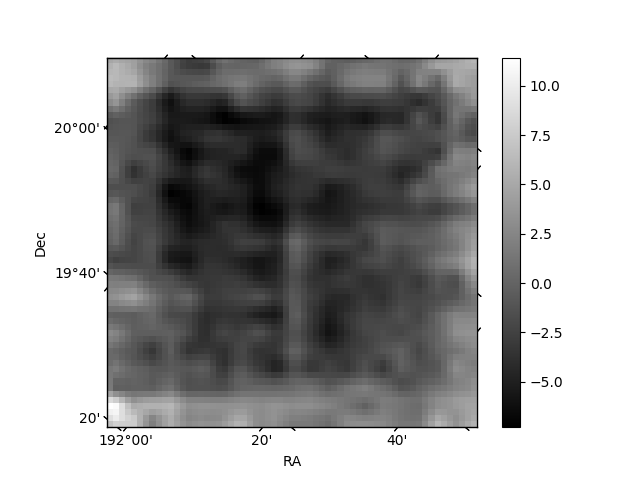
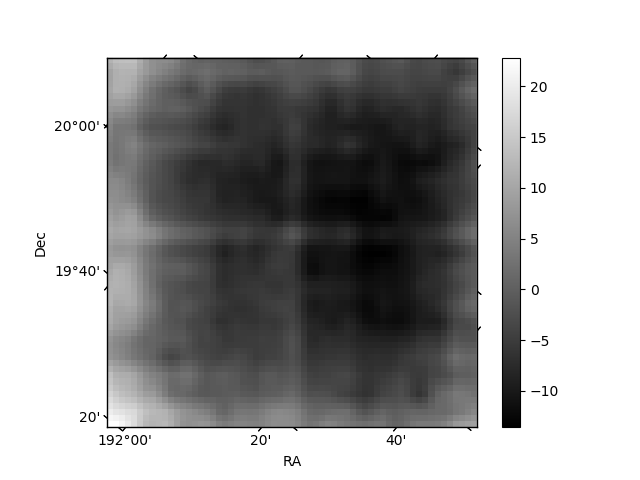
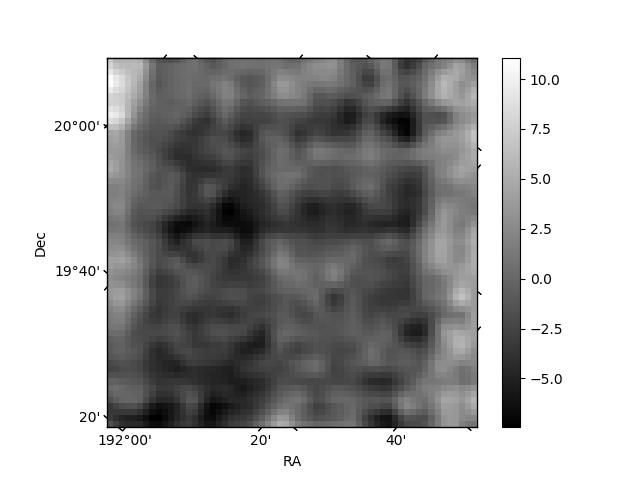
Histogram calculated using DETX and DETY for each event in the final _common_clean file
| Quadrant A | 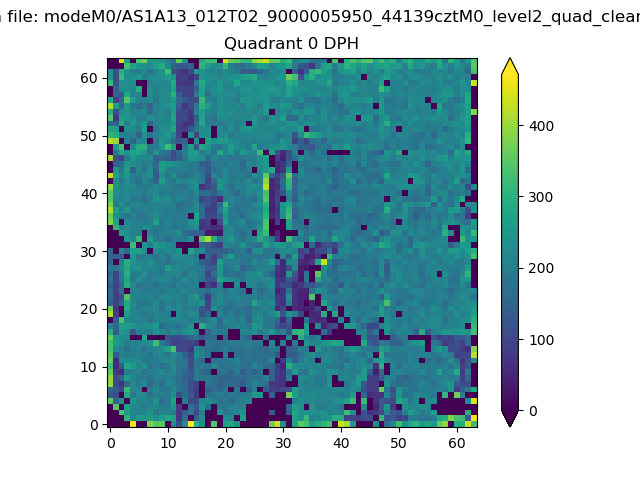 |
 |
Quadrant B |
|---|---|---|---|
| Quadrant D | 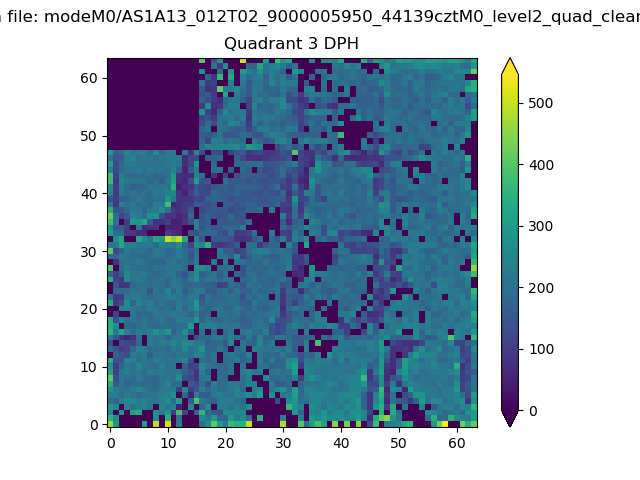 |
 |
Quadrant C |
| Plot type | Count rate plots | Images |
|---|---|---|
| Comparison with Poisson distribution Blue bars denote a histogram of data divided into 1 sec bins. Red curve is a Poisson curve with rate = median count rate of data. |
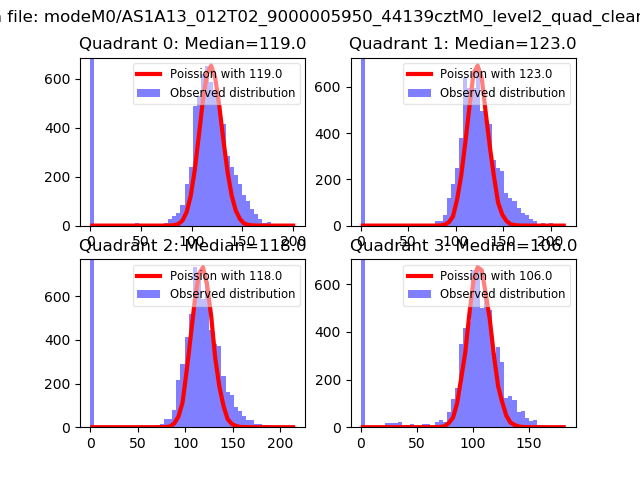 |
 |
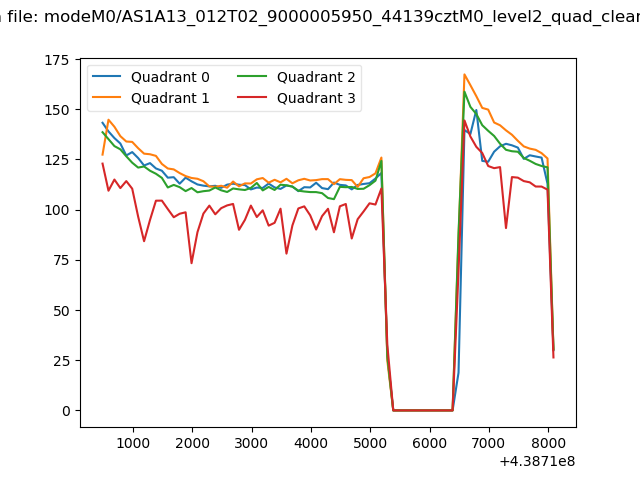
| Quadrant-wise count rates Data is divided into 100 sec bins |
 |
|
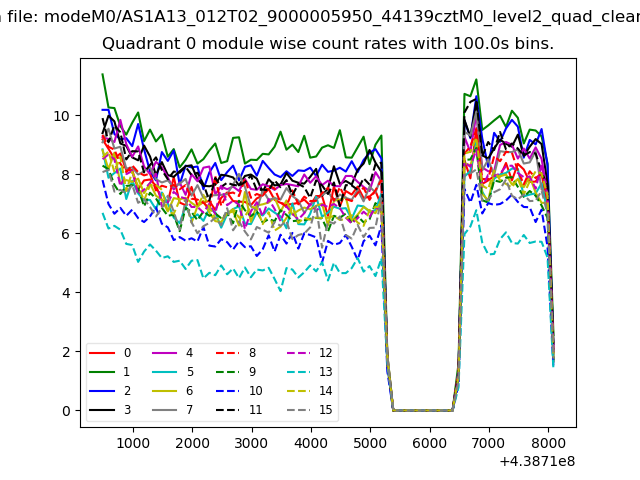
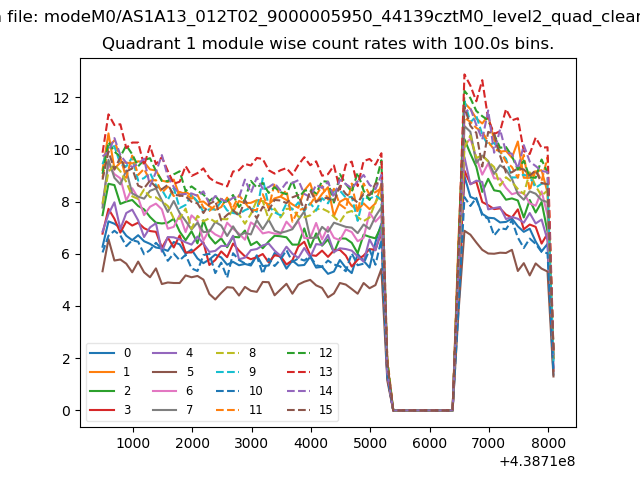
| Module-wise count rates for Quadrant A Data is divided into 100 sec bins |
 |
 |
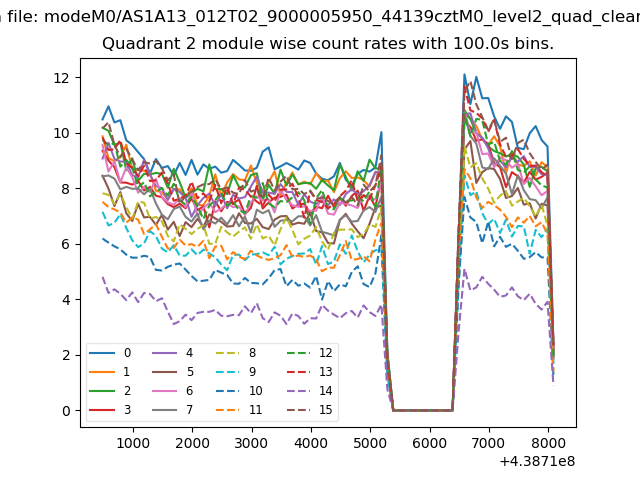
| Module-wise count rates for Quadrant B Data is divided into 100 sec bins |
 |
 |
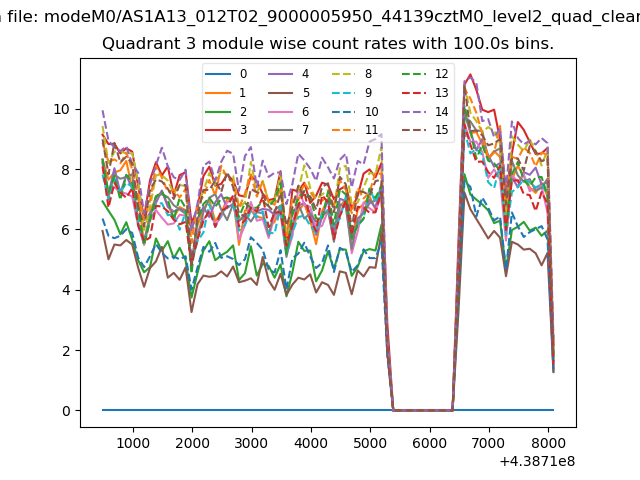
| Module-wise count rates for Quadrant C Data is divided into 100 sec bins |
 |
 |
| Module-wise count rates for Quadrant D Data is divided into 100 sec bins |
 |
 |
| Parameter | Plot |
|---|---|
| CZT HV Monitor | 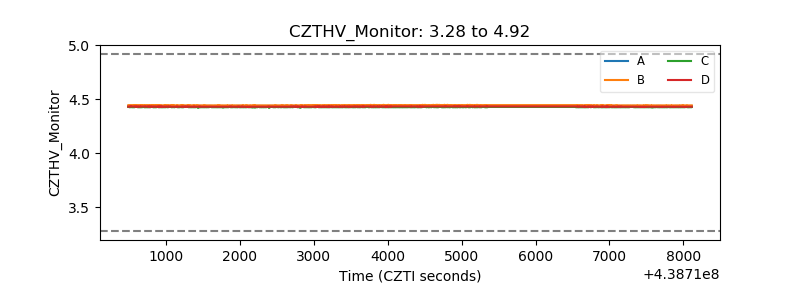 |
| D_VDD | 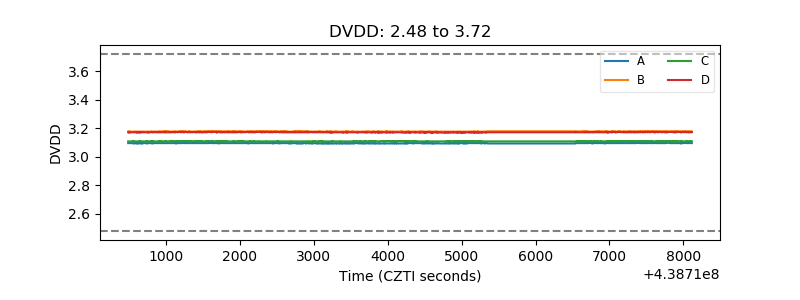 |
| Temperature 1 | 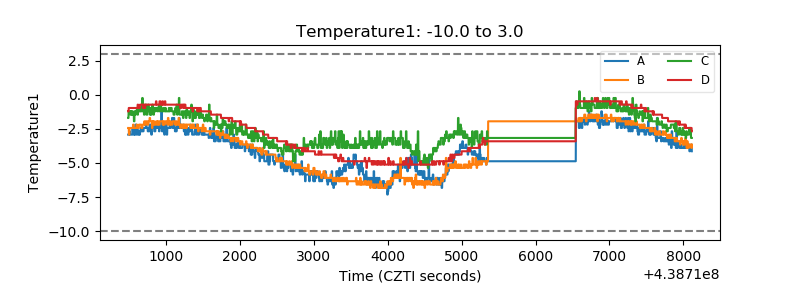 |
| Veto HV Monitor | 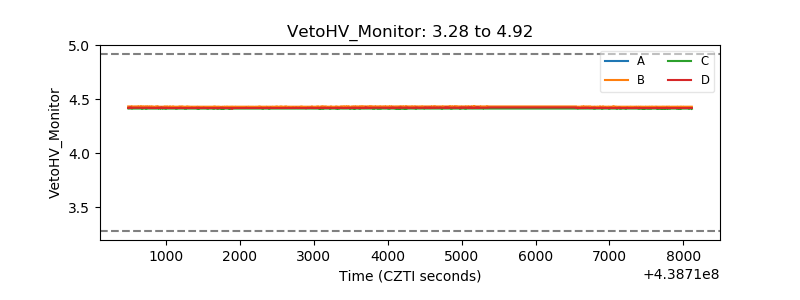 |
| Veto LLD | 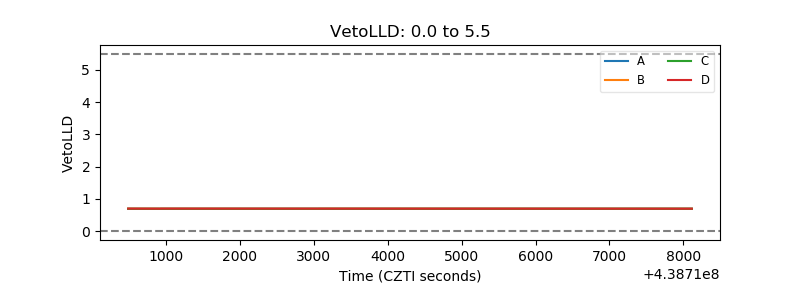 |
| Alpha Counter | 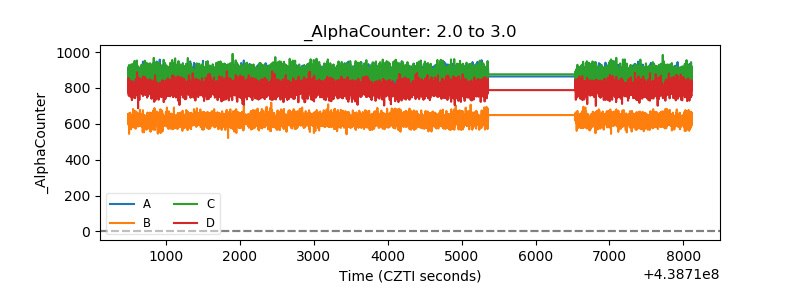 |
| _CPM_Rate | 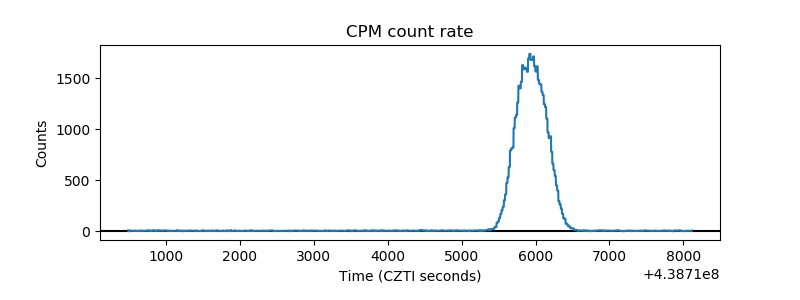 |
| CZT Counter | 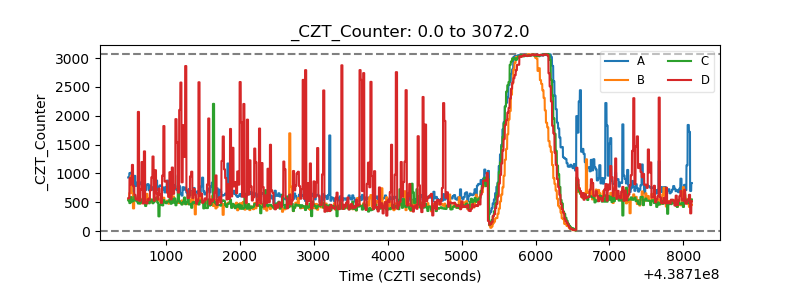 |
| +2.5 Volts monitor | 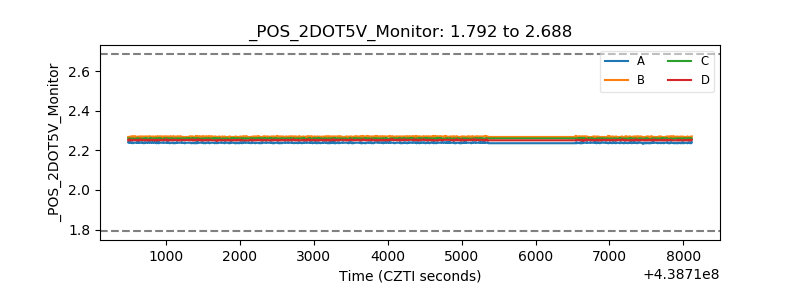 |
| +5 Volts monitor |  |
| _ROLL_ROT | 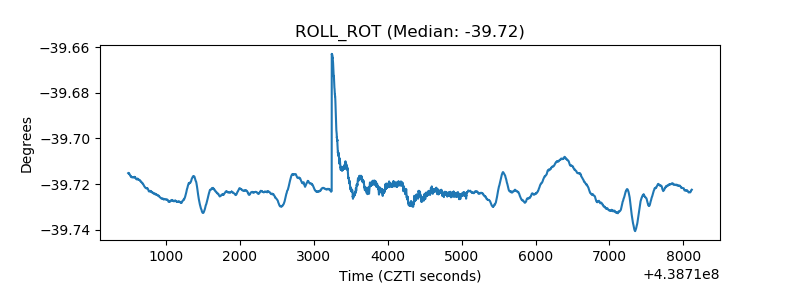 |
| _Roll_DEC | 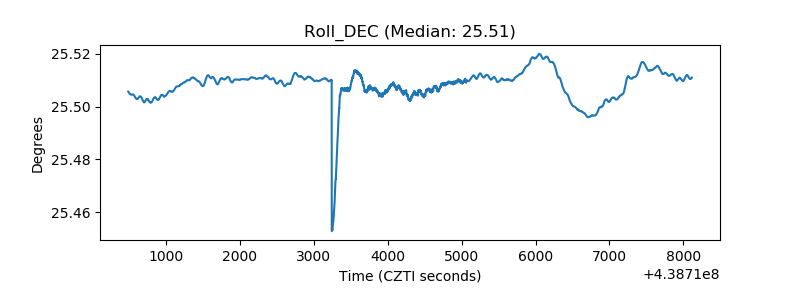 |
| _Roll_RA | 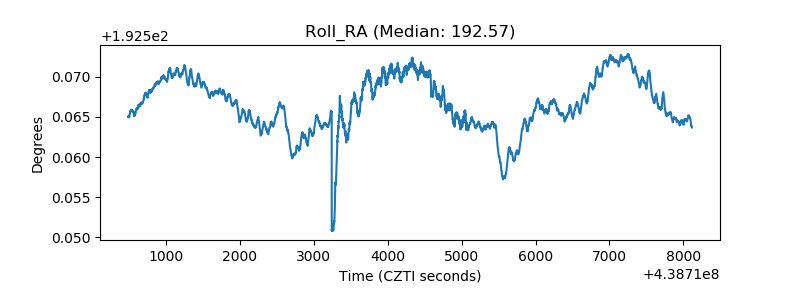 |
| Veto Counter | 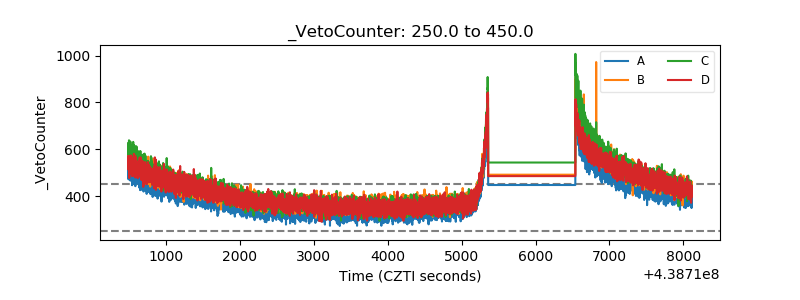 |