| Param | Original file | Final file |
|---|---|---|
| Filename | modeM0/AS1A13_012T02_9000005950_44140cztM0_level2.fits | modeM0/AS1A13_012T02_9000005950_44140cztM0_level2_quad_clean.evt |
| Size (bytes) | 433,808,640 | 105,981,120 |
| Size | 413.7 MB | 101.1 MB |
| Events in quadrant A | 4,993,406 | 702,058 |
| Events in quadrant B | 3,306,324 | 740,218 |
| Events in quadrant C | 2,992,480 | 714,197 |
| Events in quadrant D | 4,306,436 | 640,008 |
| Mode M9 | |||
|---|---|---|---|
| Quadrant | BADHDUFLAG | Total packets | Discarded packets |
| A | 0 | 13 | 0 |
| B | 0 | 13 | 0 |
| C | 0 | 13 | 0 |
| D | 0 | 13 | 0 |
| Mode SS | |||
|---|---|---|---|
| Quadrant | BADHDUFLAG | Total packets | Discarded packets |
| A | 0 | 118 | 0 |
| B | 0 | 118 | 0 |
| C | 0 | 118 | 0 |
| D | 0 | 118 | 0 |
| Mode M0 | |||
|---|---|---|---|
| Quadrant | BADHDUFLAG | Total packets | Discarded packets |
| A | 0 | 19207 | 1 |
| B | 0 | 13549 | 1 |
| C | 0 | 12780 | 1 |
| D | 0 | 16797 | 1 |
| Quadrant | Total seconds | Saturated seconds | Saturation percentage |
|---|---|---|---|
| A | 5916 | 344 | 5.814740% |
| B | 5917 | 150 | 2.535068% |
| C | 5917 | 101 | 1.706946% |
| D | 5916 | 235 | 3.972279% |
Noise dominated data is calculated using 1-second bins in cleaned event files. If a bin has >2000 counts, and if more than 50% of those come from <1% of pixels, then it is considered to be noise-dominated and hence unusable.
| Quadrant | # 1 sec bins | Bins with >0 counts | Bins with >2000 counts | High rate bins dominated by noise | Noise dominated (total time) | Noise dominated (detector-on time) | Marked lightcurve |
|---|---|---|---|---|---|---|---|
| A | 7146 | 5917 | 170 | 170 | 2.38% | 2.87% | 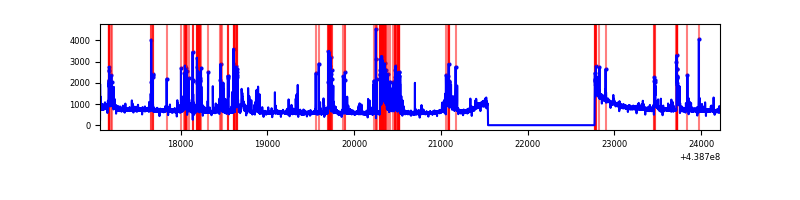 |
| B | 7147 | 5918 | 36 | 36 | 0.50% | 0.61% | 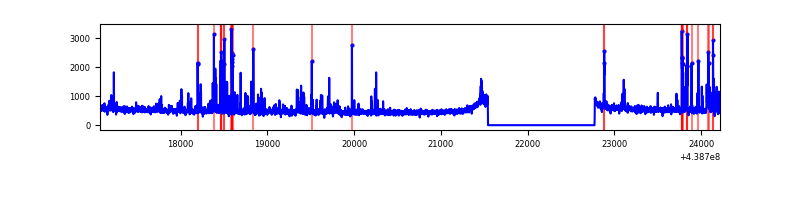 |
| C | 7147 | 5918 | 15 | 15 | 0.21% | 0.25% | 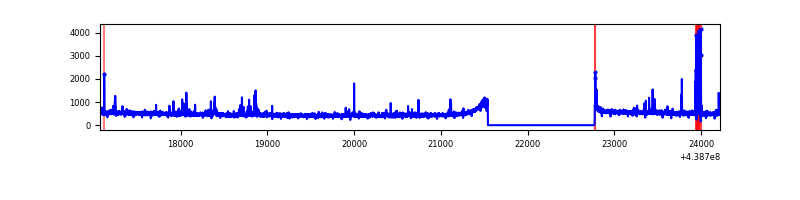 |
| D | 7146 | 5917 | 137 | 137 | 1.92% | 2.32% | 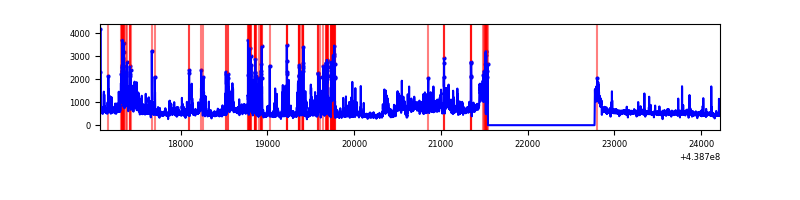 |
Top three noisy pixels from each quadrant. If the there are fewer than three noisy pixels in the level2.evt file, extra rows are filled as -1
| Pixel properties | Quadrant properties | ||||||
|---|---|---|---|---|---|---|---|
| Quadrant | DetID | PixID | Counts | Sigma | Mean | Median | Sigma |
| A | 10 | 83 | 1230441 | 8431.51 | 715 | 703 | 145.9 |
| A | 14 | 238 | 935713 | 6410.75 | 715 | 703 | 145.9 |
| A | 7 | 3 | 22897 | 152.17 | 715 | 703 | 145.9 |
| B | 5 | 235 | 253274 | 1789.09 | 722 | 701 | 141.2 |
| B | 0 | 189 | 101058 | 710.87 | 722 | 701 | 141.2 |
| B | 5 | 172 | 30610 | 211.86 | 722 | 701 | 141.2 |
| C | 14 | 254 | 105072 | 624.04 | 718 | 724 | 167.2 |
| C | 5 | 4 | 35051 | 205.28 | 718 | 724 | 167.2 |
| C | 14 | 96 | 31013 | 181.14 | 718 | 724 | 167.2 |
| D | 1 | 47 | 913928 | 5109.76 | 705 | 684 | 178.7 |
| D | 2 | 249 | 226522 | 1263.6 | 705 | 684 | 178.7 |
| D | 1 | 52 | 140818 | 784.08 | 705 | 684 | 178.7 |
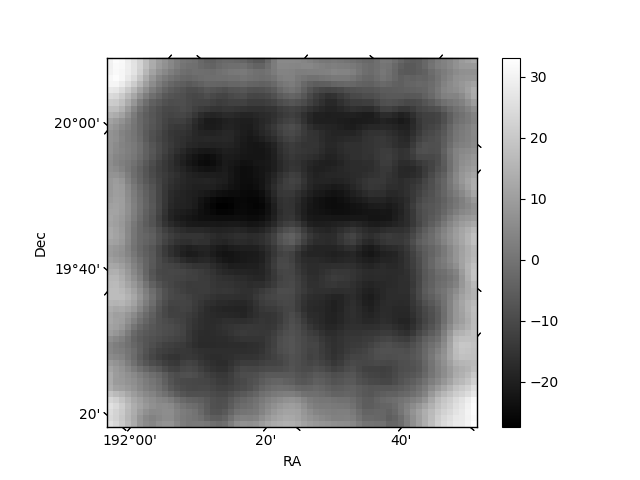
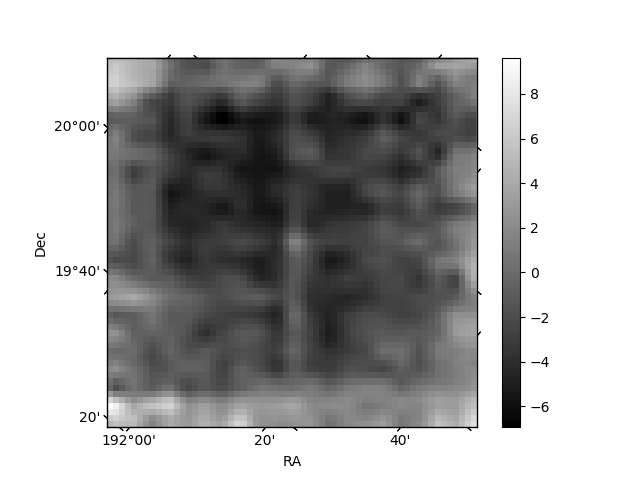
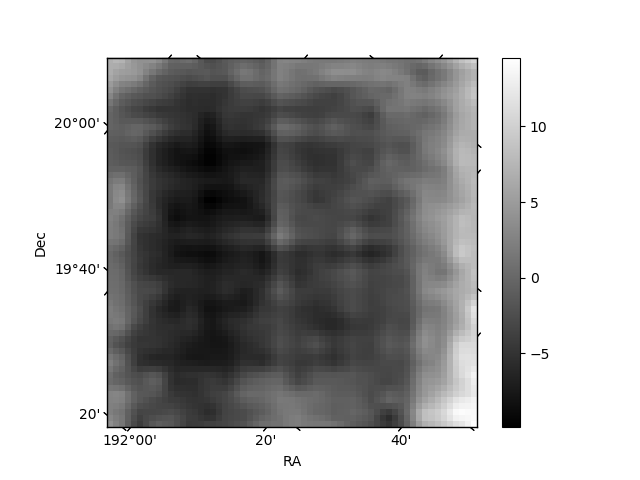
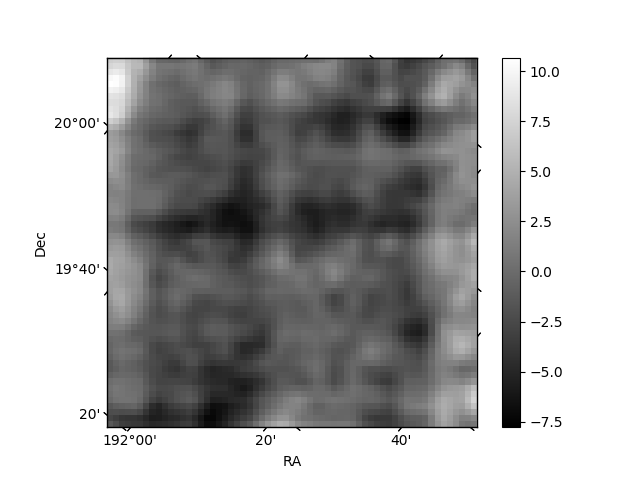
Histogram calculated using DETX and DETY for each event in the final _common_clean file
| Quadrant A | 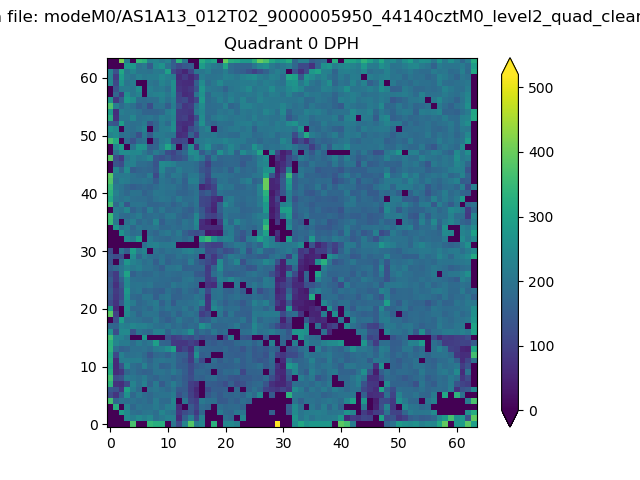 |
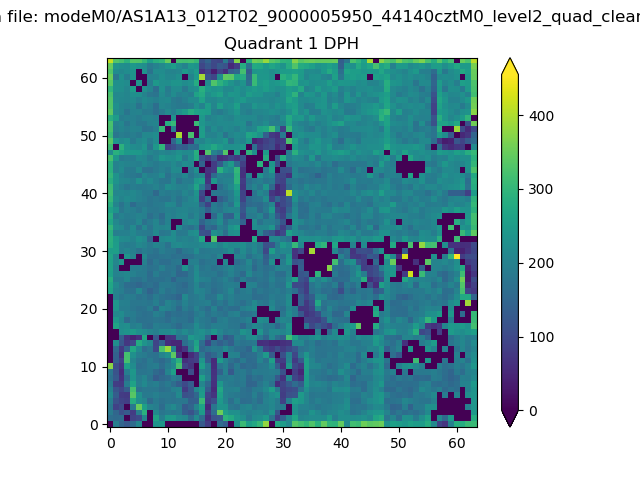 |
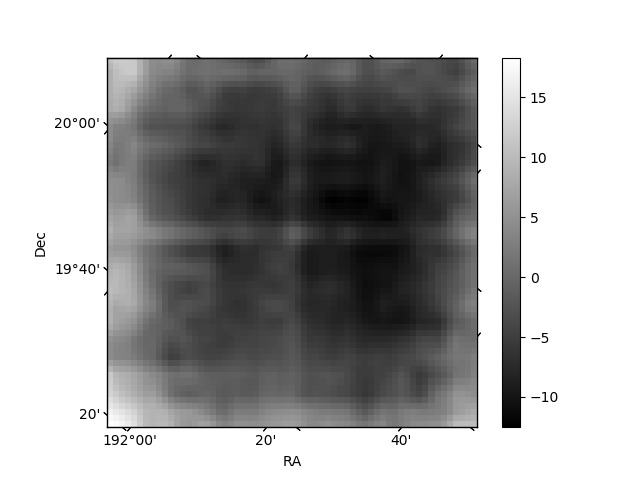
Quadrant B |
|---|---|---|---|
| Quadrant D | 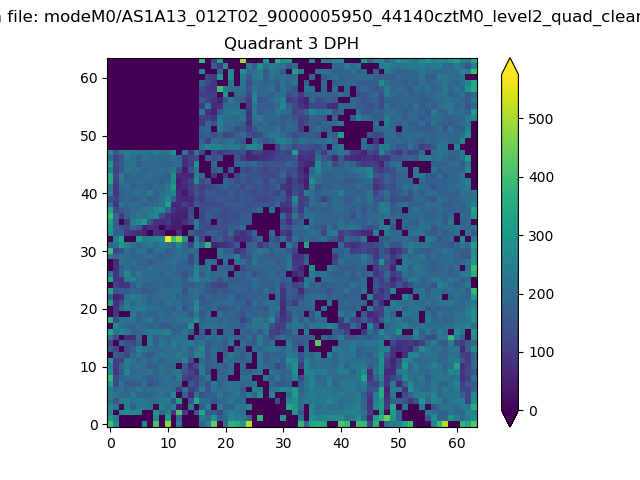 |
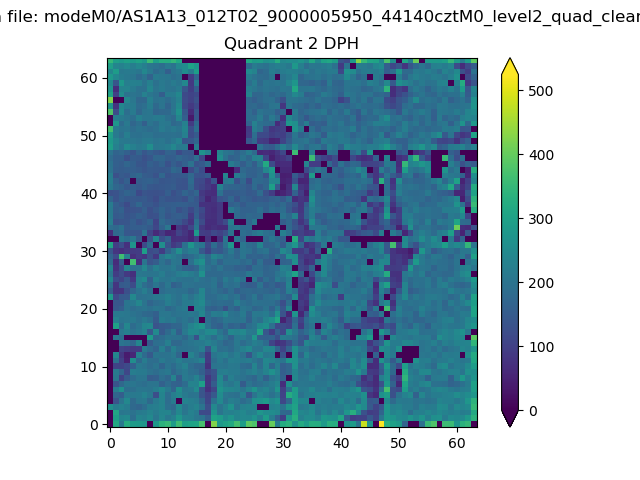 |
Quadrant C |
| Plot type | Count rate plots | Images |
|---|---|---|
| Comparison with Poisson distribution Blue bars denote a histogram of data divided into 1 sec bins. Red curve is a Poisson curve with rate = median count rate of data. |
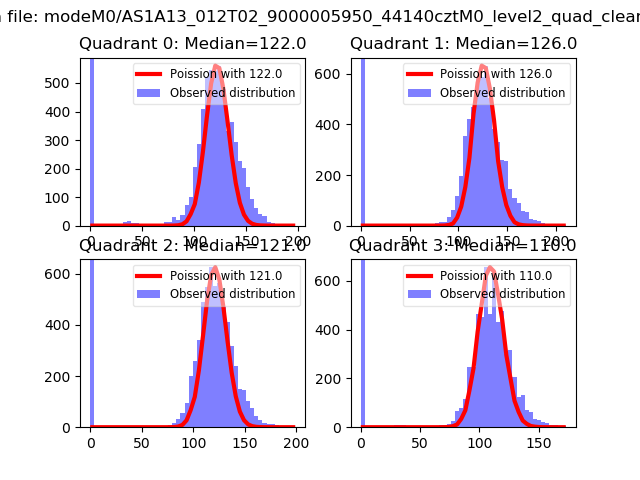 |
 |
| Quadrant-wise count rates Data is divided into 100 sec bins |
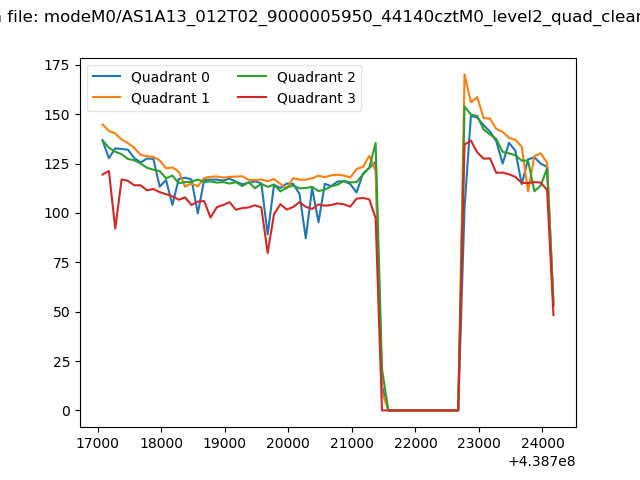 |
|
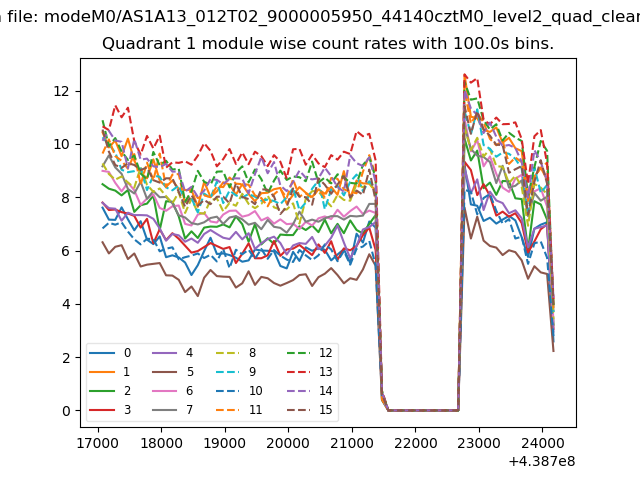
| Module-wise count rates for Quadrant A Data is divided into 100 sec bins |
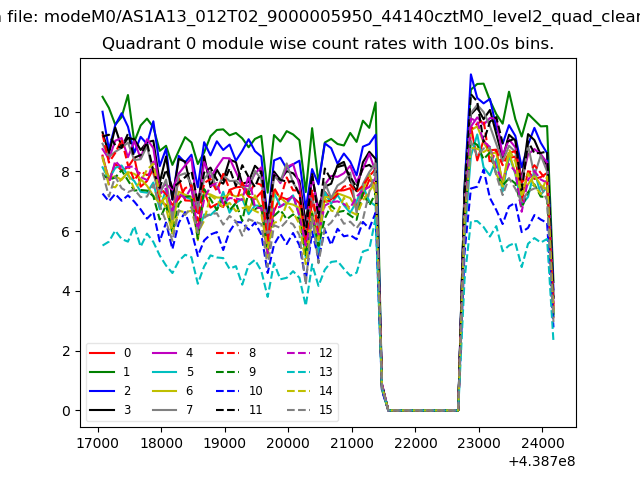 |
 |
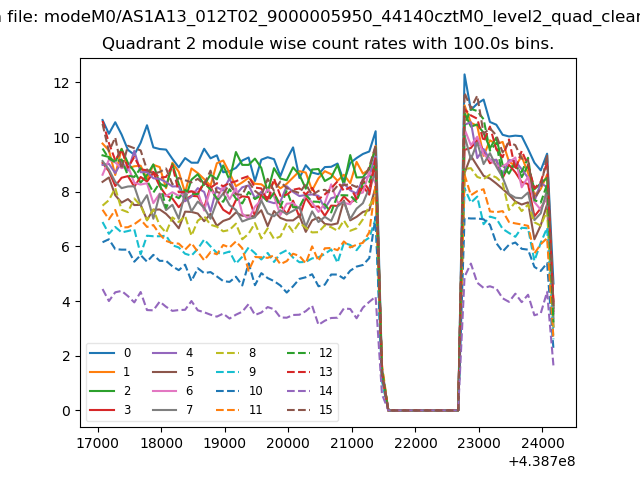
| Module-wise count rates for Quadrant B Data is divided into 100 sec bins |
 |
 |
| Module-wise count rates for Quadrant C Data is divided into 100 sec bins |
 |
 |
| Module-wise count rates for Quadrant D Data is divided into 100 sec bins |
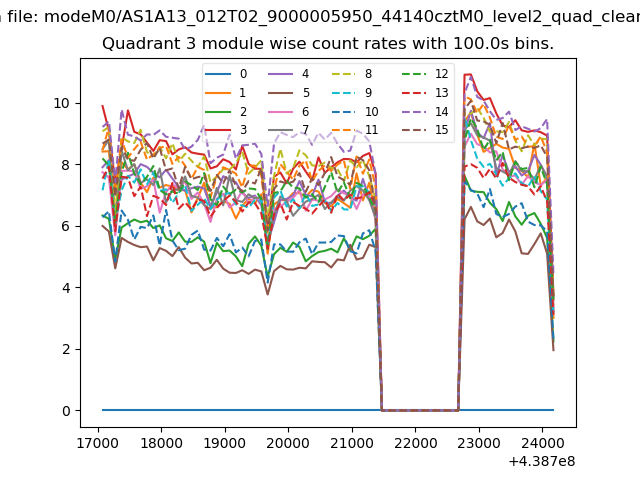 |
 |
| Parameter | Plot |
|---|---|
| CZT HV Monitor | 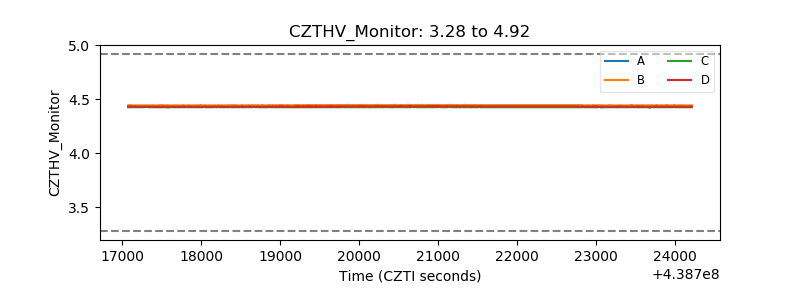 |
| D_VDD | 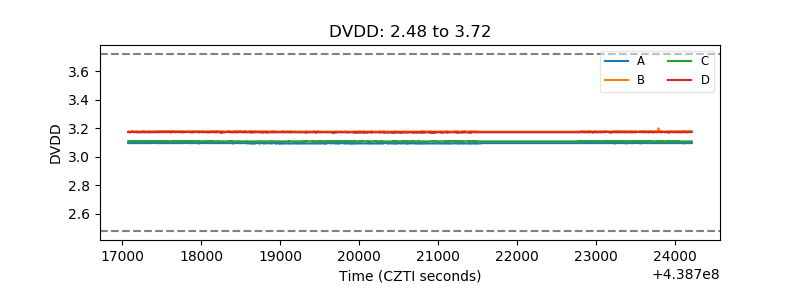 |
| Temperature 1 | 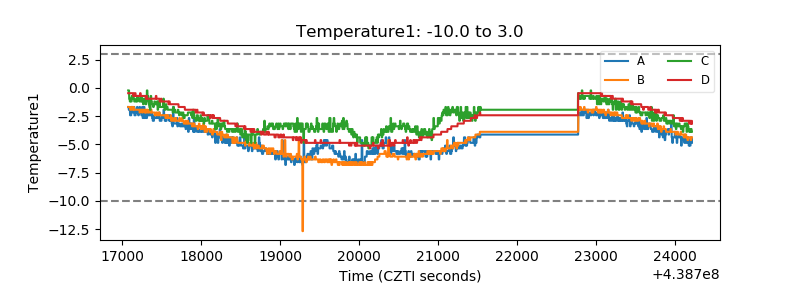 |
| Veto HV Monitor | 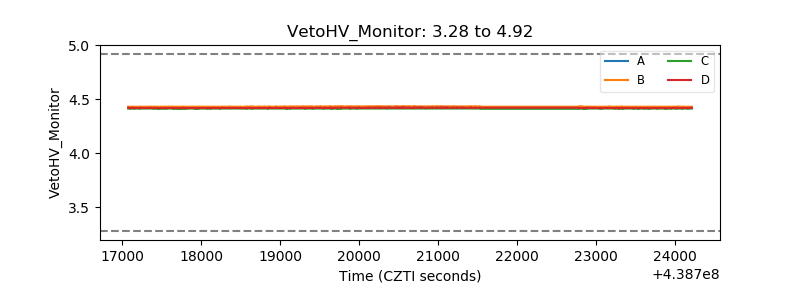 |
| Veto LLD | 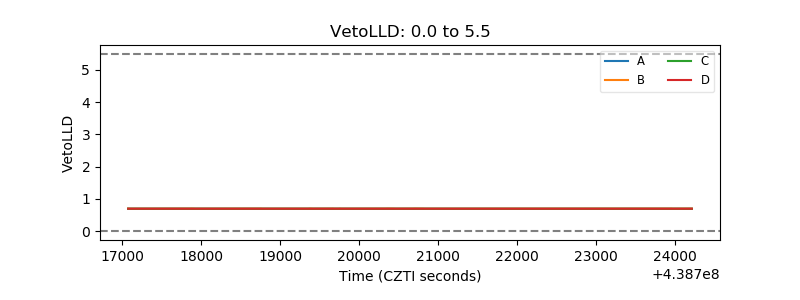 |
| Alpha Counter | 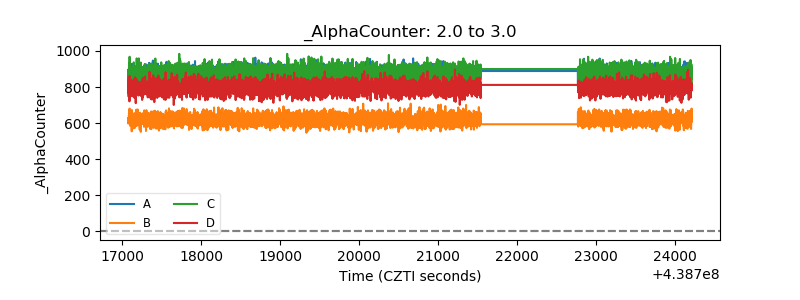 |
| _CPM_Rate | 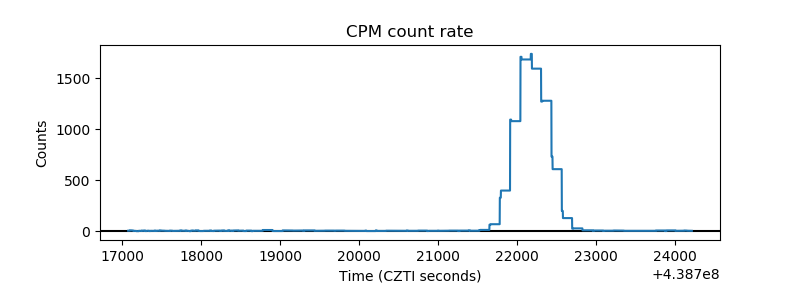 |
| CZT Counter | 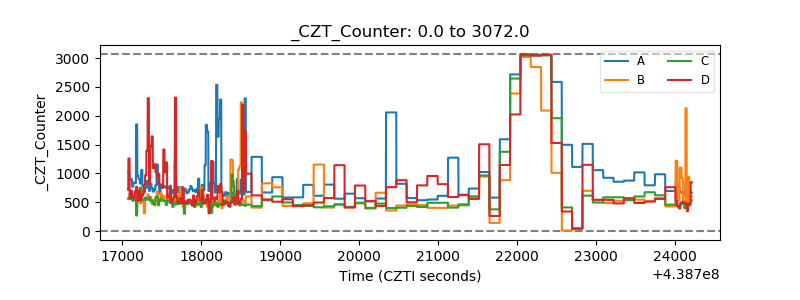 |
| +2.5 Volts monitor | 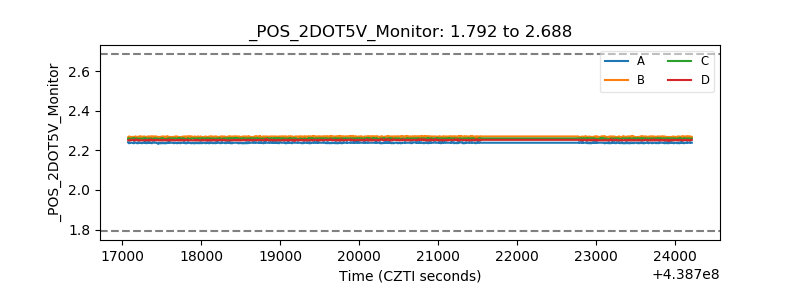 |
| +5 Volts monitor | 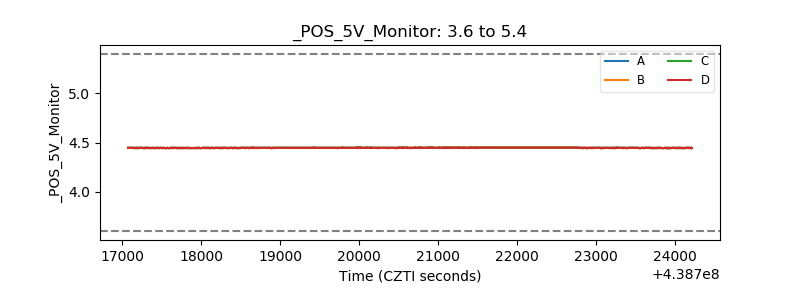 |
| _ROLL_ROT | 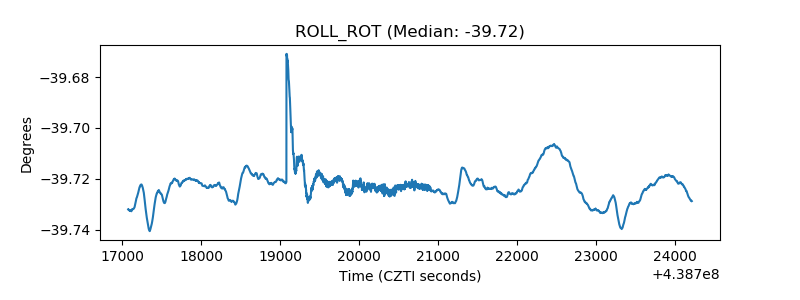 |
| _Roll_DEC | 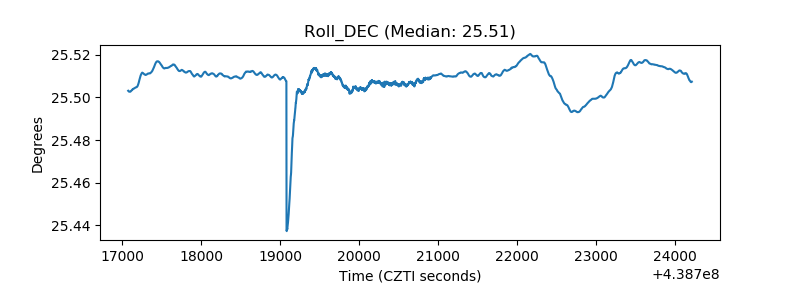 |
| _Roll_RA | 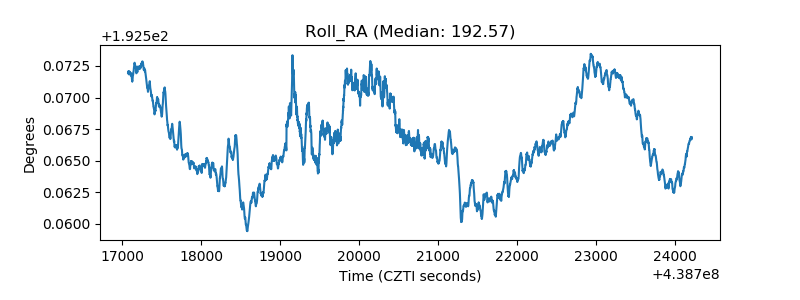 |
| Veto Counter | 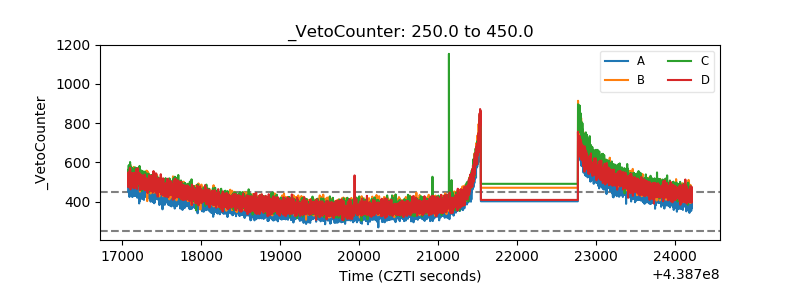 |