| Param | Original file | Final file |
|---|---|---|
| Filename | modeM0/AS1A13_012T02_9000005950_44141cztM0_level2.fits | modeM0/AS1A13_012T02_9000005950_44141cztM0_level2_quad_clean.evt |
| Size (bytes) | 396,702,720 | 100,054,080 |
| Size | 378.3 MB | 95.4 MB |
| Events in quadrant A | 4,393,622 | 666,383 |
| Events in quadrant B | 3,432,276 | 686,180 |
| Events in quadrant C | 2,921,799 | 674,760 |
| Events in quadrant D | 3,493,657 | 604,010 |
| Mode M9 | |||
|---|---|---|---|
| Quadrant | BADHDUFLAG | Total packets | Discarded packets |
| A | 0 | 12 | 0 |
| B | 0 | 12 | 0 |
| C | 0 | 12 | 0 |
| D | 0 | 12 | 0 |
| Mode SS | |||
|---|---|---|---|
| Quadrant | BADHDUFLAG | Total packets | Discarded packets |
| A | 0 | 116 | 0 |
| B | 0 | 116 | 0 |
| C | 0 | 116 | 0 |
| D | 0 | 116 | 0 |
| Mode M0 | |||
|---|---|---|---|
| Quadrant | BADHDUFLAG | Total packets | Discarded packets |
| A | 0 | 17174 | 2 |
| B | 0 | 13976 | 1 |
| C | 0 | 12468 | 1 |
| D | 0 | 14131 | 1 |
| Quadrant | Total seconds | Saturated seconds | Saturation percentage |
|---|---|---|---|
| A | 5697 | 269 | 4.721783% |
| B | 5698 | 285 | 5.001755% |
| C | 5698 | 124 | 2.176202% |
| D | 5698 | 244 | 4.282204% |
Noise dominated data is calculated using 1-second bins in cleaned event files. If a bin has >2000 counts, and if more than 50% of those come from <1% of pixels, then it is considered to be noise-dominated and hence unusable.
| Quadrant | # 1 sec bins | Bins with >0 counts | Bins with >2000 counts | High rate bins dominated by noise | Noise dominated (total time) | Noise dominated (detector-on time) | Marked lightcurve |
|---|---|---|---|---|---|---|---|
| A | 6902 | 5698 | 130 | 130 | 1.88% | 2.28% | 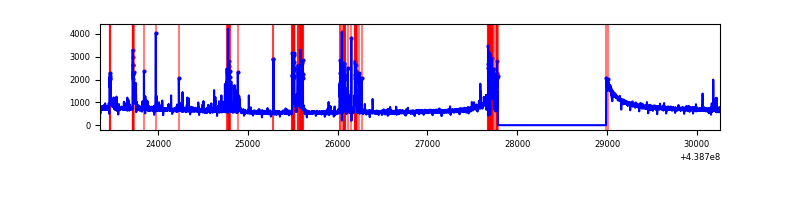 |
| B | 6903 | 5699 | 122 | 122 | 1.77% | 2.14% | 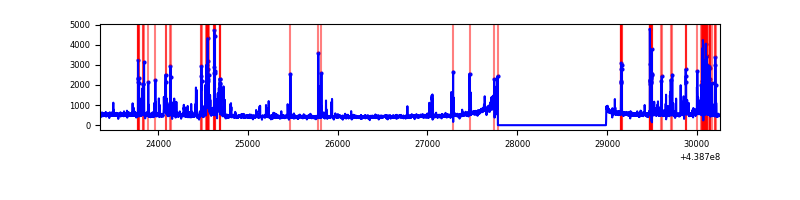 |
| C | 6903 | 5699 | 23 | 23 | 0.33% | 0.40% | 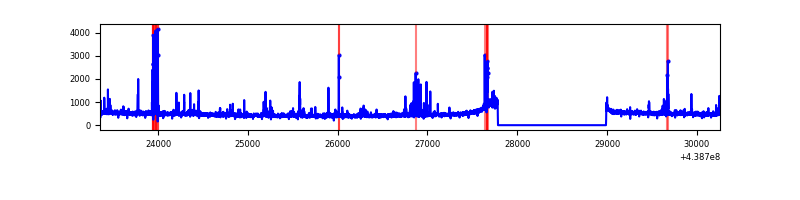 |
| D | 6903 | 5699 | 118 | 118 | 1.71% | 2.07% |  |
Top three noisy pixels from each quadrant. If the there are fewer than three noisy pixels in the level2.evt file, extra rows are filled as -1
| Pixel properties | Quadrant properties | ||||||
|---|---|---|---|---|---|---|---|
| Quadrant | DetID | PixID | Counts | Sigma | Mean | Median | Sigma |
| A | 10 | 83 | 1163777 | 8291.61 | 676 | 665 | 140.3 |
| A | 14 | 238 | 584335 | 4160.88 | 676 | 665 | 140.3 |
| A | 7 | 3 | 15063 | 102.64 | 676 | 665 | 140.3 |
| B | 5 | 235 | 352588 | 2654.37 | 678 | 659 | 132.6 |
| B | 5 | 172 | 314404 | 2366.37 | 678 | 659 | 132.6 |
| B | 0 | 189 | 39898 | 295.95 | 678 | 659 | 132.6 |
| C | 14 | 254 | 196427 | 1216.7 | 683 | 688 | 160.9 |
| C | 14 | 96 | 45193 | 276.64 | 683 | 688 | 160.9 |
| C | 3 | 233 | 5741 | 31.41 | 683 | 688 | 160.9 |
| D | 13 | 249 | 284361 | 1673.91 | 673 | 654 | 169.5 |
| D | 1 | 47 | 278461 | 1639.1 | 673 | 654 | 169.5 |
| D | 2 | 249 | 116138 | 681.37 | 673 | 654 | 169.5 |
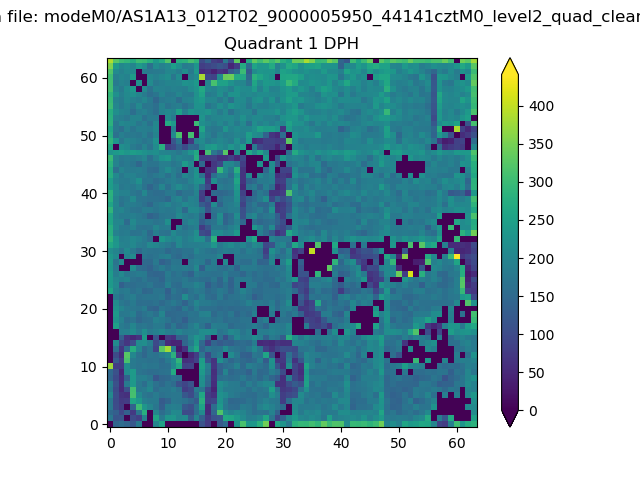
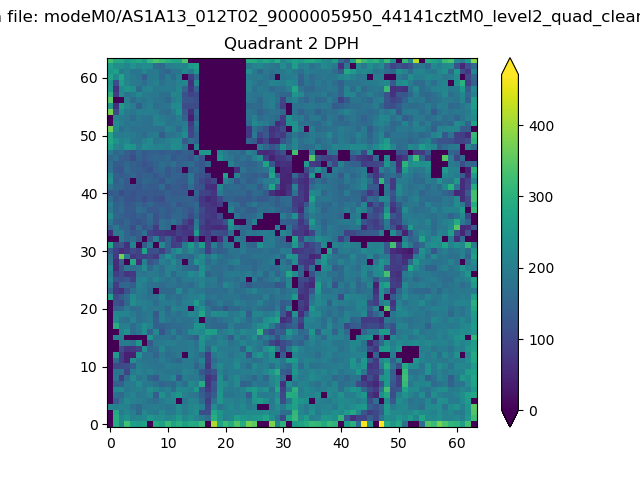
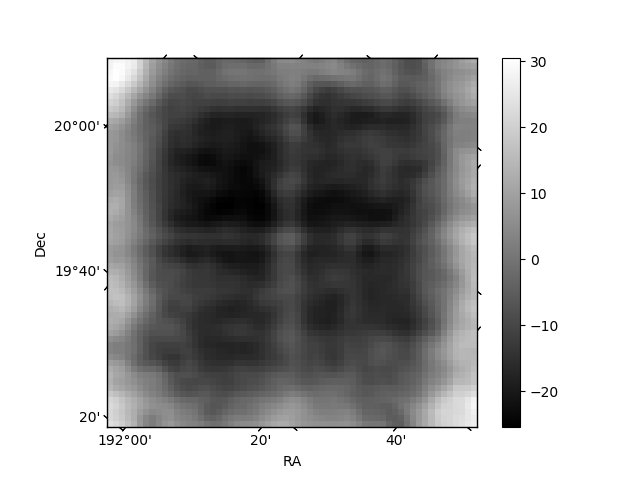
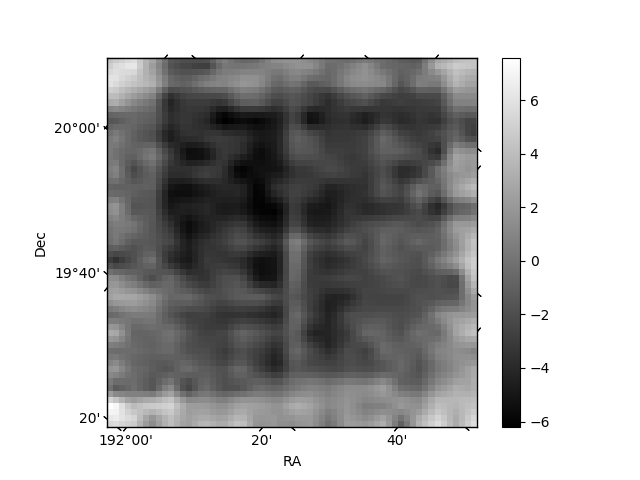
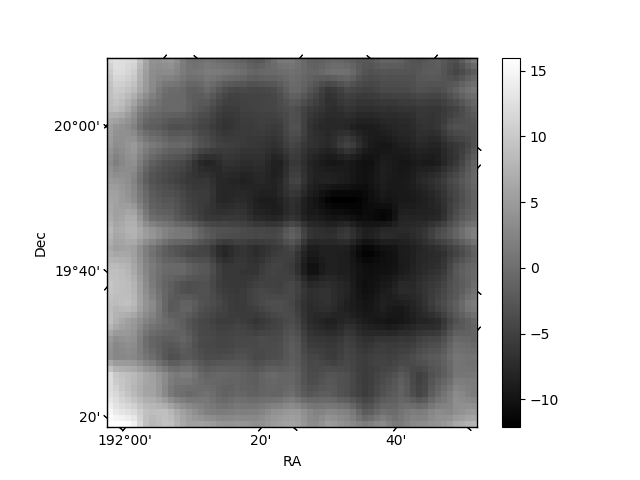
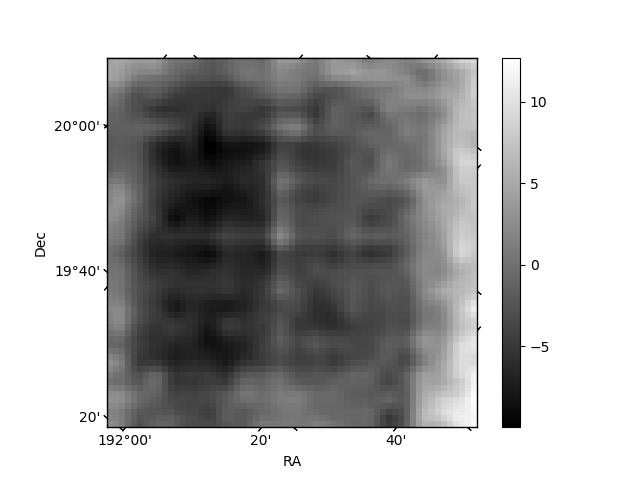
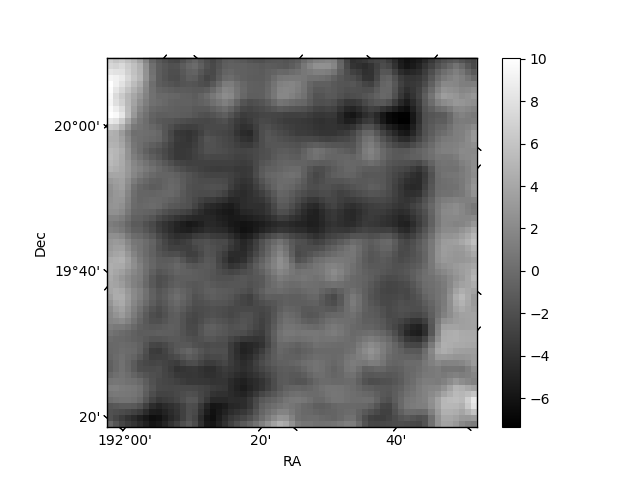
Histogram calculated using DETX and DETY for each event in the final _common_clean file
| Quadrant A | 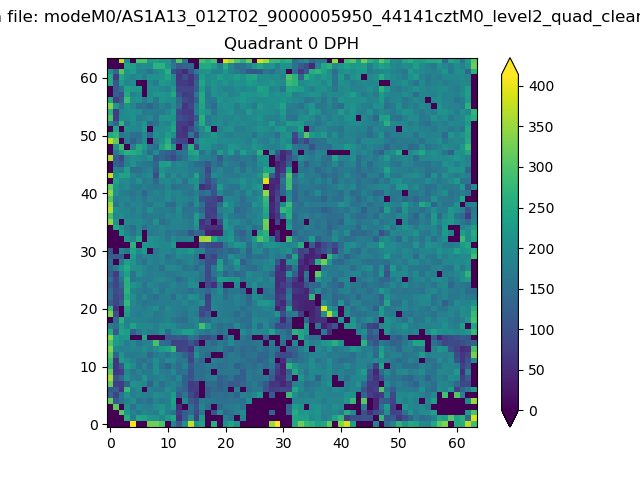 |
 |
Quadrant B |
|---|---|---|---|
| Quadrant D | 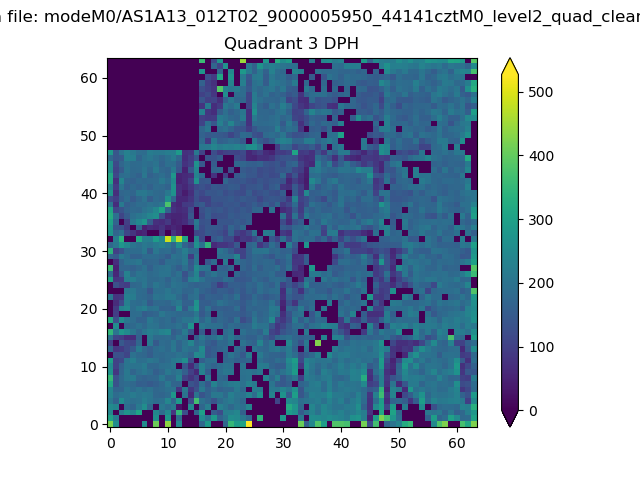 |
 |
Quadrant C |
| Plot type | Count rate plots | Images |
|---|---|---|
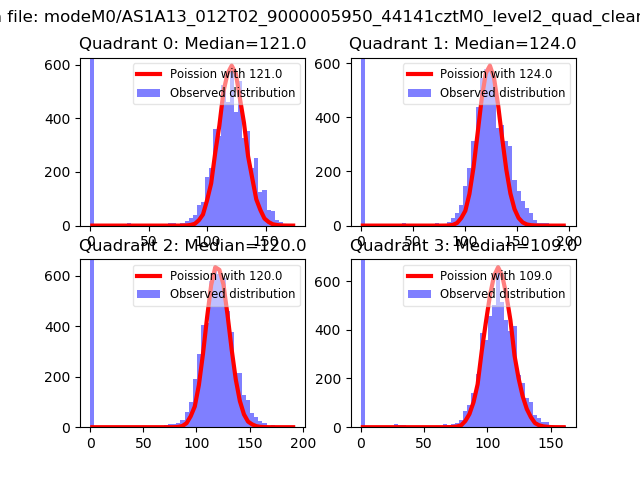
| Comparison with Poisson distribution Blue bars denote a histogram of data divided into 1 sec bins. Red curve is a Poisson curve with rate = median count rate of data. |
 |
 |
| Quadrant-wise count rates Data is divided into 100 sec bins |
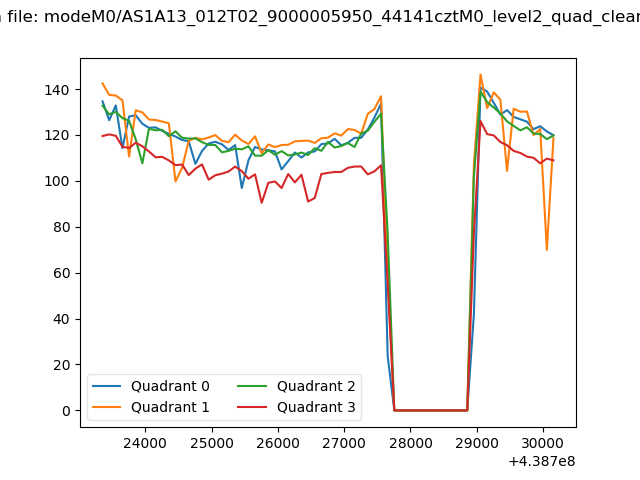 |
|
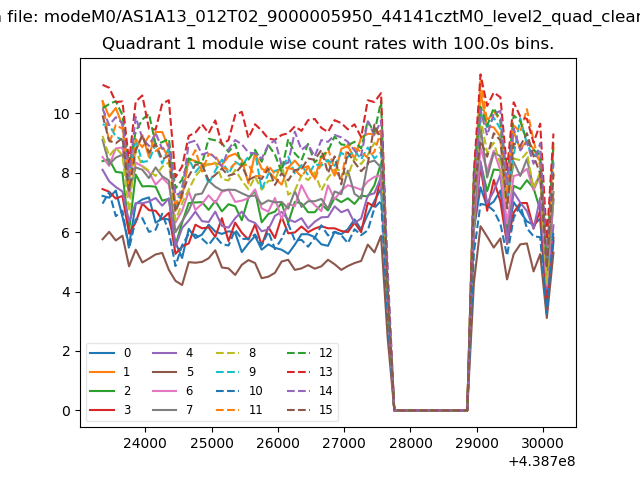
| Module-wise count rates for Quadrant A Data is divided into 100 sec bins |
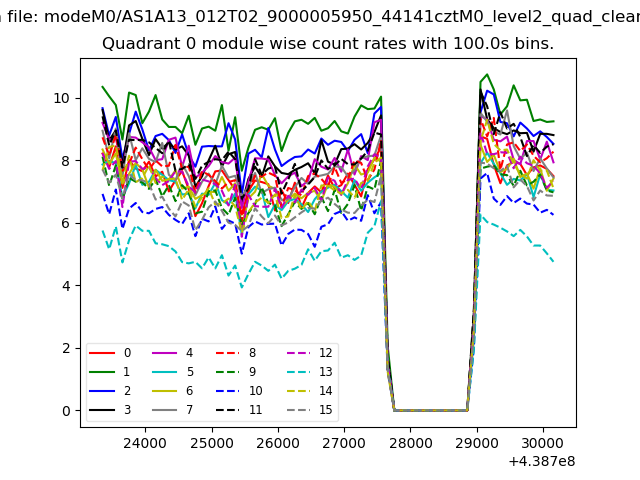 |
 |
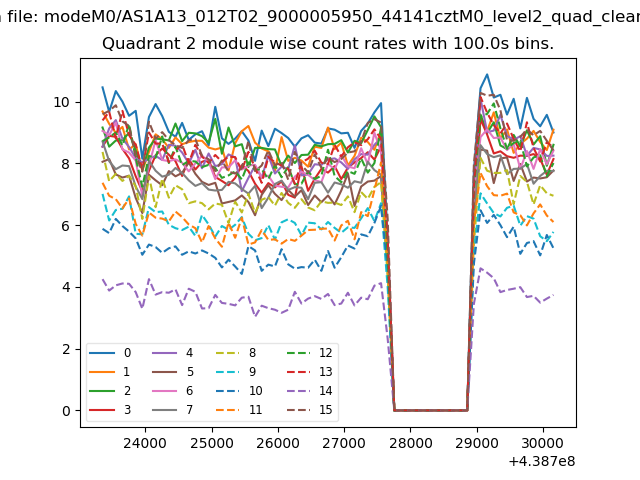
| Module-wise count rates for Quadrant B Data is divided into 100 sec bins |
 |
 |
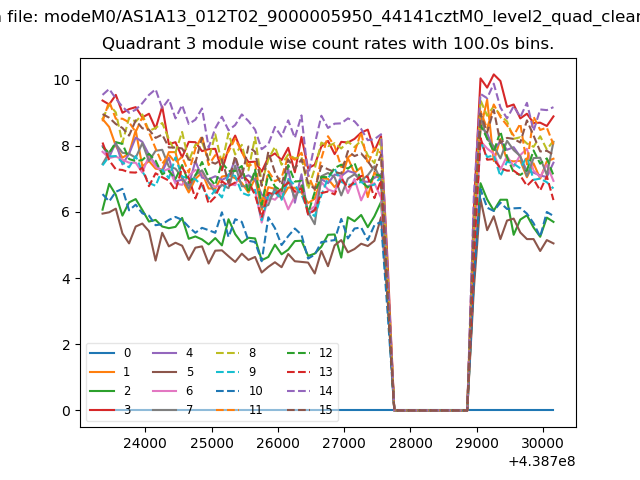
| Module-wise count rates for Quadrant C Data is divided into 100 sec bins |
 |
 |
| Module-wise count rates for Quadrant D Data is divided into 100 sec bins |
 |
 |
| Parameter | Plot |
|---|---|
| CZT HV Monitor | 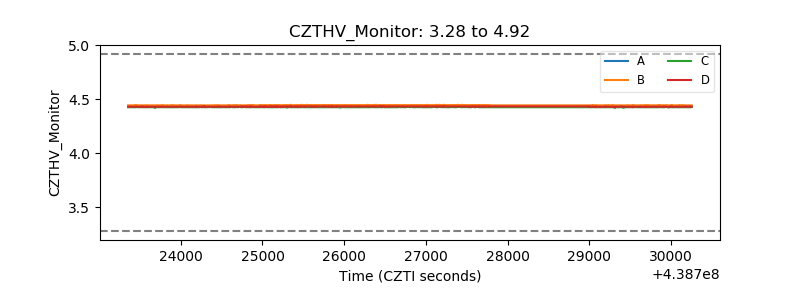 |
| D_VDD | 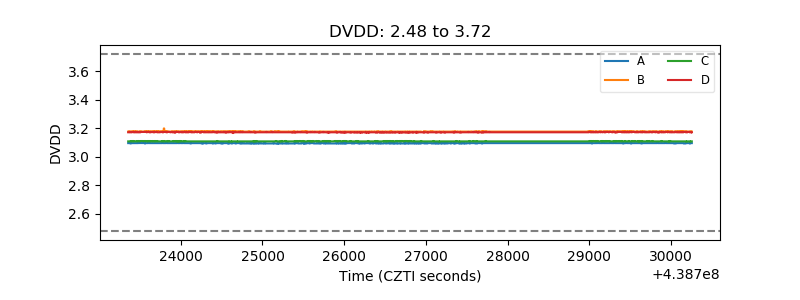 |
| Temperature 1 | 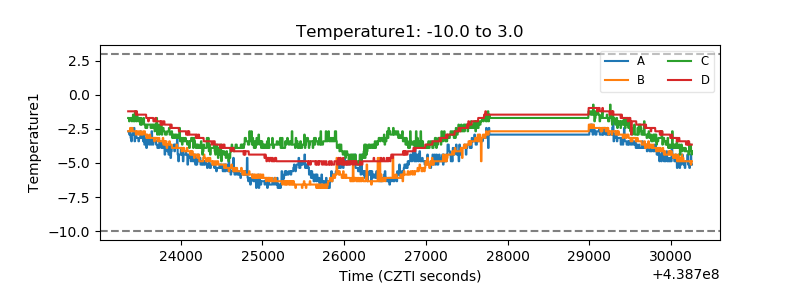 |
| Veto HV Monitor |  |
| Veto LLD | 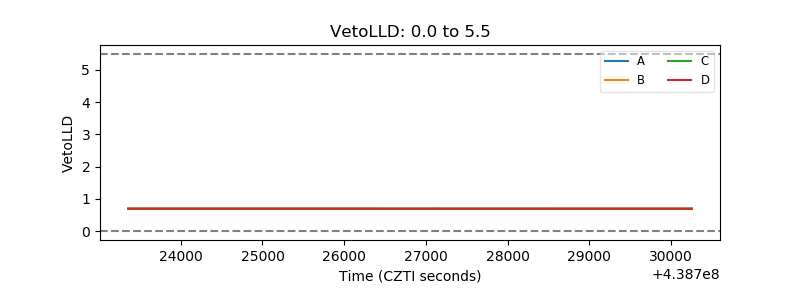 |
| Alpha Counter | 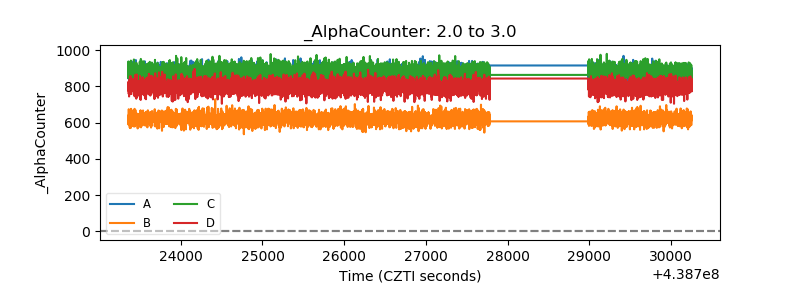 |
| _CPM_Rate | 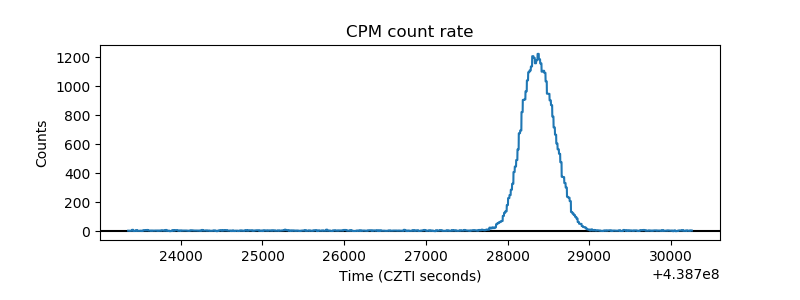 |
| CZT Counter | 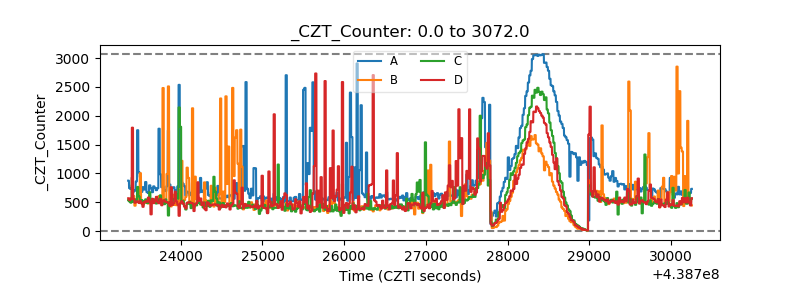 |
| +2.5 Volts monitor | 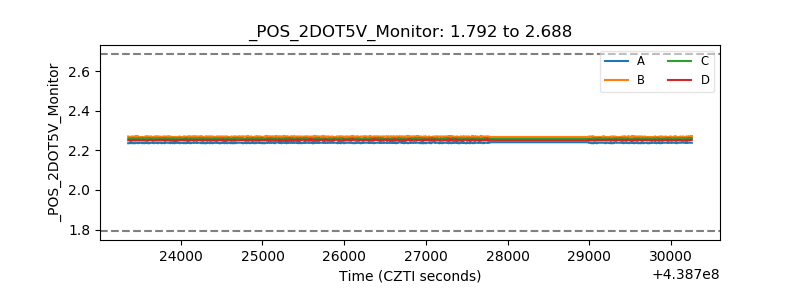 |
| +5 Volts monitor | 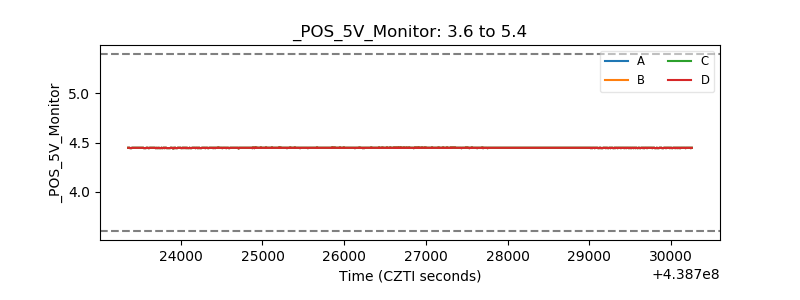 |
| _ROLL_ROT | 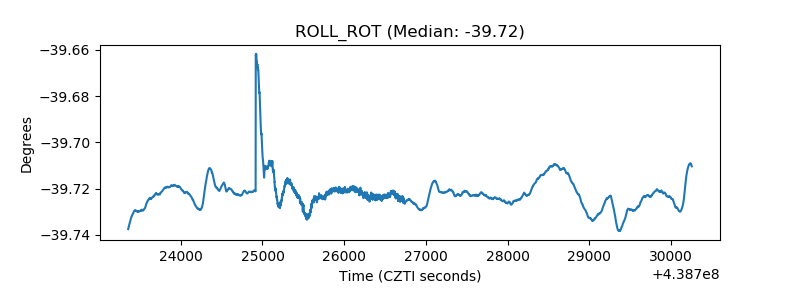 |
| _Roll_DEC | 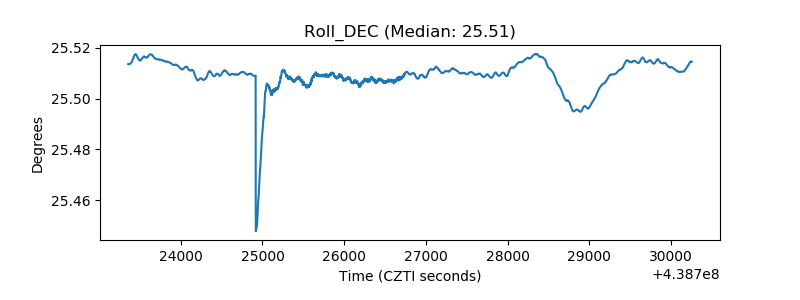 |
| _Roll_RA | 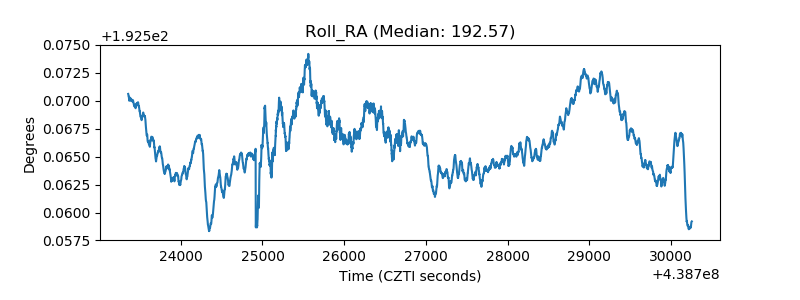 |
| Veto Counter | 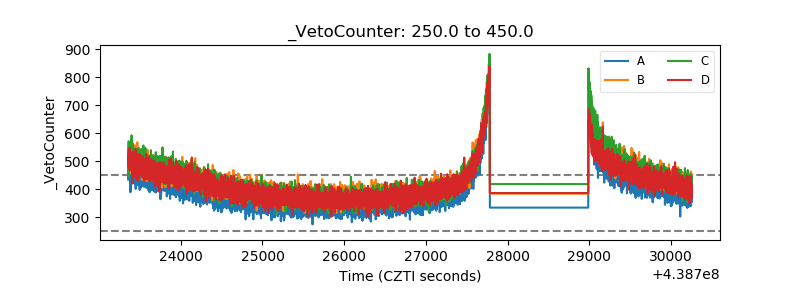 |