| Param | Original file | Final file |
|---|---|---|
| Filename | modeM0/AS1A13_012T02_9000005950_44142cztM0_level2.fits | modeM0/AS1A13_012T02_9000005950_44142cztM0_level2_quad_clean.evt |
| Size (bytes) | 437,664,960 | 111,574,080 |
| Size | 417.4 MB | 106.4 MB |
| Events in quadrant A | 5,061,511 | 734,486 |
| Events in quadrant B | 3,627,319 | 764,241 |
| Events in quadrant C | 3,063,918 | 752,691 |
| Events in quadrant D | 3,944,186 | 674,942 |
| Mode M9 | |||
|---|---|---|---|
| Quadrant | BADHDUFLAG | Total packets | Discarded packets |
| A | 0 | 11 | 0 |
| B | 0 | 12 | 0 |
| C | 0 | 12 | 0 |
| D | 0 | 12 | 0 |
| Mode SS | |||
|---|---|---|---|
| Quadrant | BADHDUFLAG | Total packets | Discarded packets |
| A | 0 | 130 | 0 |
| B | 0 | 130 | 0 |
| C | 0 | 130 | 0 |
| D | 0 | 130 | 0 |
| Mode M0 | |||
|---|---|---|---|
| Quadrant | BADHDUFLAG | Total packets | Discarded packets |
| A | 0 | 19703 | 3 |
| B | 0 | 15232 | 3 |
| C | 0 | 13632 | 3 |
| D | 0 | 16108 | 3 |
| Quadrant | Total seconds | Saturated seconds | Saturation percentage |
|---|---|---|---|
| A | 6483 | 334 | 5.151936% |
| B | 6483 | 235 | 3.624865% |
| C | 6483 | 45 | 0.694123% |
| D | 6483 | 156 | 2.406293% |
Noise dominated data is calculated using 1-second bins in cleaned event files. If a bin has >2000 counts, and if more than 50% of those come from <1% of pixels, then it is considered to be noise-dominated and hence unusable.
| Quadrant | # 1 sec bins | Bins with >0 counts | Bins with >2000 counts | High rate bins dominated by noise | Noise dominated (total time) | Noise dominated (detector-on time) | Marked lightcurve |
|---|---|---|---|---|---|---|---|
| A | 7633 | 6485 | 130 | 130 | 1.70% | 2.00% | 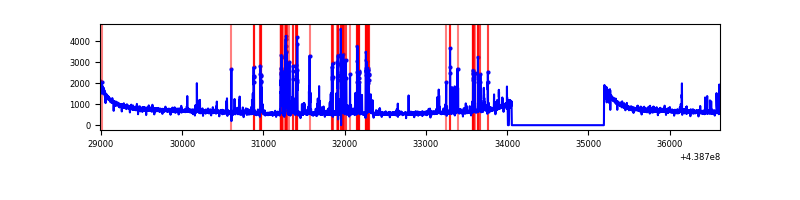 |
| B | 7633 | 6485 | 108 | 108 | 1.41% | 1.67% | 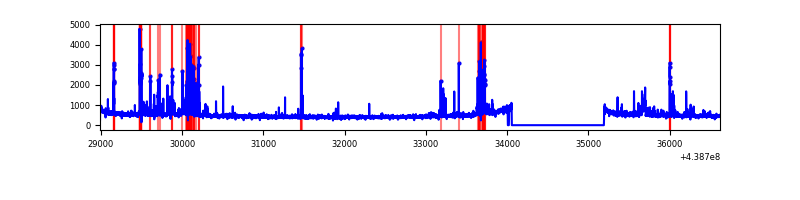 |
| C | 7633 | 6485 | 3 | 3 | 0.04% | 0.05% | 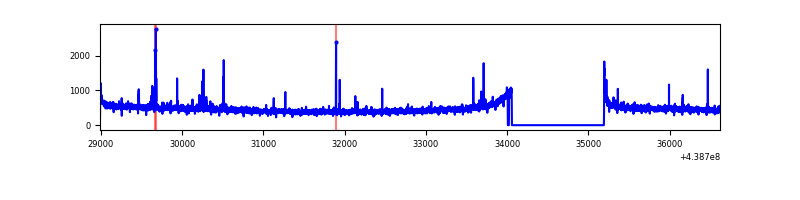 |
| D | 7633 | 6485 | 107 | 107 | 1.40% | 1.65% | 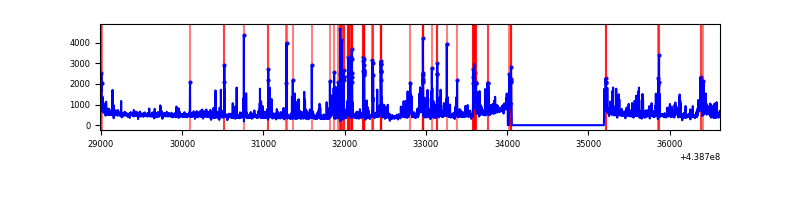 |
Top three noisy pixels from each quadrant. If the there are fewer than three noisy pixels in the level2.evt file, extra rows are filled as -1
| Pixel properties | Quadrant properties | ||||||
|---|---|---|---|---|---|---|---|
| Quadrant | DetID | PixID | Counts | Sigma | Mean | Median | Sigma |
| A | 10 | 83 | 1419645 | 8982.23 | 760 | 745 | 158.0 |
| A | 14 | 238 | 671101 | 4243.63 | 760 | 745 | 158.0 |
| A | 13 | 6 | 12434 | 74.0 | 760 | 745 | 158.0 |
| B | 5 | 172 | 374803 | 2500.87 | 761 | 739 | 149.6 |
| B | 5 | 235 | 162636 | 1082.39 | 761 | 739 | 149.6 |
| B | 0 | 189 | 48101 | 316.64 | 761 | 739 | 149.6 |
| C | 14 | 254 | 66928 | 365.89 | 761 | 765 | 180.8 |
| C | 12 | 16 | 10504 | 53.86 | 761 | 765 | 180.8 |
| C | 3 | 233 | 7681 | 38.25 | 761 | 765 | 180.8 |
| D | 13 | 249 | 361730 | 1891.23 | 753 | 731 | 190.9 |
| D | 1 | 47 | 259839 | 1357.44 | 753 | 731 | 190.9 |
| D | 1 | 52 | 254257 | 1328.19 | 753 | 731 | 190.9 |
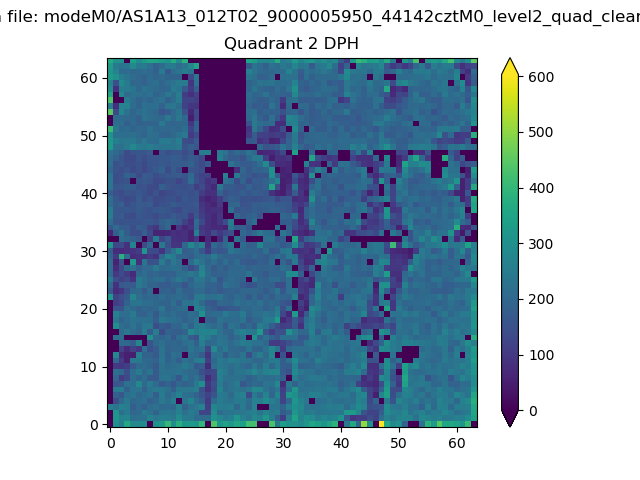
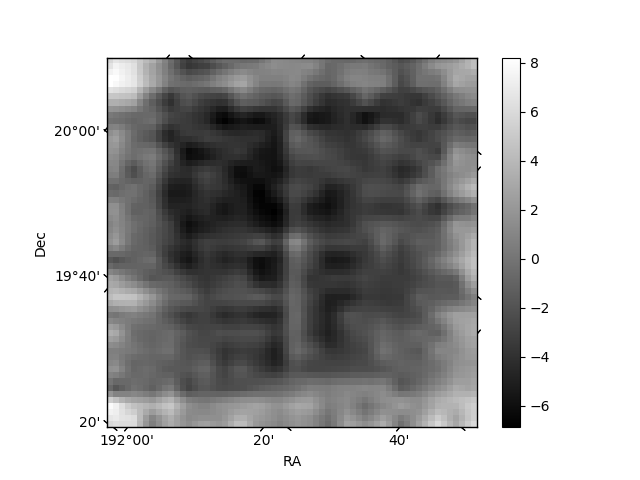
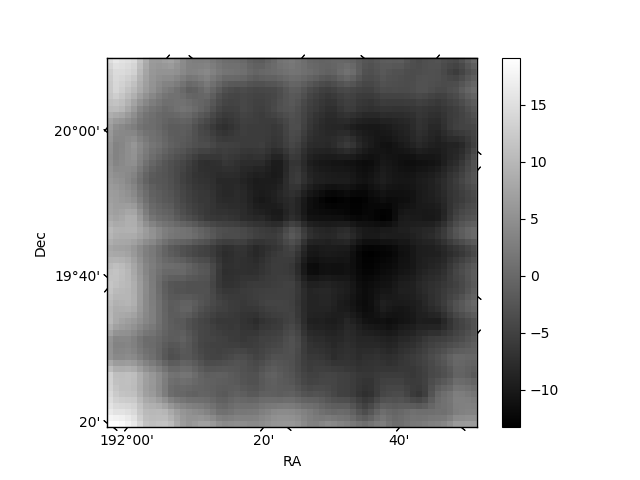
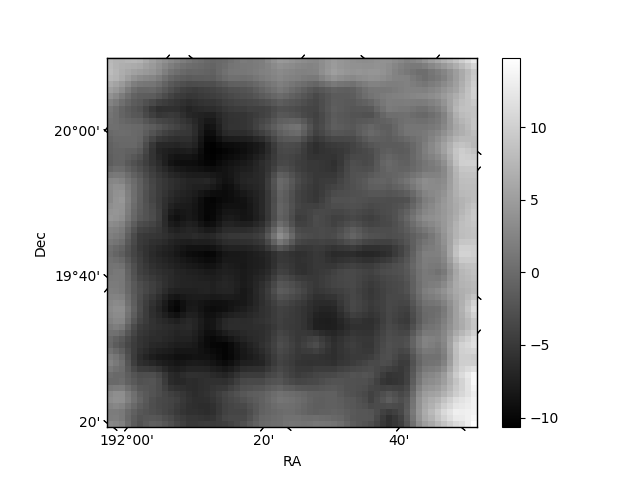
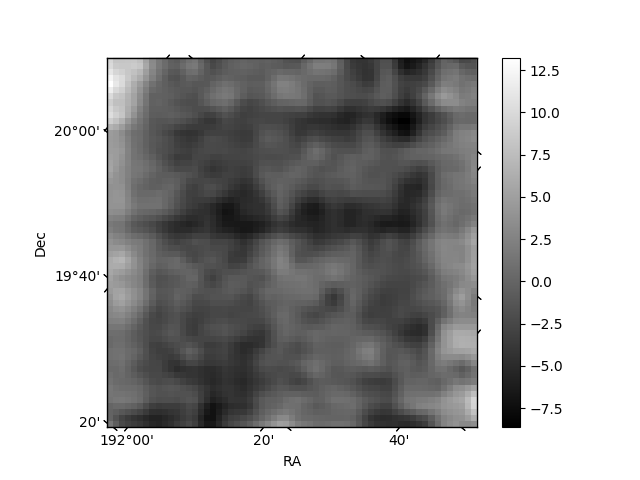
Histogram calculated using DETX and DETY for each event in the final _common_clean file
| Quadrant A | 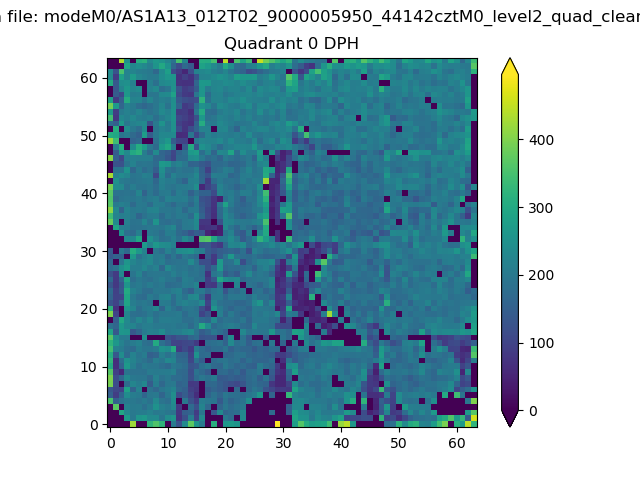 |
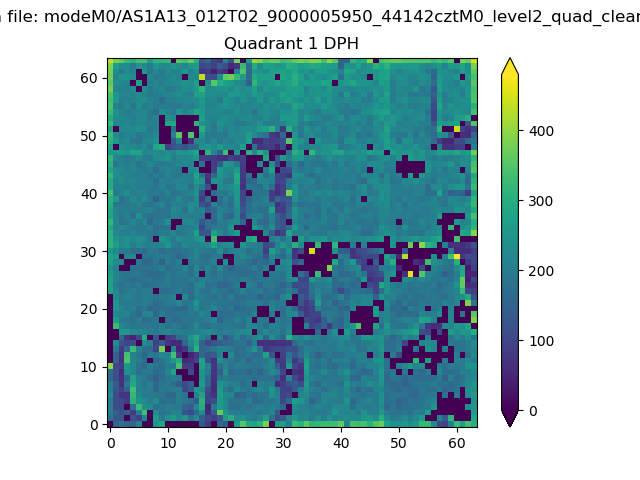 |
Quadrant B |
|---|---|---|---|
| Quadrant D | 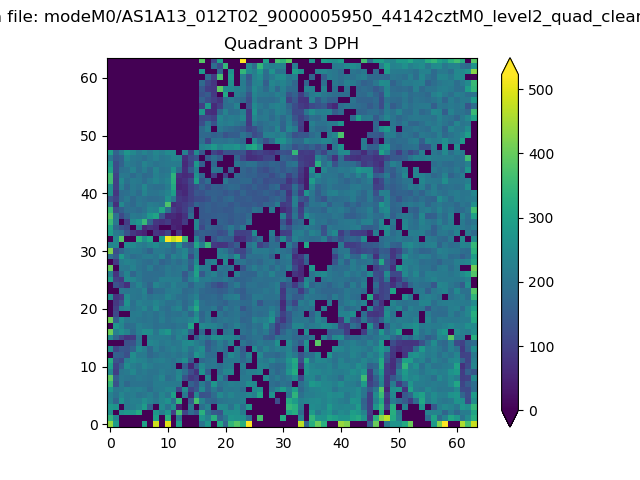 |
 |
Quadrant C |
| Plot type | Count rate plots | Images |
|---|---|---|
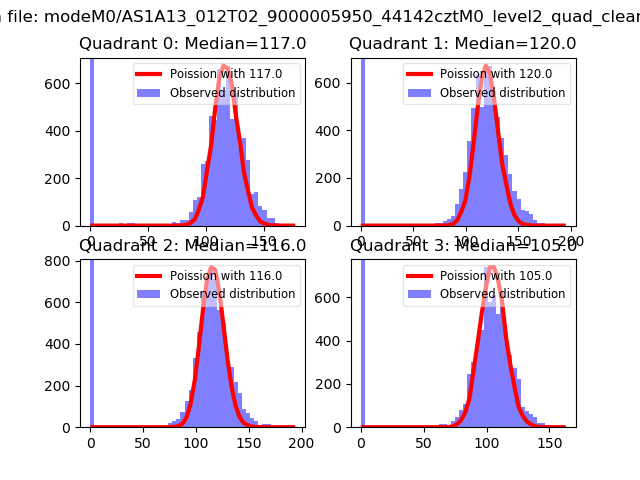
| Comparison with Poisson distribution Blue bars denote a histogram of data divided into 1 sec bins. Red curve is a Poisson curve with rate = median count rate of data. |
 |
 |
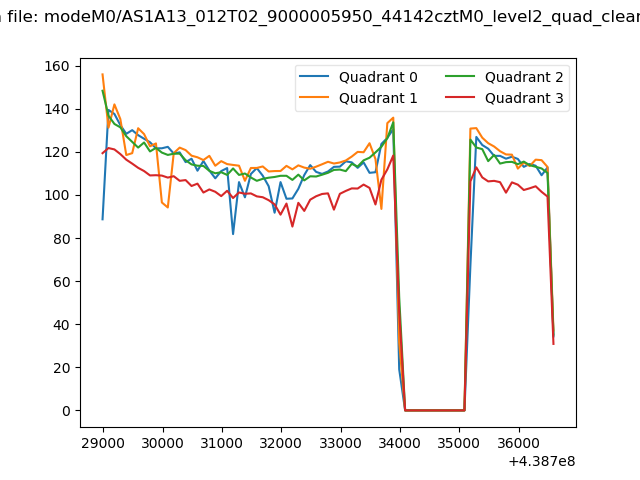
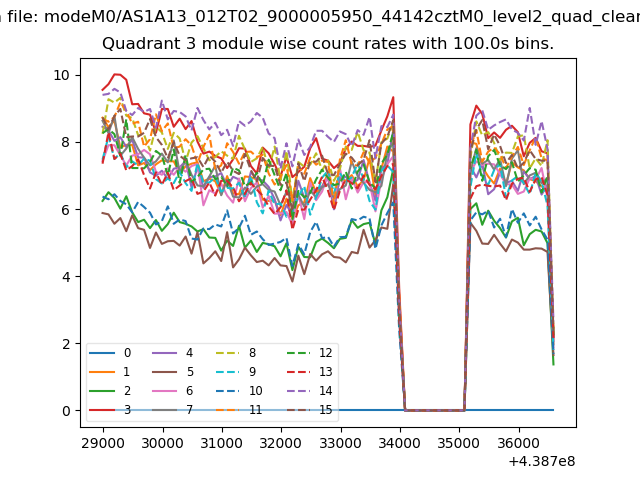
| Quadrant-wise count rates Data is divided into 100 sec bins |
 |
|
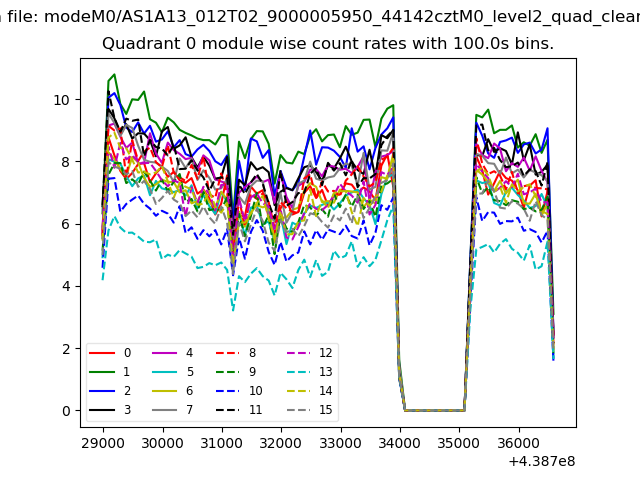
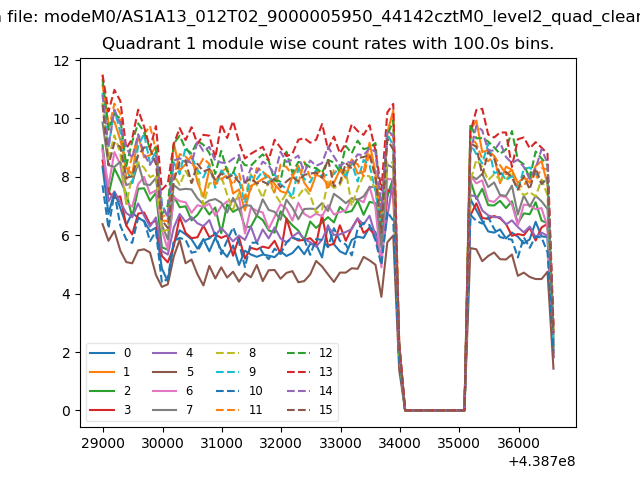
| Module-wise count rates for Quadrant A Data is divided into 100 sec bins |
 |
 |
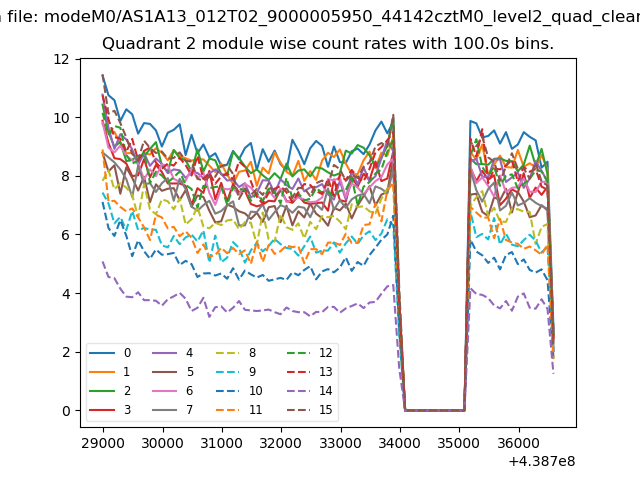
| Module-wise count rates for Quadrant B Data is divided into 100 sec bins |
 |
 |
| Module-wise count rates for Quadrant C Data is divided into 100 sec bins |
 |
 |
| Module-wise count rates for Quadrant D Data is divided into 100 sec bins |
 |
 |
| Parameter | Plot |
|---|---|
| CZT HV Monitor | 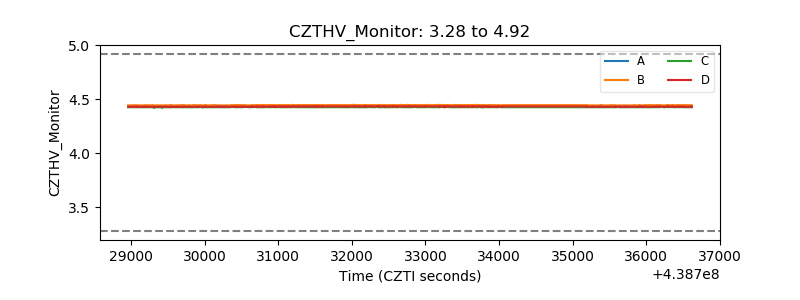 |
| D_VDD | 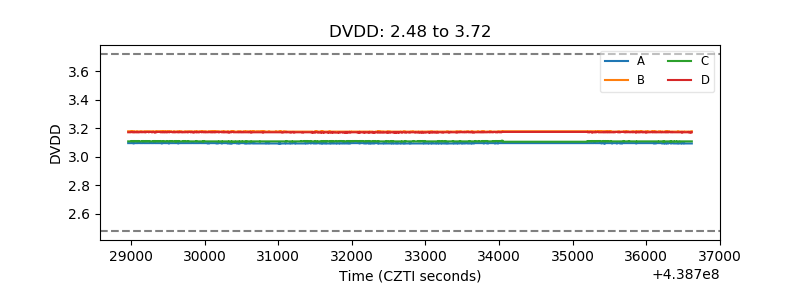 |
| Temperature 1 | 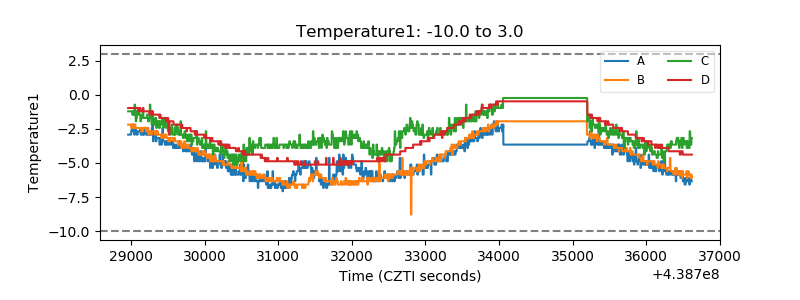 |
| Veto HV Monitor | 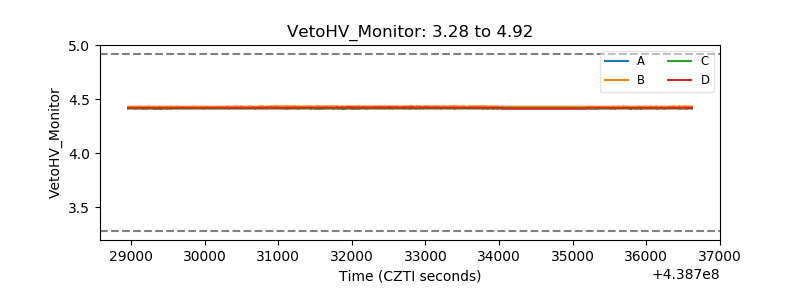 |
| Veto LLD | 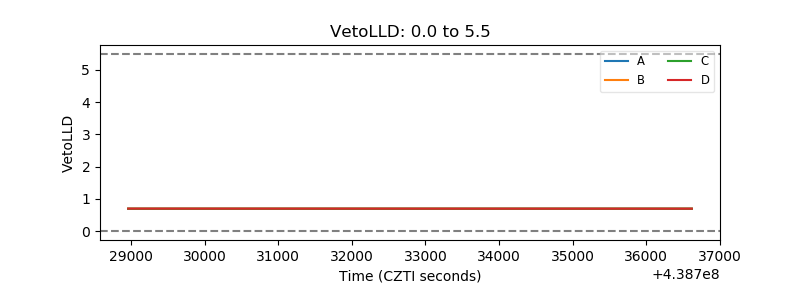 |
| Alpha Counter | 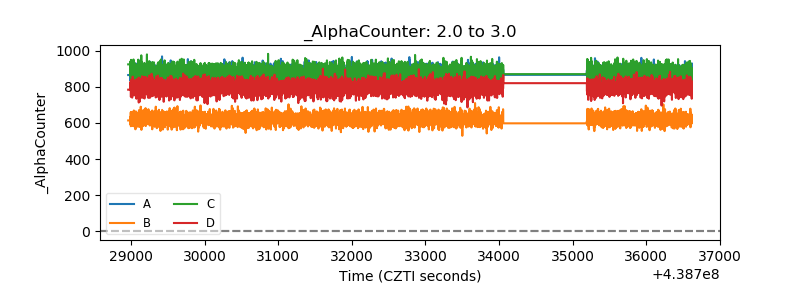 |
| _CPM_Rate | 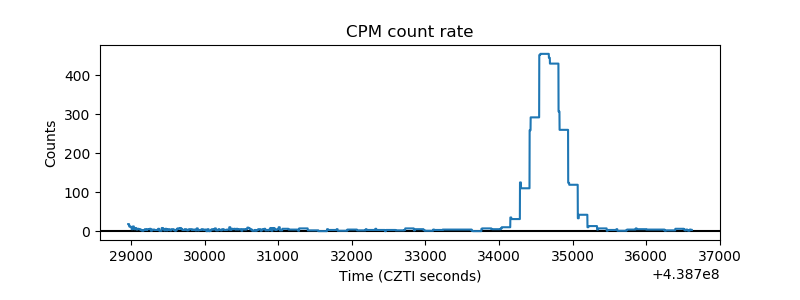 |
| CZT Counter | 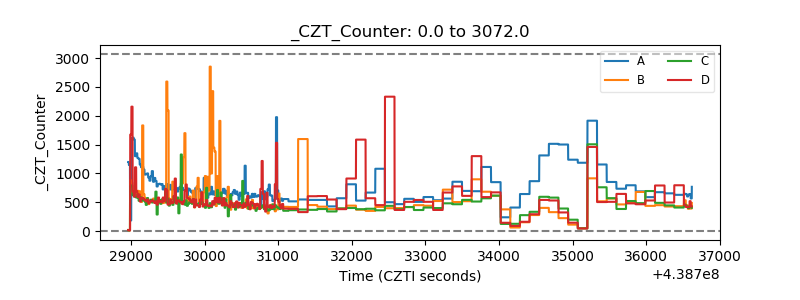 |
| +2.5 Volts monitor |  |
| +5 Volts monitor | 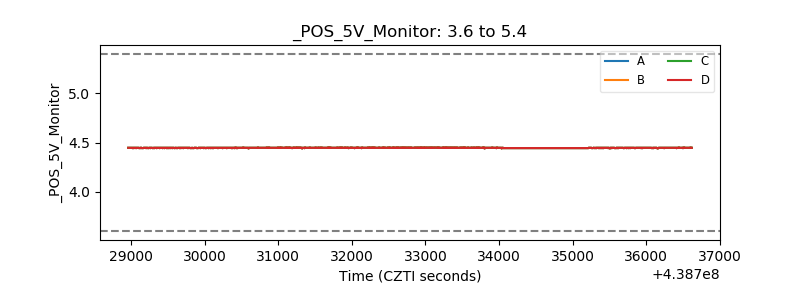 |
| _ROLL_ROT | 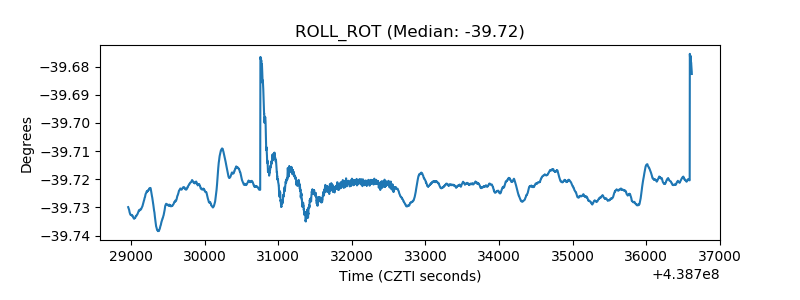 |
| _Roll_DEC | 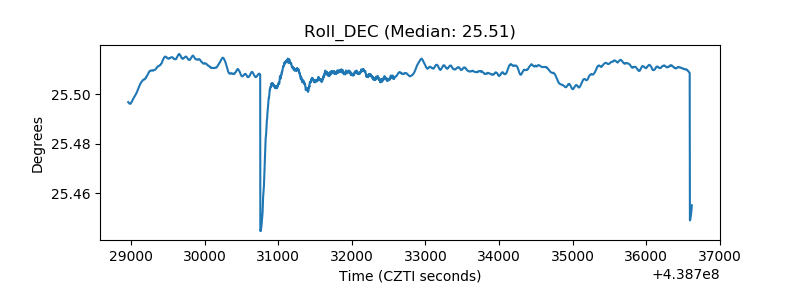 |
| _Roll_RA | 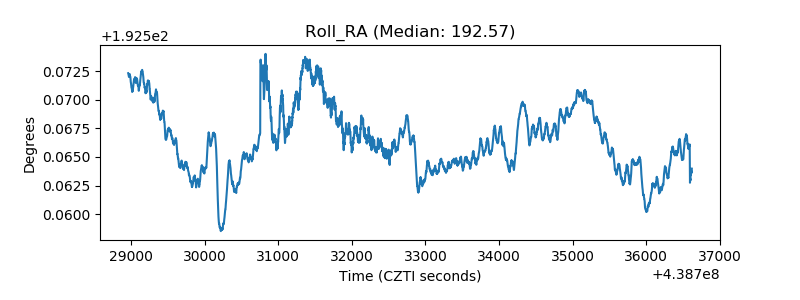 |
| Veto Counter | 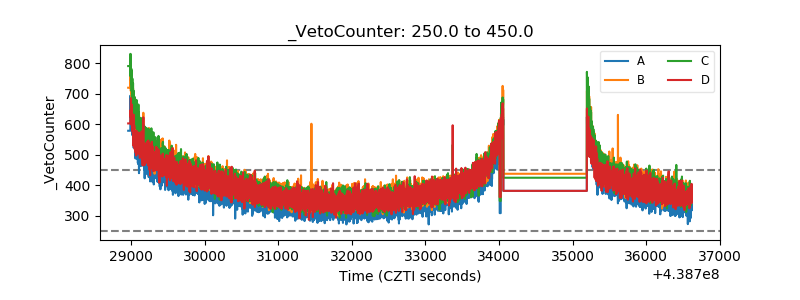 |