| Param | Original file | Final file |
|---|---|---|
| Filename | modeM0/AS1A13_012T02_9000005950_44143cztM0_level2.fits | modeM0/AS1A13_012T02_9000005950_44143cztM0_level2_quad_clean.evt |
| Size (bytes) | 436,098,240 | 109,272,960 |
| Size | 415.9 MB | 104.2 MB |
| Events in quadrant A | 4,816,192 | 725,882 |
| Events in quadrant B | 3,603,732 | 742,509 |
| Events in quadrant C | 3,067,255 | 728,699 |
| Events in quadrant D | 4,142,348 | 650,998 |
| Mode M9 | |||
|---|---|---|---|
| Quadrant | BADHDUFLAG | Total packets | Discarded packets |
| A | 0 | 9 | 0 |
| B | 0 | 9 | 0 |
| C | 0 | 9 | 0 |
| D | 0 | 9 | 0 |
| Mode SS | |||
|---|---|---|---|
| Quadrant | BADHDUFLAG | Total packets | Discarded packets |
| A | 0 | 134 | 0 |
| B | 0 | 134 | 0 |
| C | 0 | 134 | 0 |
| D | 0 | 136 | 0 |
| Mode M0 | |||
|---|---|---|---|
| Quadrant | BADHDUFLAG | Total packets | Discarded packets |
| A | 0 | 18996 | 1 |
| B | 0 | 15286 | 1 |
| C | 0 | 13848 | 1 |
| D | 0 | 16995 | 1 |
| Quadrant | Total seconds | Saturated seconds | Saturation percentage |
|---|---|---|---|
| A | 6606 | 180 | 2.724796% |
| B | 6606 | 202 | 3.057826% |
| C | 6606 | 18 | 0.272480% |
| D | 6606 | 211 | 3.194066% |
Noise dominated data is calculated using 1-second bins in cleaned event files. If a bin has >2000 counts, and if more than 50% of those come from <1% of pixels, then it is considered to be noise-dominated and hence unusable.
| Quadrant | # 1 sec bins | Bins with >0 counts | Bins with >2000 counts | High rate bins dominated by noise | Noise dominated (total time) | Noise dominated (detector-on time) | Marked lightcurve |
|---|---|---|---|---|---|---|---|
| A | 7501 | 6607 | 50 | 50 | 0.67% | 0.76% | 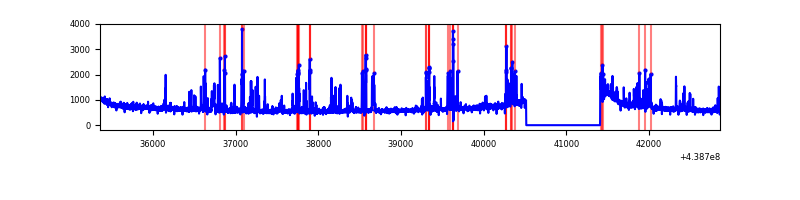 |
| B | 7501 | 6607 | 97 | 97 | 1.29% | 1.47% | 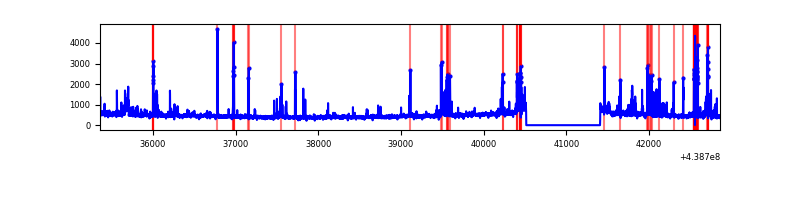 |
| C | 7501 | 6607 | 8 | 8 | 0.11% | 0.12% | 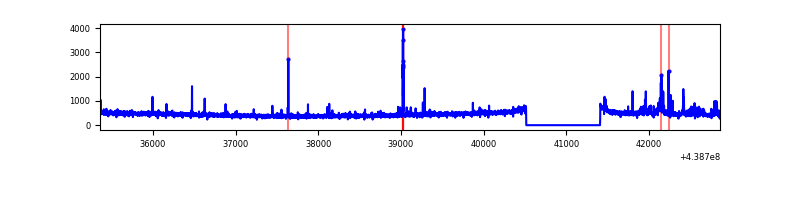 |
| D | 7501 | 6607 | 168 | 168 | 2.24% | 2.54% | 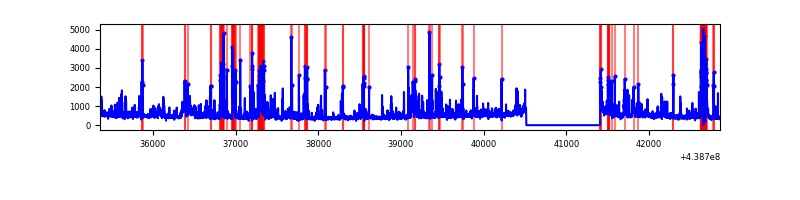 |
Top three noisy pixels from each quadrant. If the there are fewer than three noisy pixels in the level2.evt file, extra rows are filled as -1
| Pixel properties | Quadrant properties | ||||||
|---|---|---|---|---|---|---|---|
| Quadrant | DetID | PixID | Counts | Sigma | Mean | Median | Sigma |
| A | 10 | 83 | 1350641 | 8641.41 | 747 | 731 | 156.2 |
| A | 14 | 238 | 504400 | 3224.22 | 747 | 731 | 156.2 |
| A | 7 | 3 | 54668 | 345.28 | 747 | 731 | 156.2 |
| B | 5 | 172 | 280077 | 1899.87 | 742 | 720 | 147.0 |
| B | 5 | 235 | 127051 | 859.16 | 742 | 720 | 147.0 |
| B | 0 | 200 | 114819 | 775.97 | 742 | 720 | 147.0 |
| C | 1 | 241 | 119627 | 685.14 | 737 | 742 | 173.5 |
| C | 14 | 254 | 54284 | 308.57 | 737 | 742 | 173.5 |
| C | 3 | 233 | 8125 | 42.55 | 737 | 742 | 173.5 |
| D | 1 | 47 | 612323 | 3332.16 | 725 | 701 | 183.6 |
| D | 13 | 249 | 198933 | 1079.98 | 725 | 701 | 183.6 |
| D | 1 | 52 | 182475 | 990.32 | 725 | 701 | 183.6 |
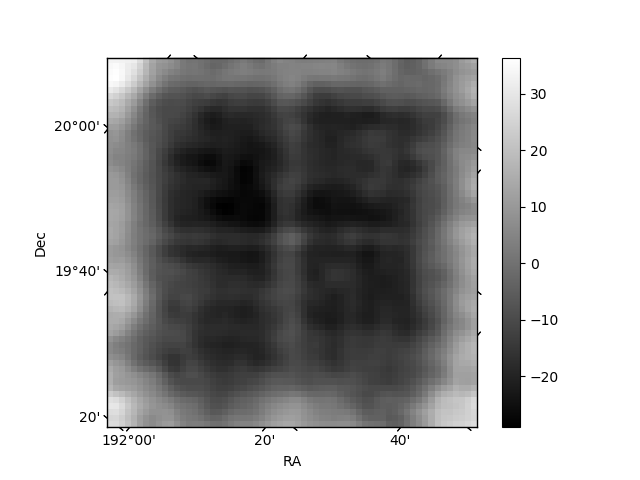
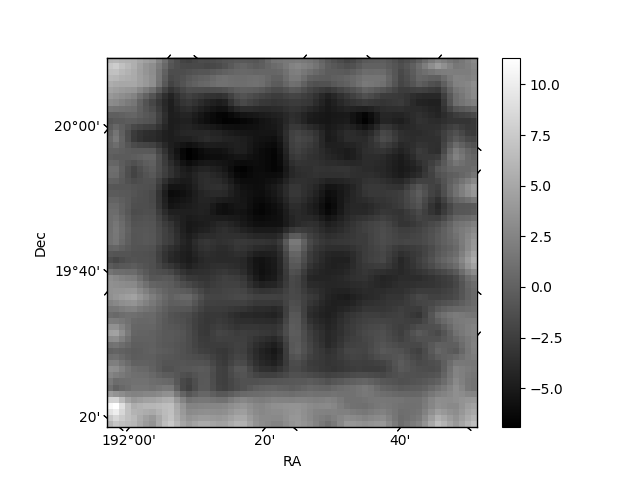
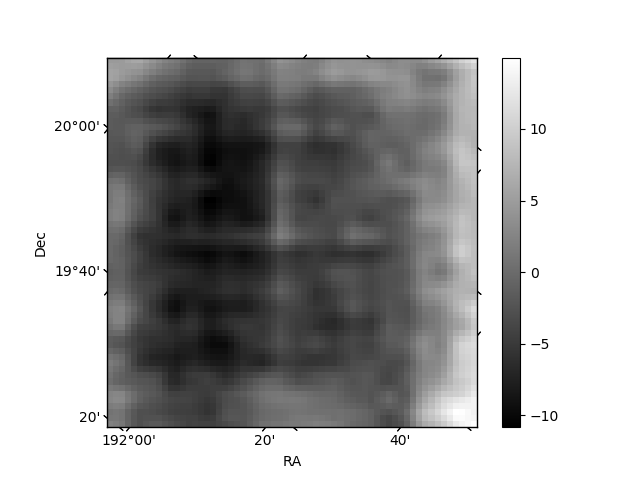
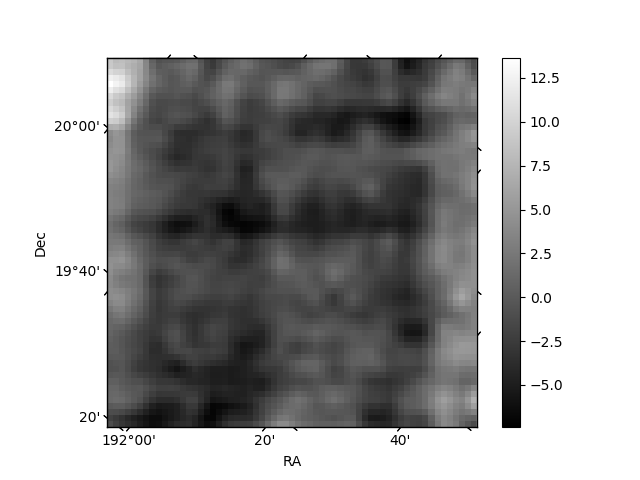
Histogram calculated using DETX and DETY for each event in the final _common_clean file
| Quadrant A | 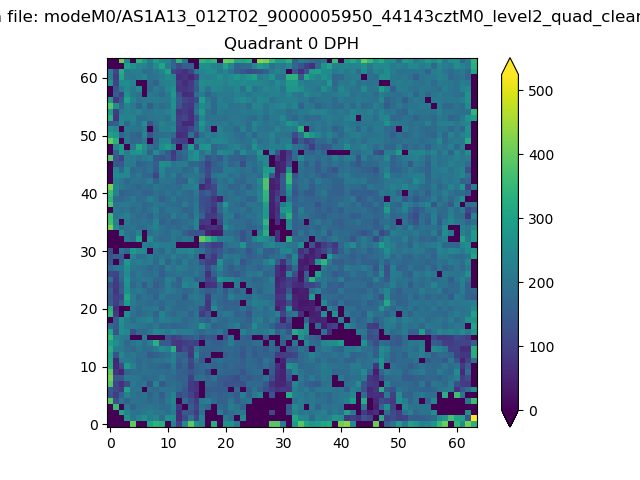 |
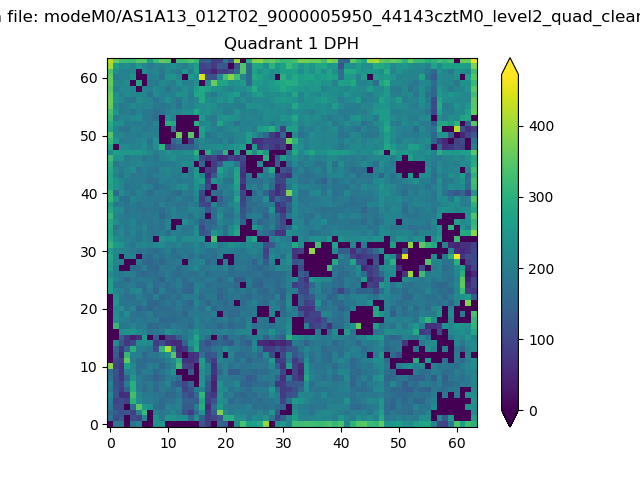 |
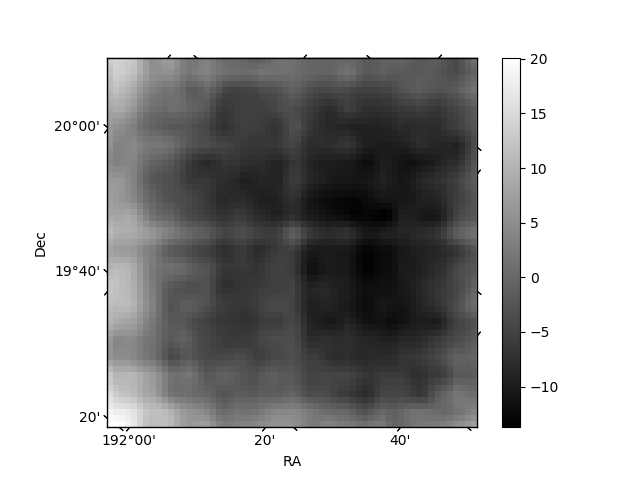
Quadrant B |
|---|---|---|---|
| Quadrant D | 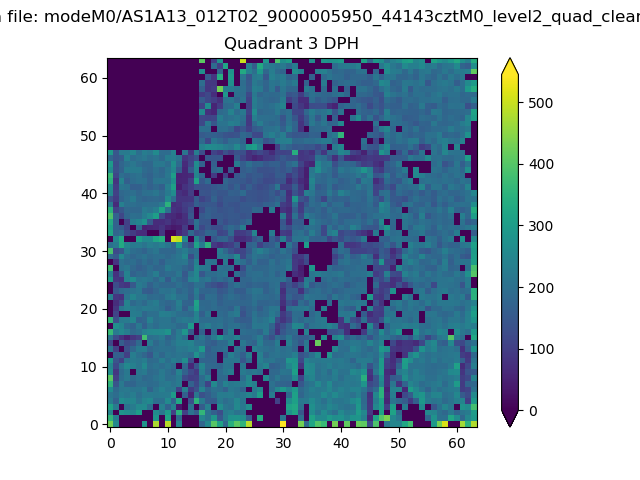 |
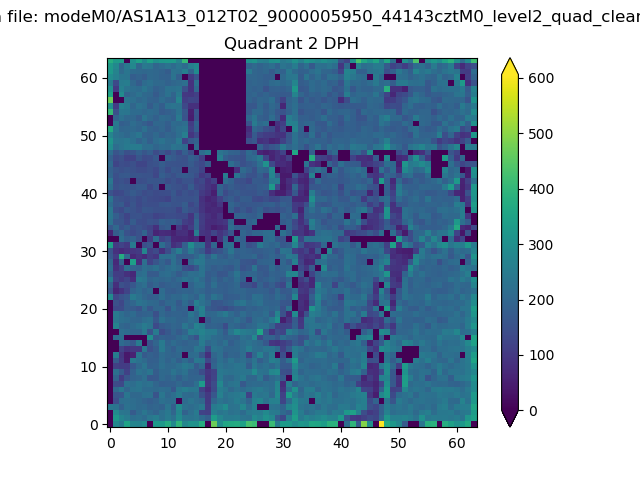 |
Quadrant C |
| Plot type | Count rate plots | Images |
|---|---|---|
| Comparison with Poisson distribution Blue bars denote a histogram of data divided into 1 sec bins. Red curve is a Poisson curve with rate = median count rate of data. |
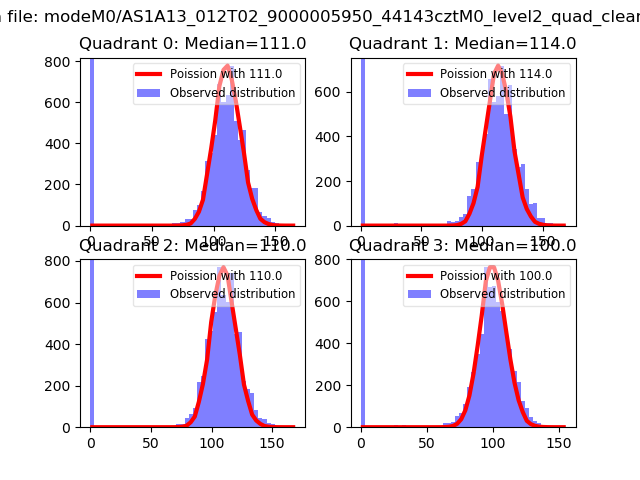 |
 |
| Quadrant-wise count rates Data is divided into 100 sec bins |
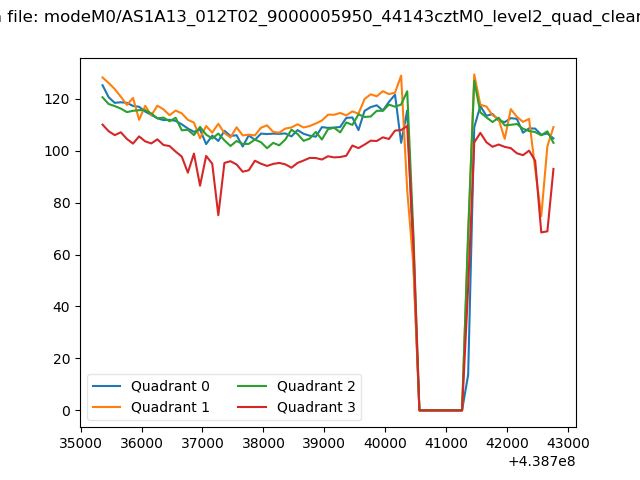 |
|
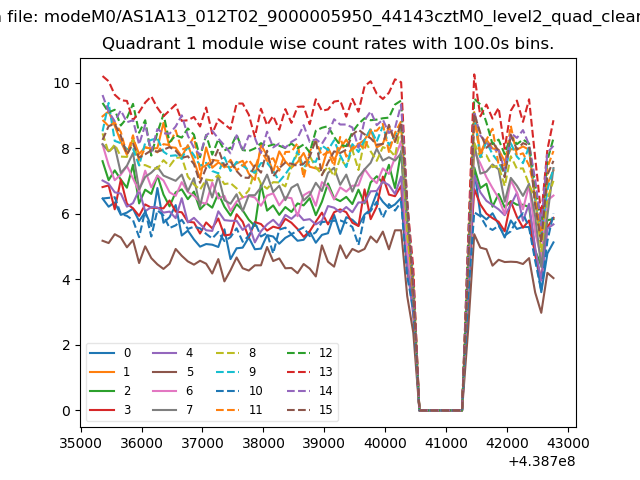
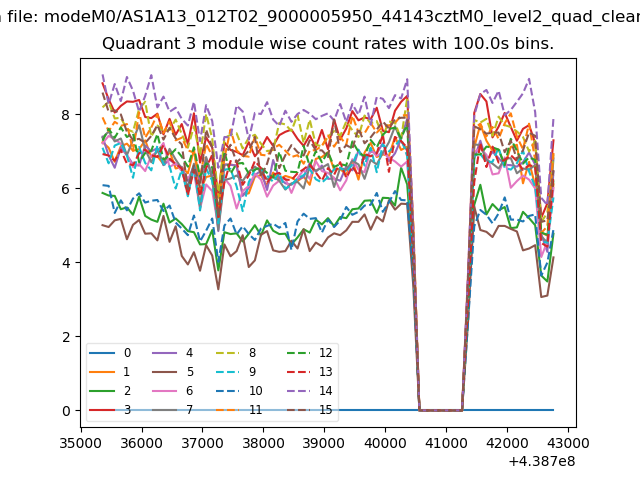
| Module-wise count rates for Quadrant A Data is divided into 100 sec bins |
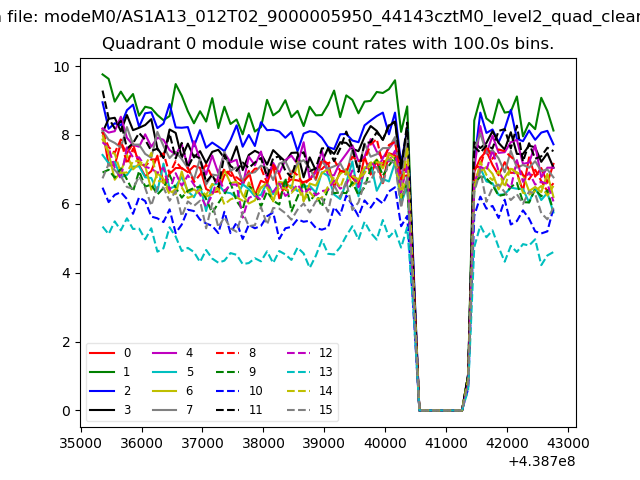 |
 |
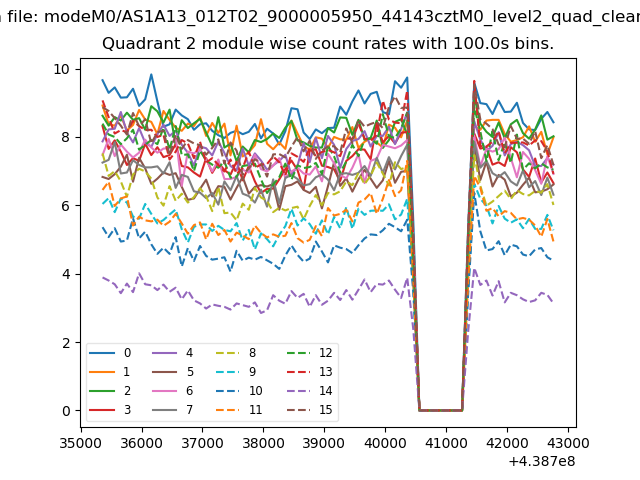
| Module-wise count rates for Quadrant B Data is divided into 100 sec bins |
 |
 |
| Module-wise count rates for Quadrant C Data is divided into 100 sec bins |
 |
 |
| Module-wise count rates for Quadrant D Data is divided into 100 sec bins |
 |
 |
| Parameter | Plot |
|---|---|
| CZT HV Monitor | 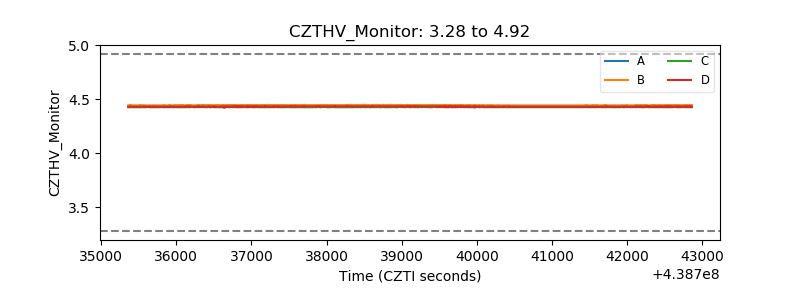 |
| D_VDD | 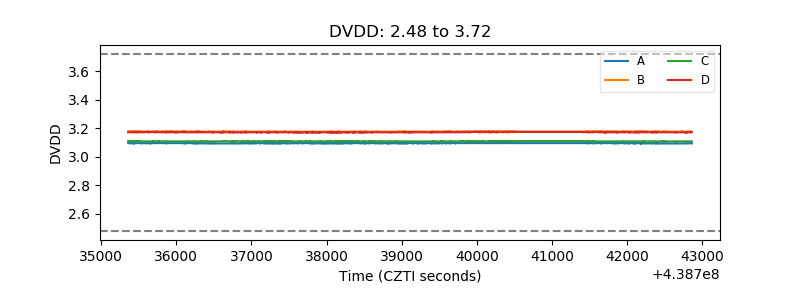 |
| Temperature 1 | 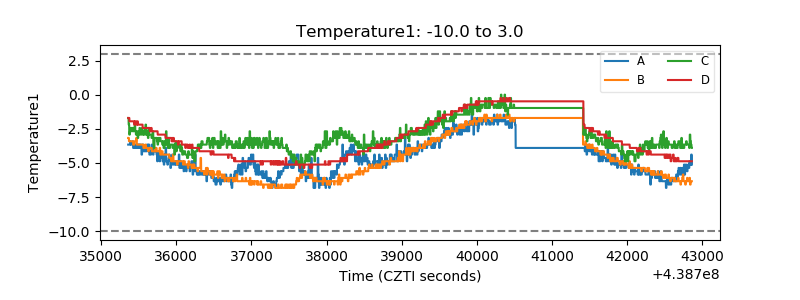 |
| Veto HV Monitor | 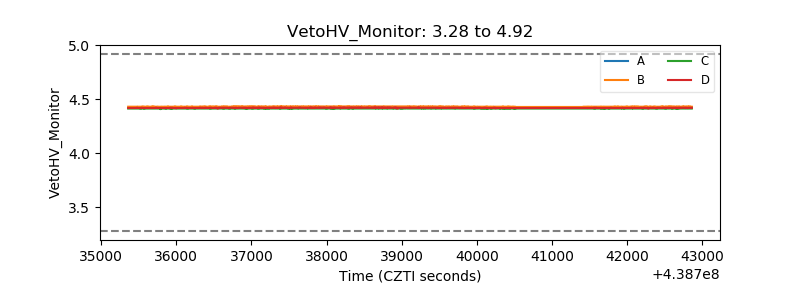 |
| Veto LLD | 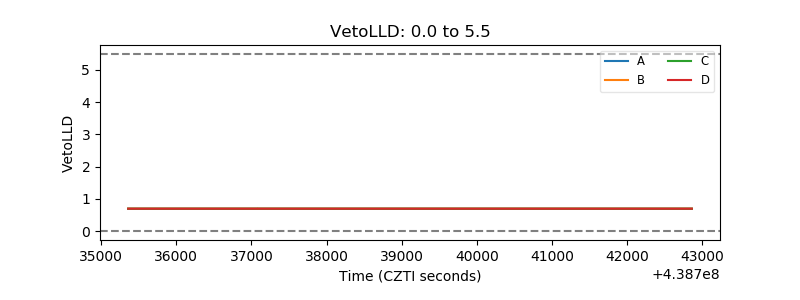 |
| Alpha Counter | 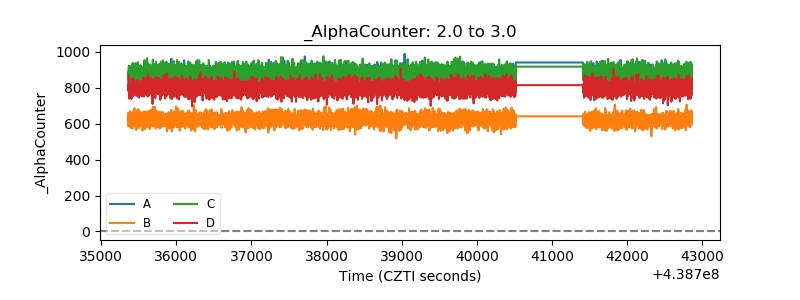 |
| _CPM_Rate | 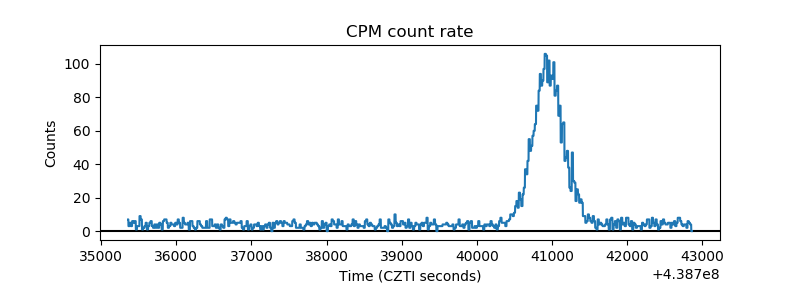 |
| CZT Counter | 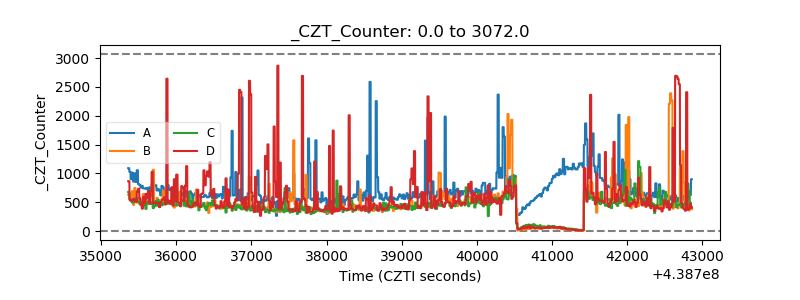 |
| +2.5 Volts monitor | 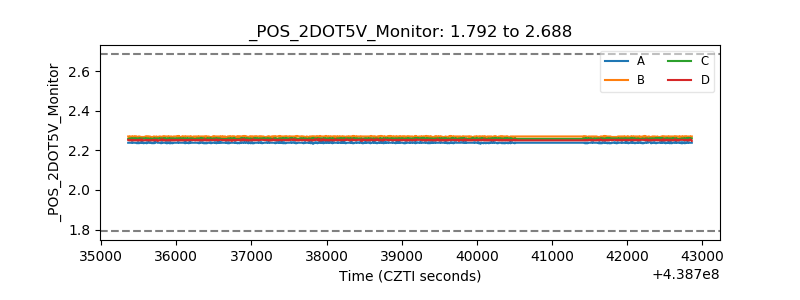 |
| +5 Volts monitor |  |
| _ROLL_ROT | 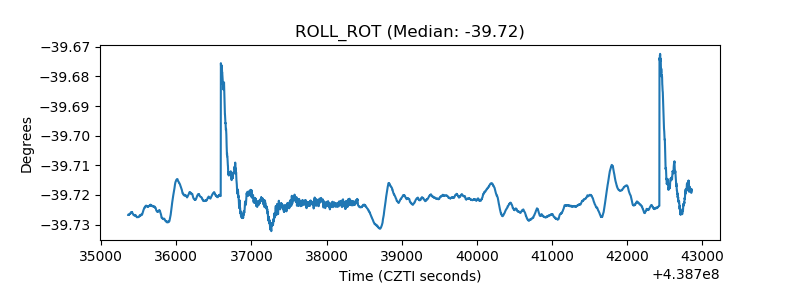 |
| _Roll_DEC | 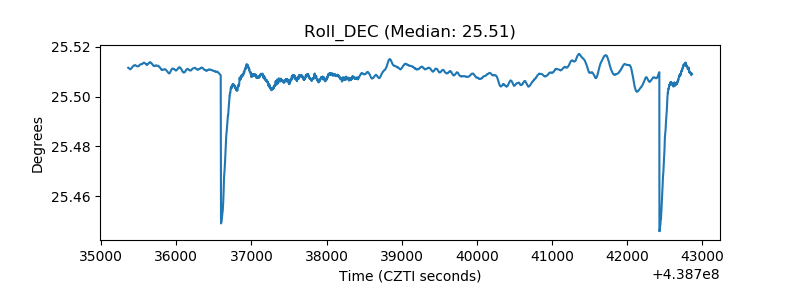 |
| _Roll_RA | 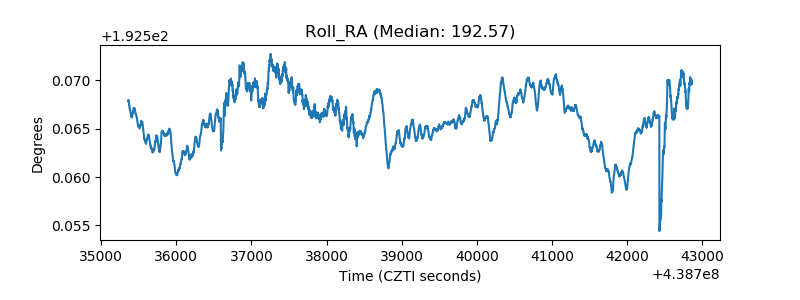 |
| Veto Counter | 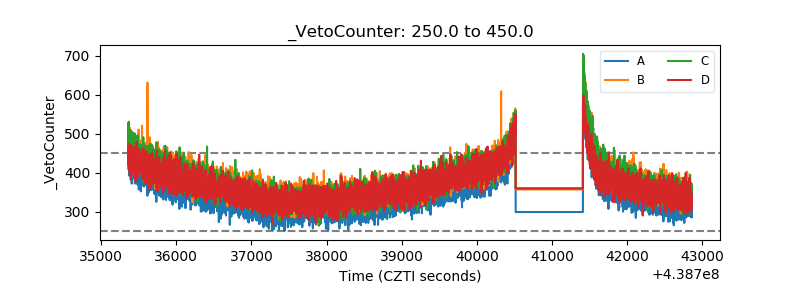 |