| Param | Original file | Final file |
|---|---|---|
| Filename | modeM0/AS1A13_012T02_9000005950_44144cztM0_level2.fits | modeM0/AS1A13_012T02_9000005950_44144cztM0_level2_quad_clean.evt |
| Size (bytes) | 518,011,200 | 116,213,760 |
| Size | 494.0 MB | 110.8 MB |
| Events in quadrant A | 6,583,470 | 706,419 |
| Events in quadrant B | 4,044,091 | 806,417 |
| Events in quadrant C | 3,571,144 | 791,055 |
| Events in quadrant D | 4,401,215 | 699,722 |
| Mode M9 | |||
|---|---|---|---|
| Quadrant | BADHDUFLAG | Total packets | Discarded packets |
| A | 0 | 4 | 0 |
| B | 0 | 4 | 0 |
| C | 0 | 4 | 0 |
| D | 0 | 4 | 0 |
| Mode SS | |||
|---|---|---|---|
| Quadrant | BADHDUFLAG | Total packets | Discarded packets |
| A | 0 | 152 | 0 |
| B | 0 | 152 | 0 |
| C | 0 | 152 | 0 |
| D | 0 | 152 | 0 |
| Mode M0 | |||
|---|---|---|---|
| Quadrant | BADHDUFLAG | Total packets | Discarded packets |
| A | 0 | 24524 | 1 |
| B | 0 | 17280 | 1 |
| C | 0 | 15931 | 1 |
| D | 0 | 18688 | 1 |
| Quadrant | Total seconds | Saturated seconds | Saturation percentage |
|---|---|---|---|
| A | 7400 | 998 | 13.486486% |
| B | 7401 | 253 | 3.418457% |
| C | 7401 | 26 | 0.351304% |
| D | 7401 | 254 | 3.431969% |
Noise dominated data is calculated using 1-second bins in cleaned event files. If a bin has >2000 counts, and if more than 50% of those come from <1% of pixels, then it is considered to be noise-dominated and hence unusable.
| Quadrant | # 1 sec bins | Bins with >0 counts | Bins with >2000 counts | High rate bins dominated by noise | Noise dominated (total time) | Noise dominated (detector-on time) | Marked lightcurve |
|---|---|---|---|---|---|---|---|
| A | 7780 | 7401 | 382 | 382 | 4.91% | 5.16% | 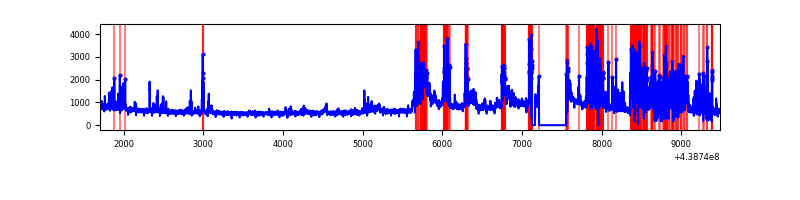 |
| B | 7781 | 7403 | 150 | 150 | 1.93% | 2.03% | 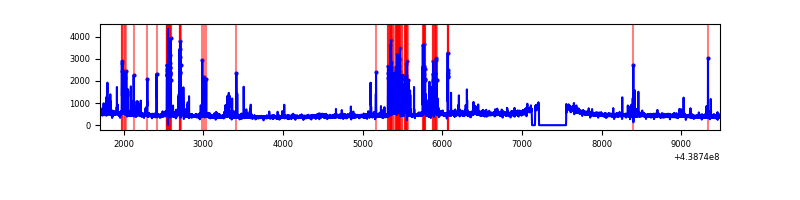 |
| C | 7781 | 7403 | 4 | 4 | 0.05% | 0.05% | 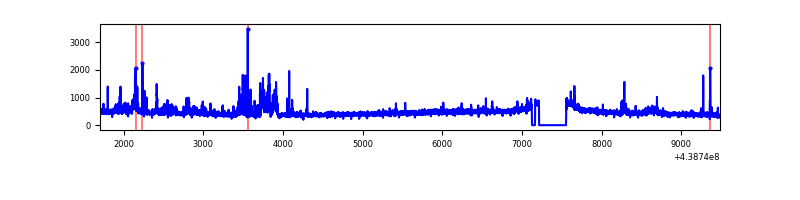 |
| D | 7781 | 7403 | 182 | 182 | 2.34% | 2.46% | 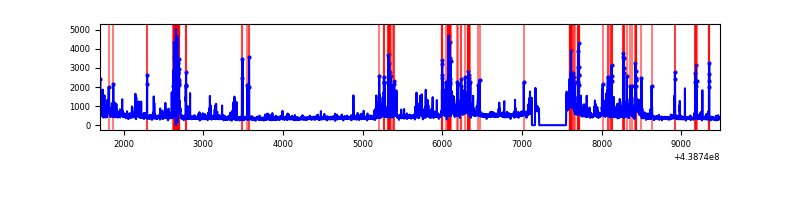 |
Top three noisy pixels from each quadrant. If the there are fewer than three noisy pixels in the level2.evt file, extra rows are filled as -1
| Pixel properties | Quadrant properties | ||||||
|---|---|---|---|---|---|---|---|
| Quadrant | DetID | PixID | Counts | Sigma | Mean | Median | Sigma |
| A | 15 | 223 | 1753310 | 10707.11 | 781 | 764 | 163.7 |
| A | 10 | 83 | 1273364 | 7774.9 | 781 | 764 | 163.7 |
| A | 14 | 238 | 509699 | 3109.32 | 781 | 764 | 163.7 |
| B | 5 | 172 | 567743 | 3505.74 | 817 | 792 | 161.7 |
| B | 0 | 200 | 159614 | 982.07 | 817 | 792 | 161.7 |
| B | 5 | 235 | 29777 | 179.23 | 817 | 792 | 161.7 |
| C | 1 | 241 | 332568 | 1737.59 | 811 | 816 | 190.9 |
| C | 14 | 254 | 44184 | 227.14 | 811 | 816 | 190.9 |
| C | 2 | 14 | 10153 | 48.9 | 811 | 816 | 190.9 |
| D | 1 | 47 | 831938 | 4109.94 | 793 | 767 | 202.2 |
| D | 2 | 249 | 267856 | 1320.69 | 793 | 767 | 202.2 |
| D | 13 | 249 | 67518 | 330.07 | 793 | 767 | 202.2 |
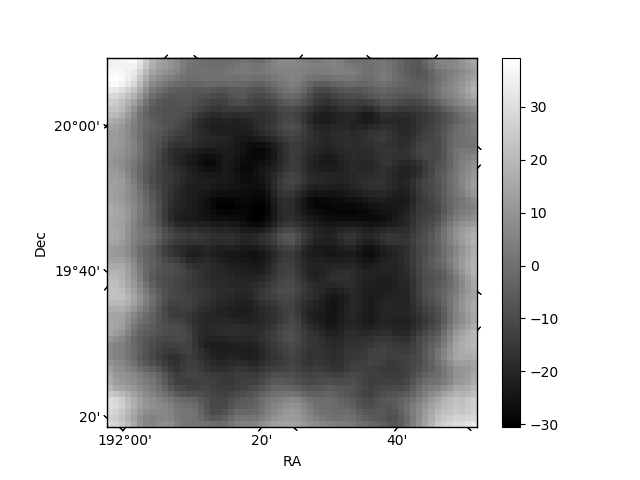
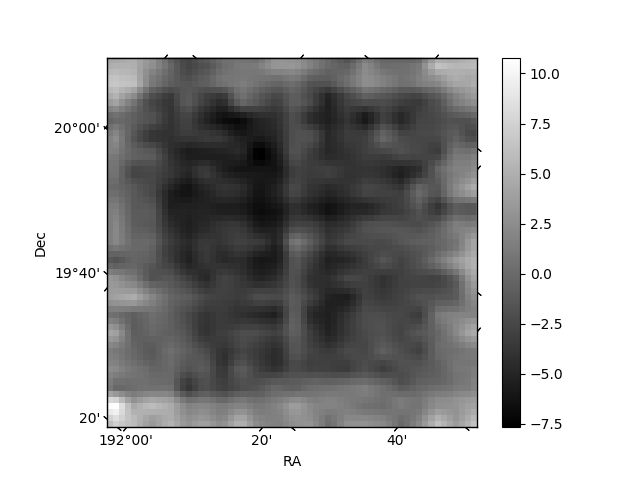
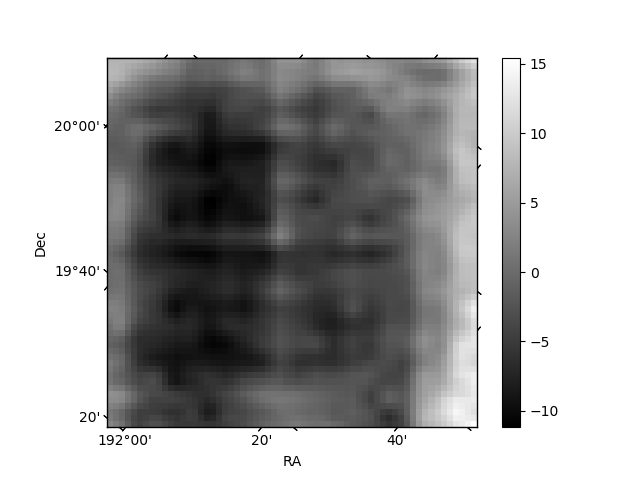
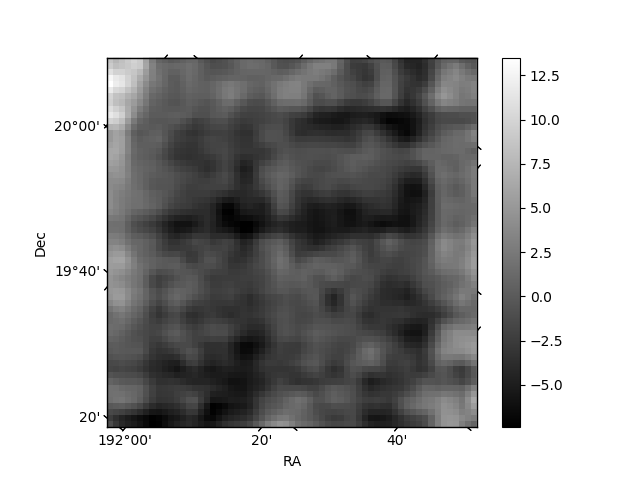
Histogram calculated using DETX and DETY for each event in the final _common_clean file
| Quadrant A | 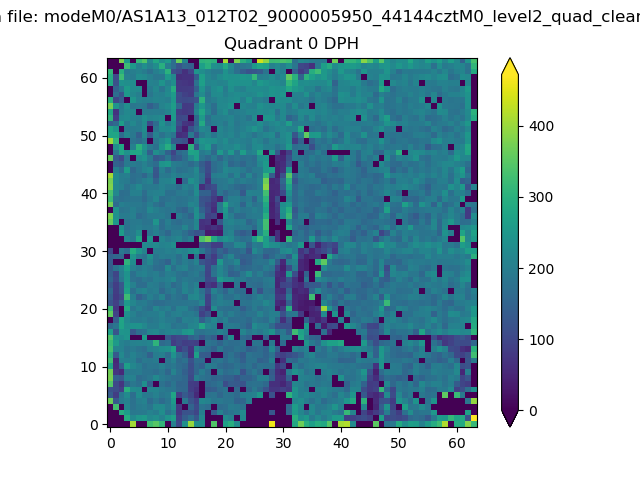 |
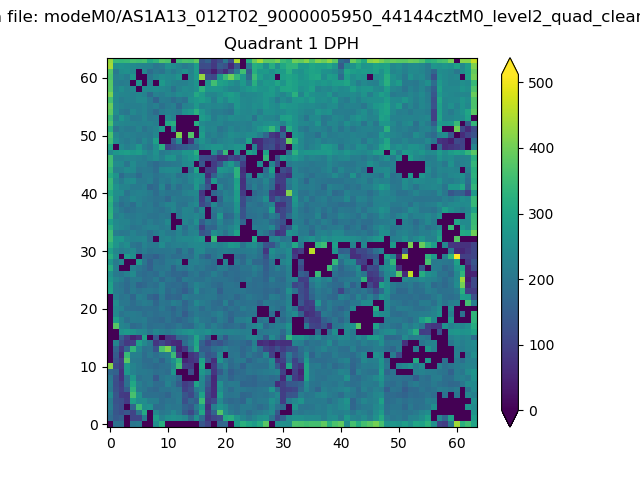 |
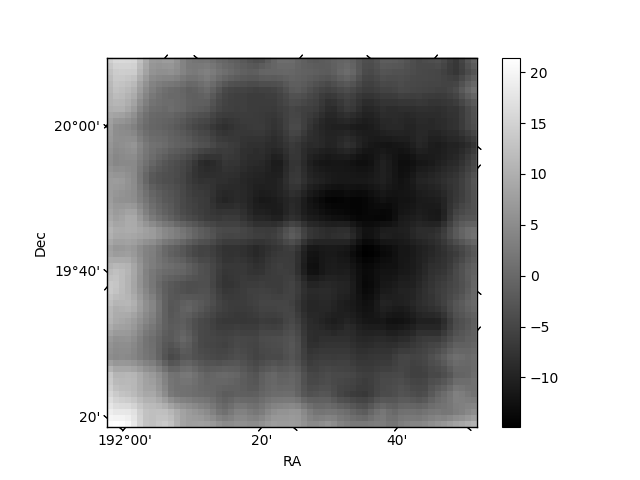
Quadrant B |
|---|---|---|---|
| Quadrant D | 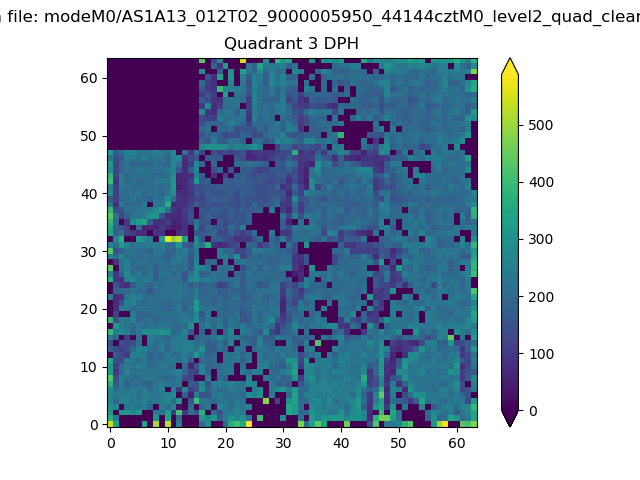 |
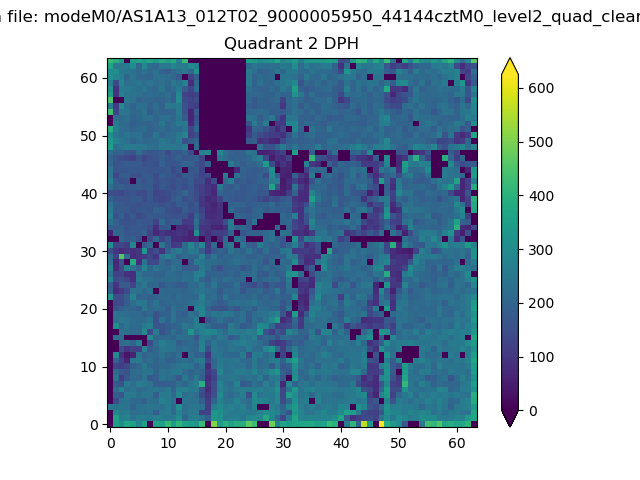 |
Quadrant C |
| Plot type | Count rate plots | Images |
|---|---|---|
| Comparison with Poisson distribution Blue bars denote a histogram of data divided into 1 sec bins. Red curve is a Poisson curve with rate = median count rate of data. |
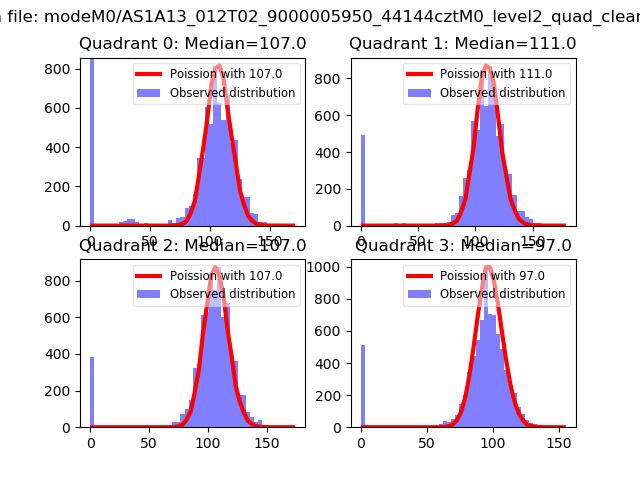 |
 |
| Quadrant-wise count rates Data is divided into 100 sec bins |
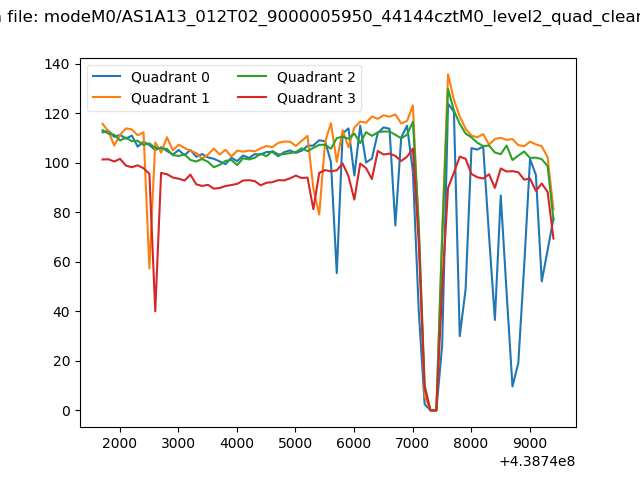 |
|
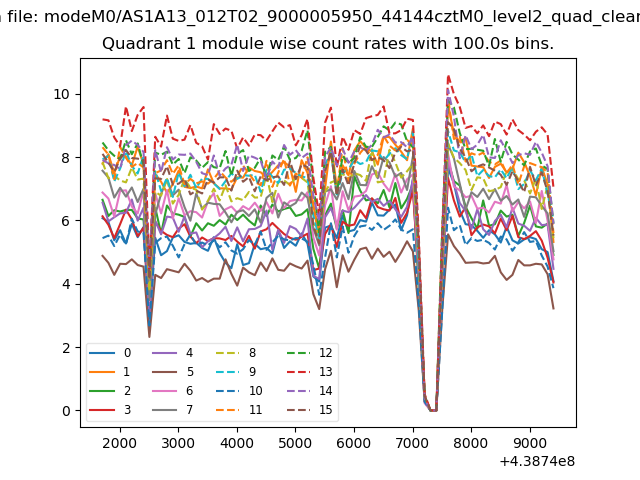
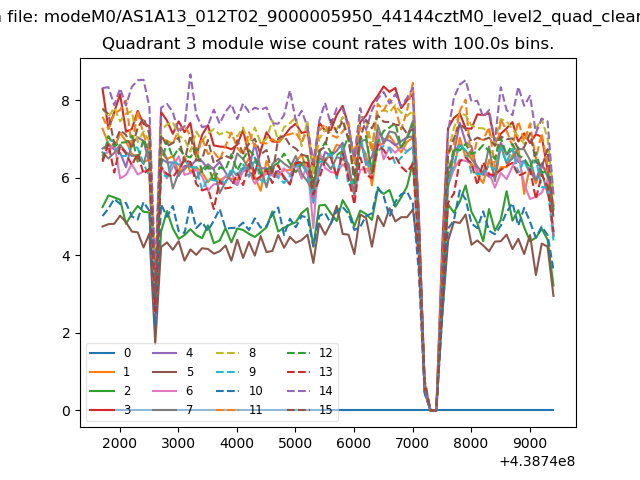
| Module-wise count rates for Quadrant A Data is divided into 100 sec bins |
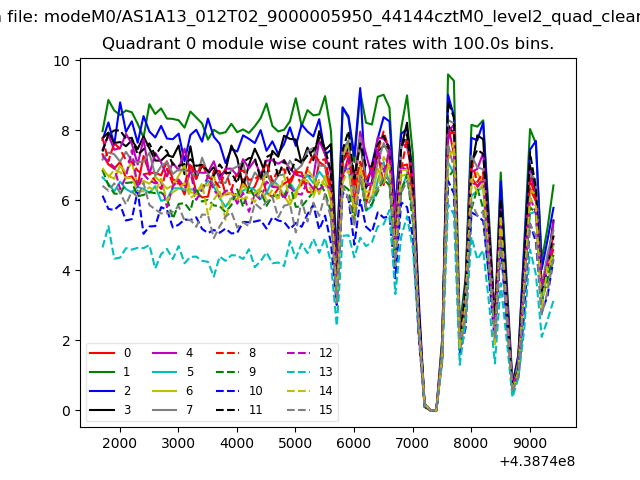 |
 |
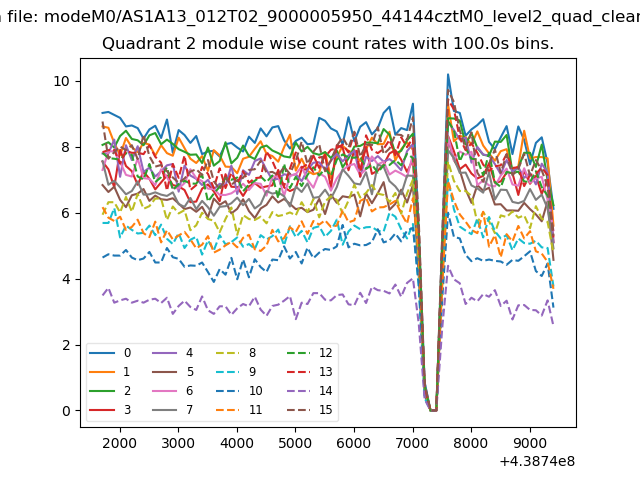
| Module-wise count rates for Quadrant B Data is divided into 100 sec bins |
 |
 |
| Module-wise count rates for Quadrant C Data is divided into 100 sec bins |
 |
 |
| Module-wise count rates for Quadrant D Data is divided into 100 sec bins |
 |
 |
| Parameter | Plot |
|---|---|
| CZT HV Monitor | 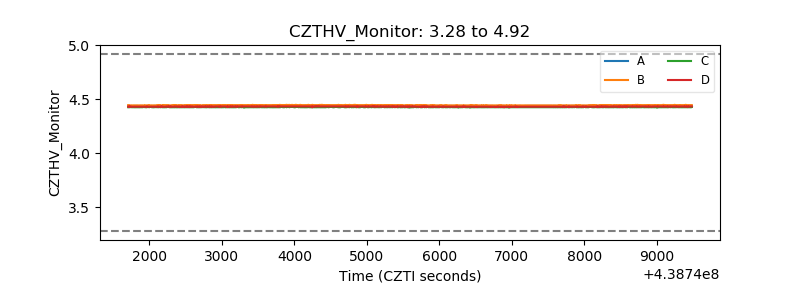 |
| D_VDD | 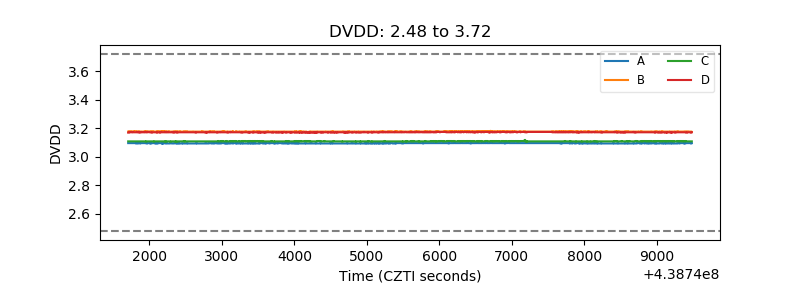 |
| Temperature 1 | 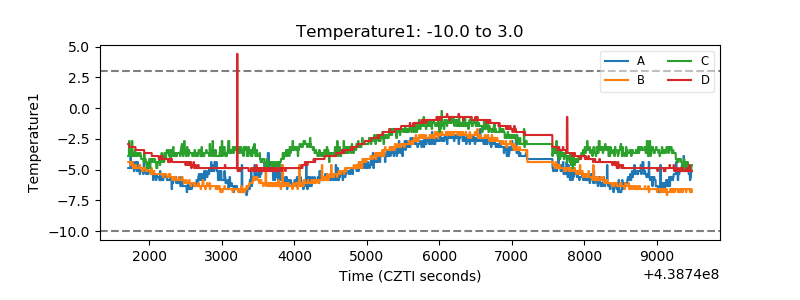 |
| Veto HV Monitor | 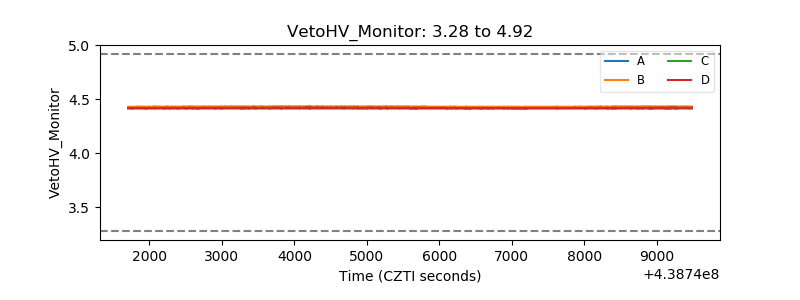 |
| Veto LLD | 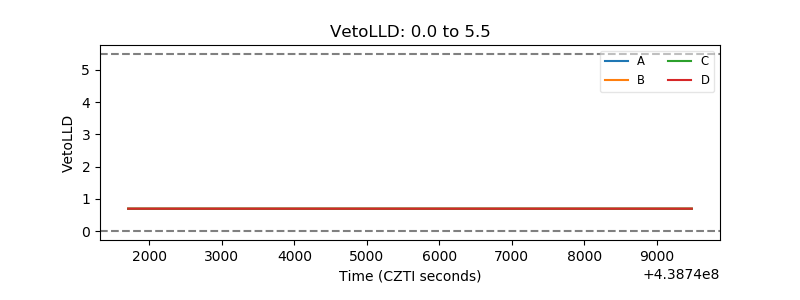 |
| Alpha Counter | 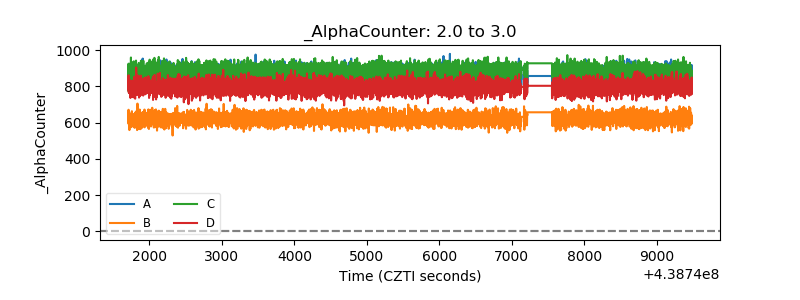 |
| _CPM_Rate | 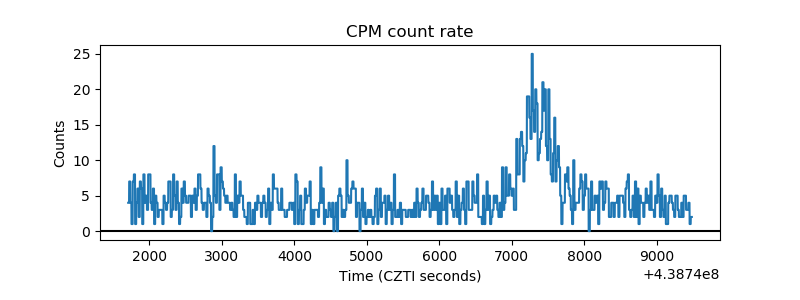 |
| CZT Counter | 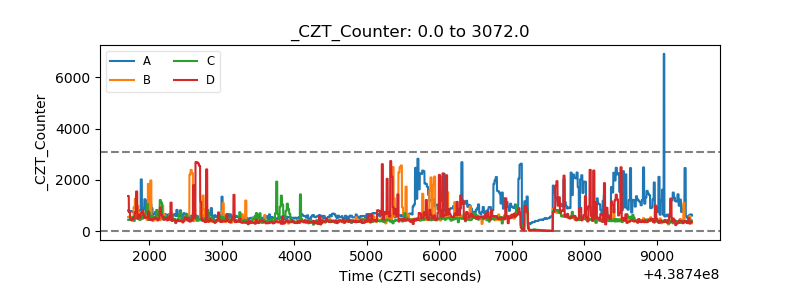 |
| +2.5 Volts monitor | 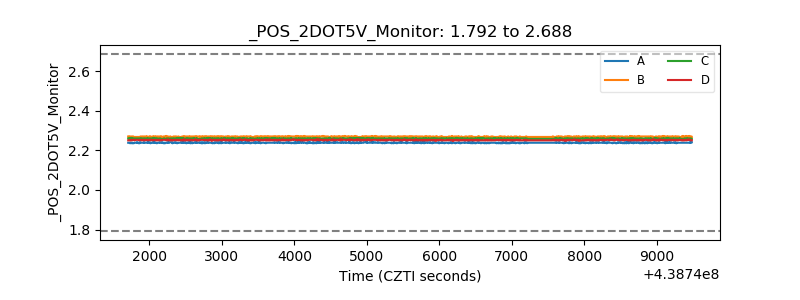 |
| +5 Volts monitor | 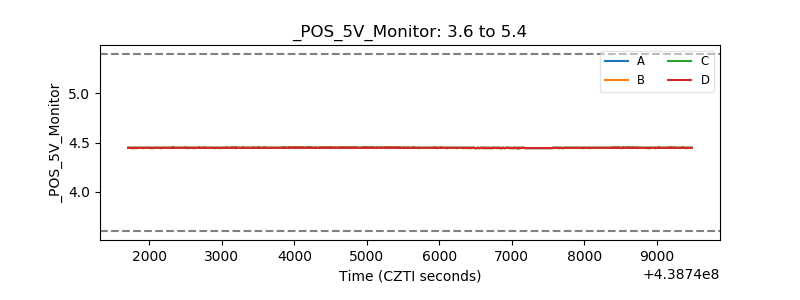 |
| _ROLL_ROT | 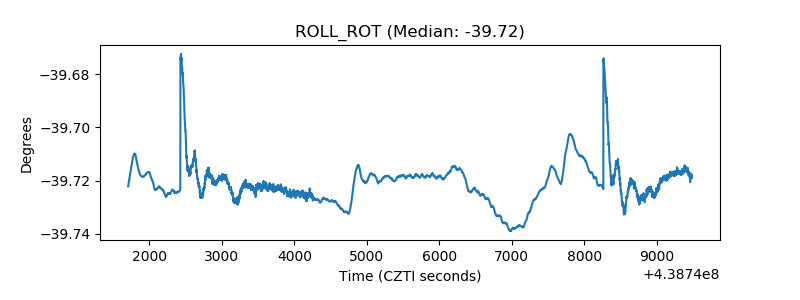 |
| _Roll_DEC | 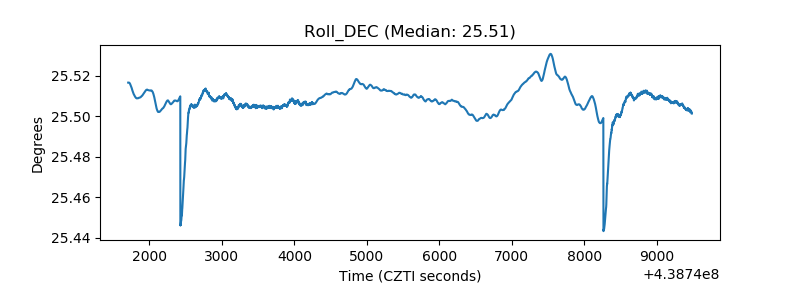 |
| _Roll_RA | 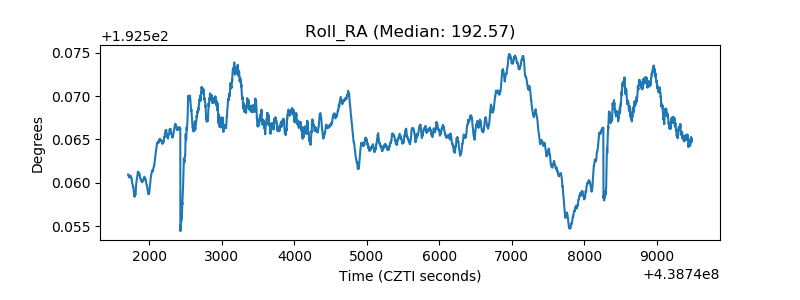 |
| Veto Counter | 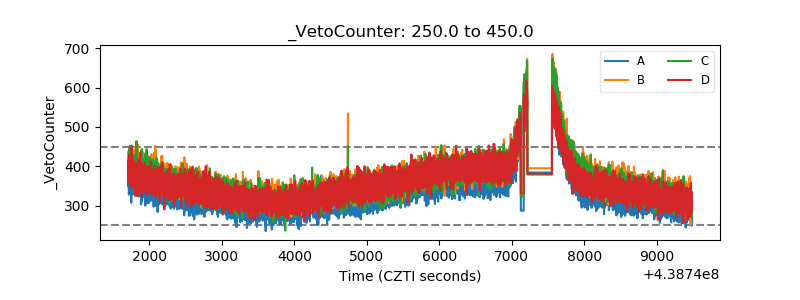 |