| Param | Original file | Final file |
|---|---|---|
| Filename | modeM0/AS1A13_012T02_9000005950_44146cztM0_level2.fits | modeM0/AS1A13_012T02_9000005950_44146cztM0_level2_quad_clean.evt |
| Size (bytes) | 481,512,960 | 123,733,440 |
| Size | 459.2 MB | 118.0 MB |
| Events in quadrant A | 4,878,509 | 825,642 |
| Events in quadrant B | 3,882,418 | 844,007 |
| Events in quadrant C | 3,464,882 | 812,762 |
| Events in quadrant D | 4,993,053 | 722,303 |
| Mode SS | |||
|---|---|---|---|
| Quadrant | BADHDUFLAG | Total packets | Discarded packets |
| A | 0 | 156 | 0 |
| B | 0 | 156 | 0 |
| C | 0 | 156 | 0 |
| D | 0 | 156 | 0 |
| Mode M0 | |||
|---|---|---|---|
| Quadrant | BADHDUFLAG | Total packets | Discarded packets |
| A | 0 | 19805 | 1 |
| B | 0 | 17136 | 0 |
| C | 0 | 16220 | 0 |
| D | 0 | 20473 | 0 |
| Quadrant | Total seconds | Saturated seconds | Saturation percentage |
|---|---|---|---|
| A | 7790 | 55 | 0.706033% |
| B | 7790 | 113 | 1.450578% |
| C | 7790 | 16 | 0.205392% |
| D | 7790 | 282 | 3.620026% |
Noise dominated data is calculated using 1-second bins in cleaned event files. If a bin has >2000 counts, and if more than 50% of those come from <1% of pixels, then it is considered to be noise-dominated and hence unusable.
| Quadrant | # 1 sec bins | Bins with >0 counts | Bins with >2000 counts | High rate bins dominated by noise | Noise dominated (total time) | Noise dominated (detector-on time) | Marked lightcurve |
|---|---|---|---|---|---|---|---|
| A | 7790 | 7790 | 6 | 6 | 0.08% | 0.08% | 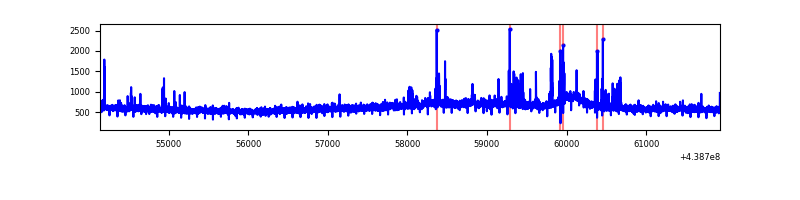 |
| B | 7790 | 7790 | 62 | 62 | 0.80% | 0.80% | 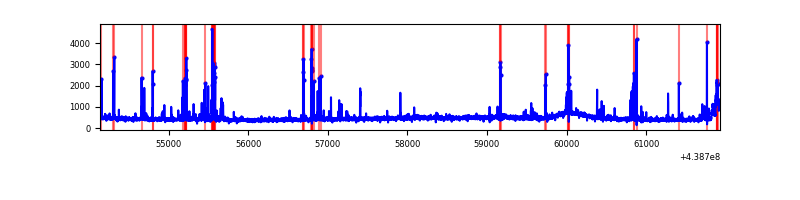 |
| C | 7790 | 7790 | 7 | 7 | 0.09% | 0.09% | 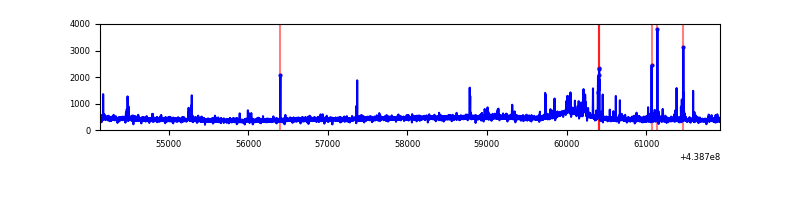 |
| D | 7790 | 7790 | 260 | 260 | 3.34% | 3.34% | 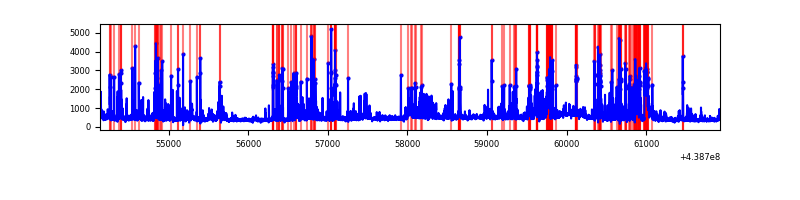 |
Top three noisy pixels from each quadrant. If the there are fewer than three noisy pixels in the level2.evt file, extra rows are filled as -1
| Pixel properties | Quadrant properties | ||||||
|---|---|---|---|---|---|---|---|
| Quadrant | DetID | PixID | Counts | Sigma | Mean | Median | Sigma |
| A | 10 | 83 | 1286233 | 7103.46 | 857 | 838 | 181.0 |
| A | 15 | 223 | 237051 | 1305.38 | 857 | 838 | 181.0 |
| A | 7 | 3 | 22104 | 117.52 | 857 | 838 | 181.0 |
| B | 5 | 172 | 235466 | 1388.9 | 855 | 828 | 168.9 |
| B | 0 | 189 | 152615 | 898.48 | 855 | 828 | 168.9 |
| B | 0 | 200 | 82827 | 485.38 | 855 | 828 | 168.9 |
| C | 14 | 254 | 88250 | 440.44 | 837 | 844 | 198.4 |
| C | 12 | 16 | 62876 | 312.58 | 837 | 844 | 198.4 |
| C | 1 | 241 | 22058 | 106.9 | 837 | 844 | 198.4 |
| D | 2 | 249 | 472167 | 2247.09 | 821 | 794 | 209.8 |
| D | 4 | 235 | 392070 | 1865.26 | 821 | 794 | 209.8 |
| D | 13 | 249 | 248147 | 1179.16 | 821 | 794 | 209.8 |
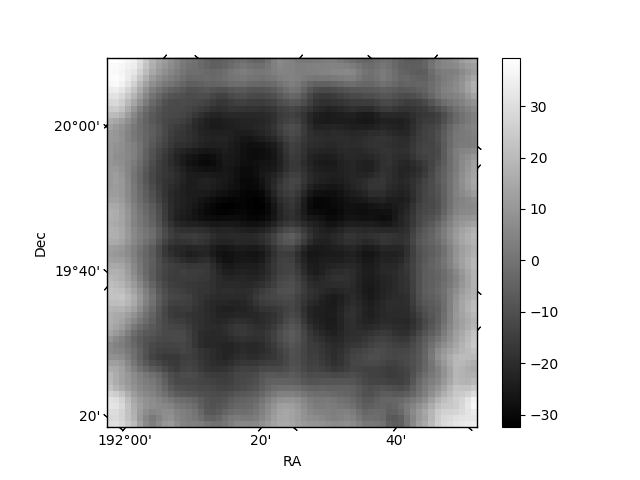
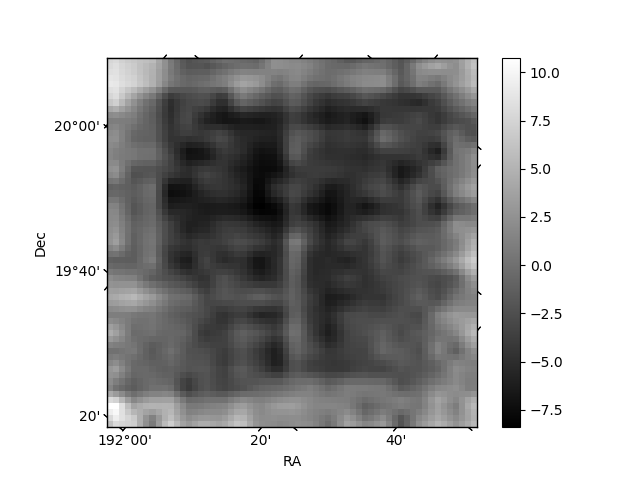
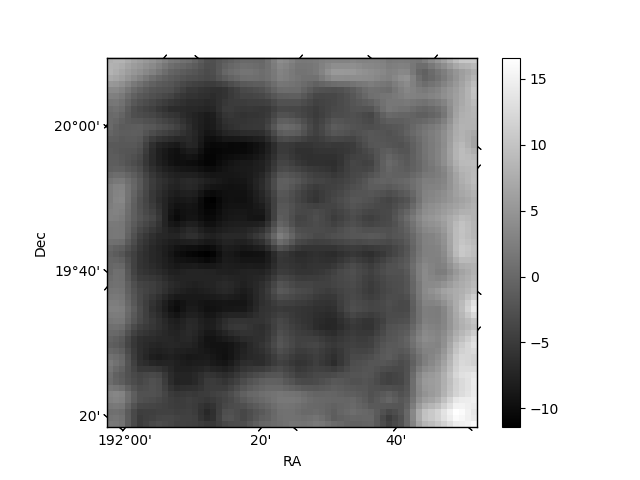
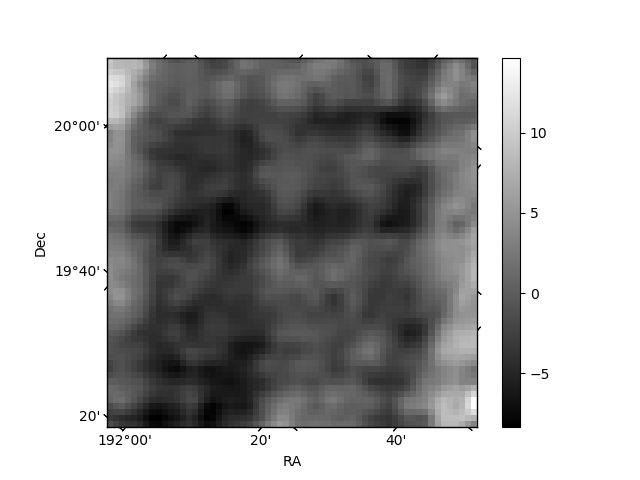
Histogram calculated using DETX and DETY for each event in the final _common_clean file
| Quadrant A | 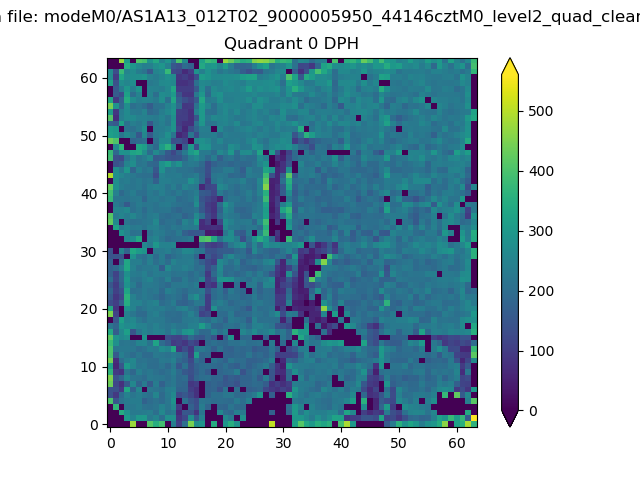 |
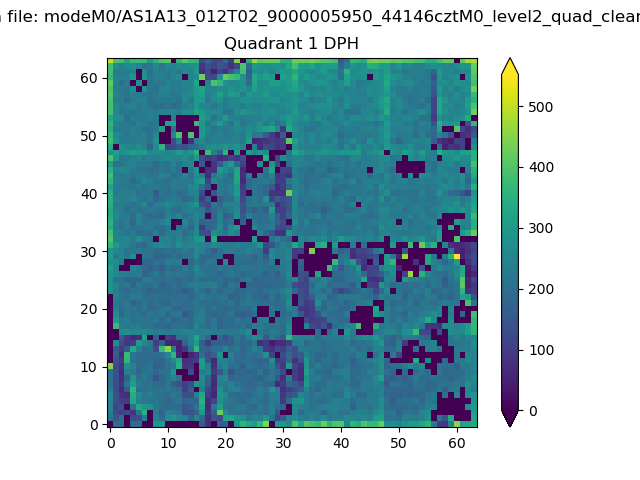 |
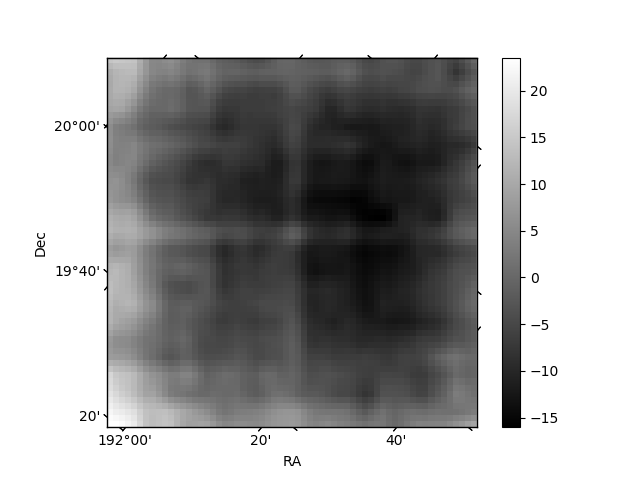
Quadrant B |
|---|---|---|---|
| Quadrant D | 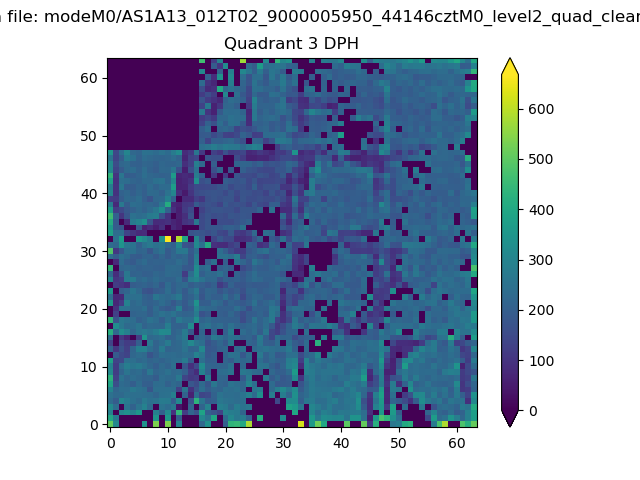 |
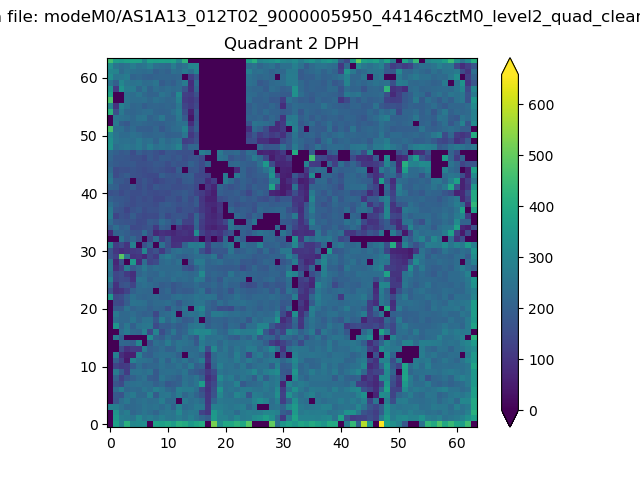 |
Quadrant C |
| Plot type | Count rate plots | Images |
|---|---|---|
| Comparison with Poisson distribution Blue bars denote a histogram of data divided into 1 sec bins. Red curve is a Poisson curve with rate = median count rate of data. |
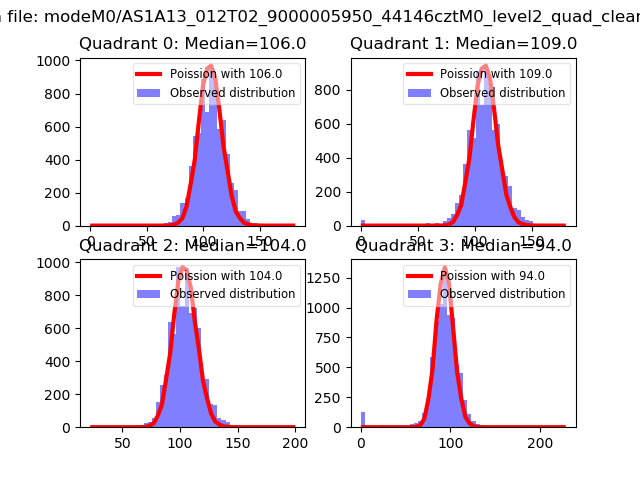 |
 |
| Quadrant-wise count rates Data is divided into 100 sec bins |
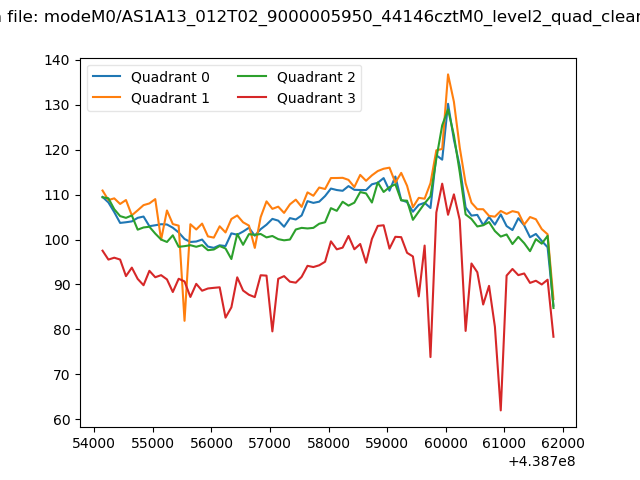 |
|
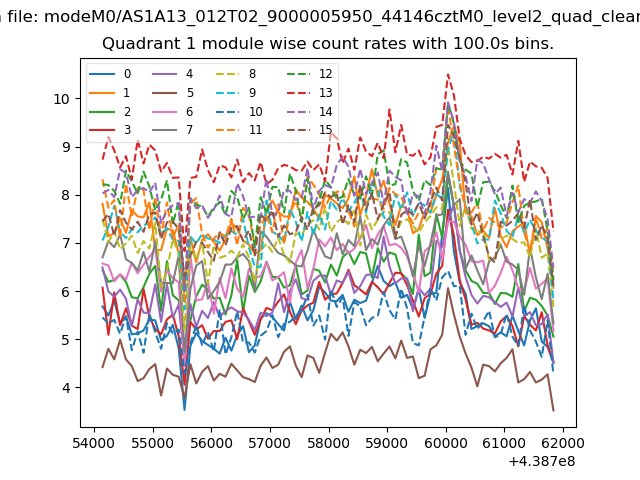
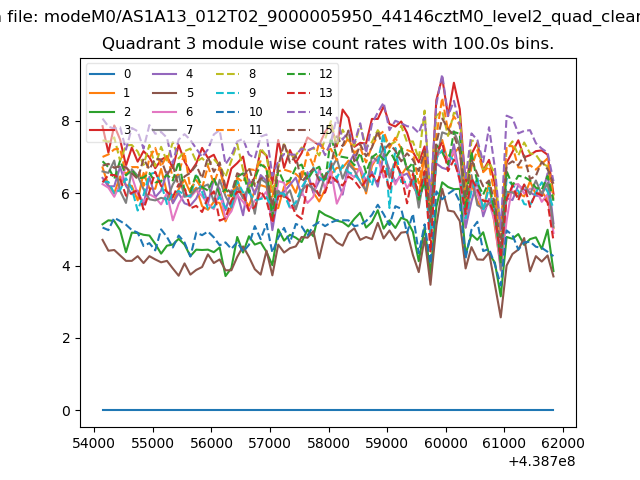
| Module-wise count rates for Quadrant A Data is divided into 100 sec bins |
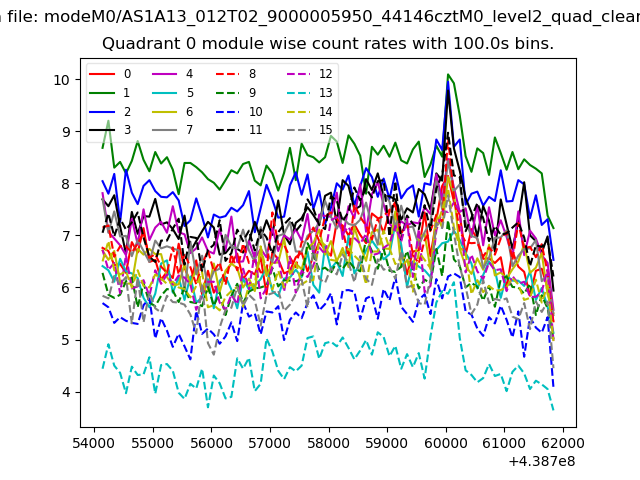 |
 |
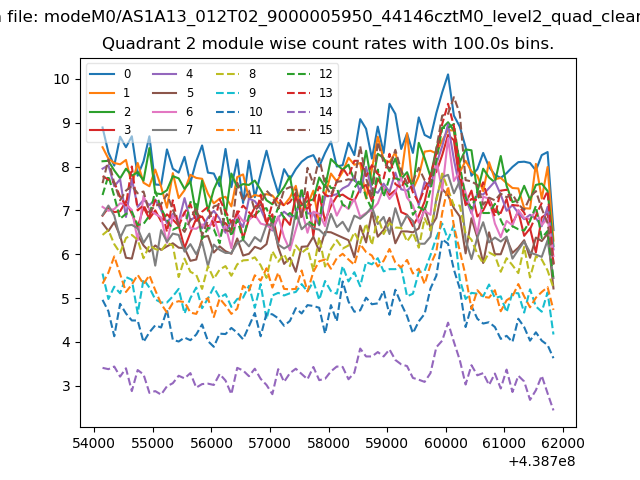
| Module-wise count rates for Quadrant B Data is divided into 100 sec bins |
 |
 |
| Module-wise count rates for Quadrant C Data is divided into 100 sec bins |
 |
 |
| Module-wise count rates for Quadrant D Data is divided into 100 sec bins |
 |
 |
| Parameter | Plot |
|---|---|
| CZT HV Monitor | 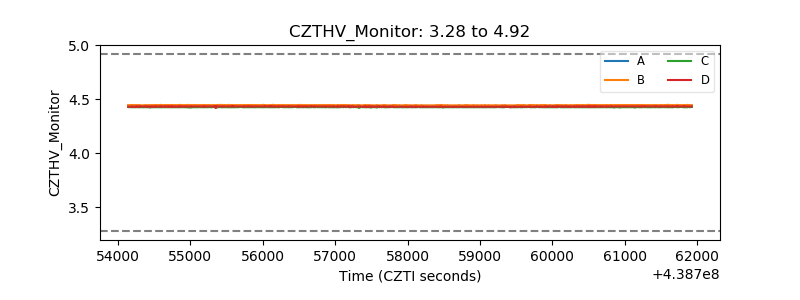 |
| D_VDD | 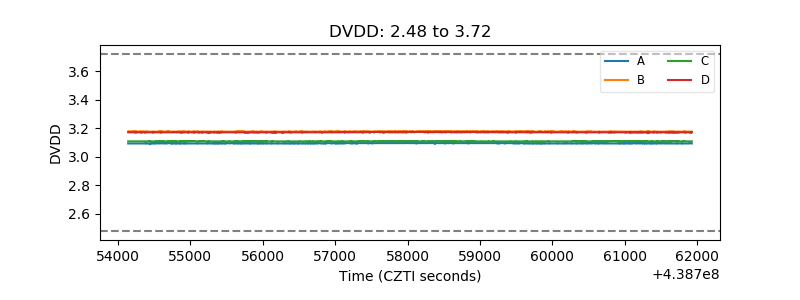 |
| Temperature 1 | 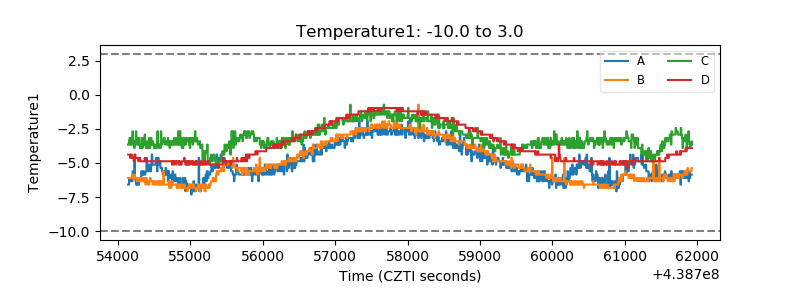 |
| Veto HV Monitor | 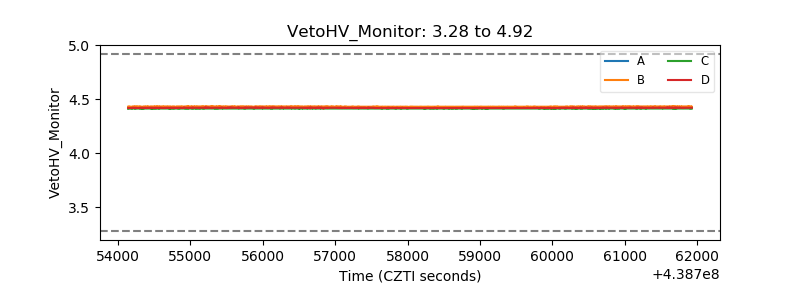 |
| Veto LLD | 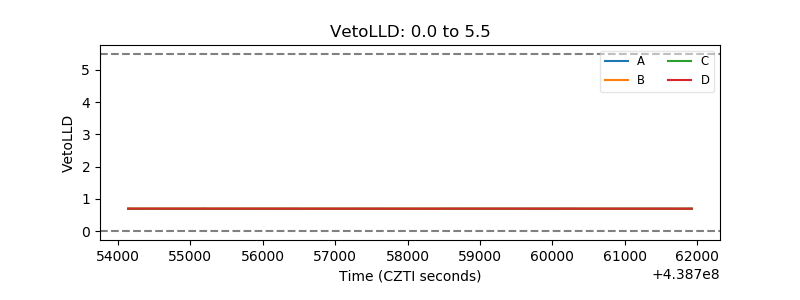 |
| Alpha Counter | 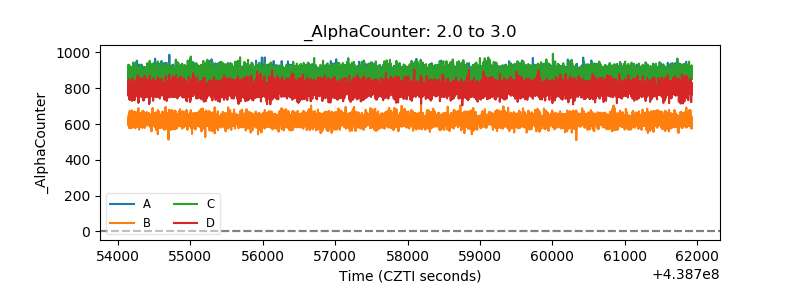 |
| _CPM_Rate | 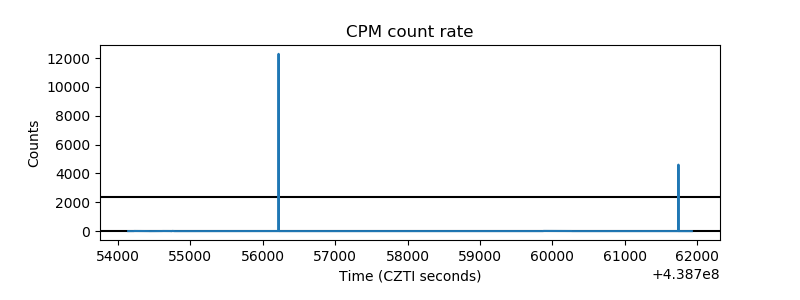 |
| CZT Counter | 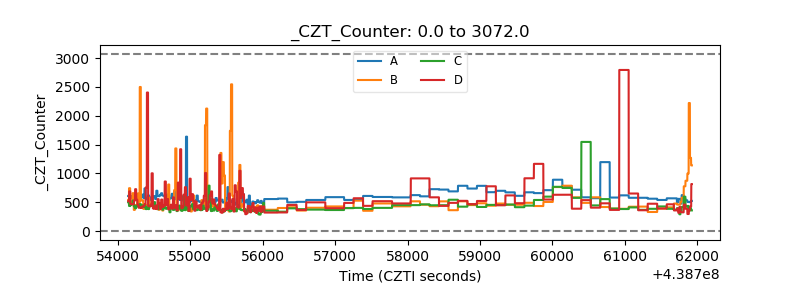 |
| +2.5 Volts monitor | 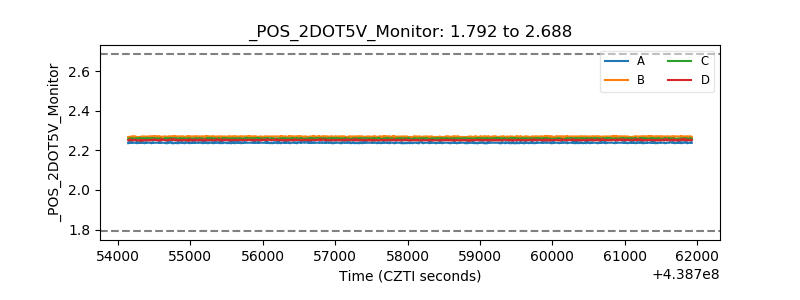 |
| +5 Volts monitor | 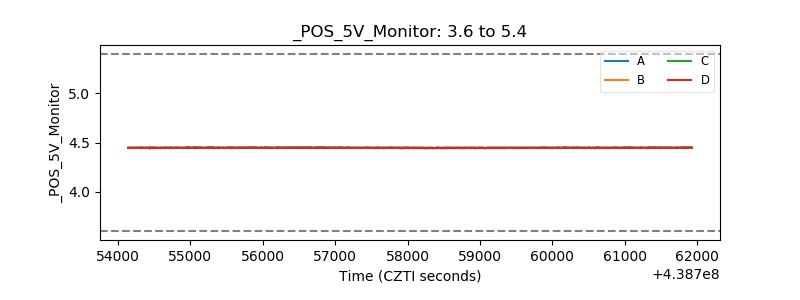 |
| _ROLL_ROT | 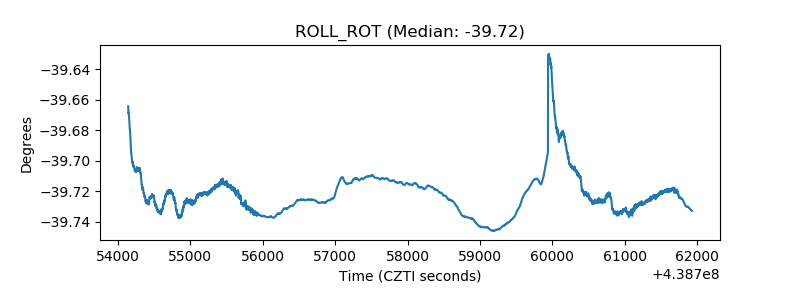 |
| _Roll_DEC | 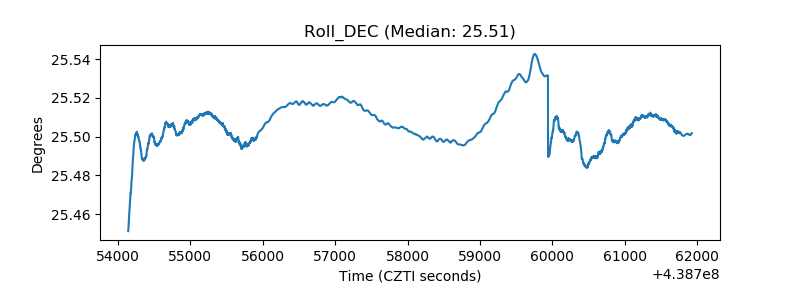 |
| _Roll_RA | 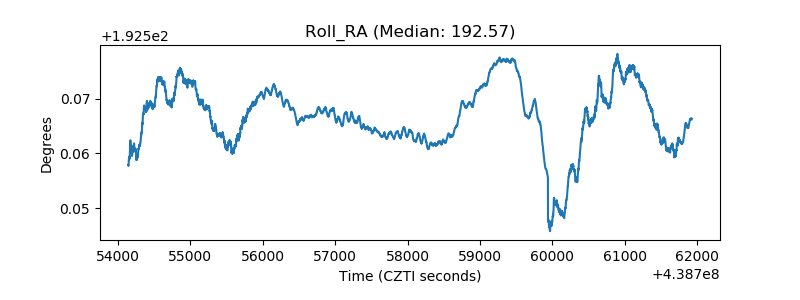 |
| Veto Counter | 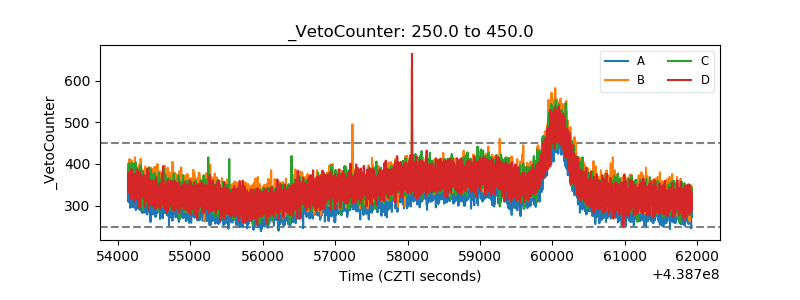 |