| Param | Original file | Final file |
|---|---|---|
| Filename | modeM0/AS1A13_012T02_9000005950_44150cztM0_level2.fits | modeM0/AS1A13_012T02_9000005950_44150cztM0_level2_quad_clean.evt |
| Size (bytes) | 743,947,200 | 174,723,840 |
| Size | 709.5 MB | 166.6 MB |
| Events in quadrant A | 7,488,247 | 1,165,758 |
| Events in quadrant B | 5,958,530 | 1,179,528 |
| Events in quadrant C | 5,381,686 | 1,152,417 |
| Events in quadrant D | 7,844,518 | 1,020,147 |
| Mode M9 | |||
|---|---|---|---|
| Quadrant | BADHDUFLAG | Total packets | Discarded packets |
| A | 0 | 1 | 0 |
| B | 0 | 1 | 0 |
| C | 0 | 1 | 0 |
| D | 0 | 1 | 0 |
| Mode SS | |||
|---|---|---|---|
| Quadrant | BADHDUFLAG | Total packets | Discarded packets |
| A | 0 | 222 | 0 |
| B | 0 | 222 | 0 |
| C | 0 | 222 | 0 |
| D | 0 | 222 | 0 |
| Mode M0 | |||
|---|---|---|---|
| Quadrant | BADHDUFLAG | Total packets | Discarded packets |
| A | 0 | 30194 | 1 |
| B | 0 | 25499 | 1 |
| C | 0 | 24180 | 1 |
| D | 0 | 31436 | 1 |
| Quadrant | Total seconds | Saturated seconds | Saturation percentage |
|---|---|---|---|
| A | 11166 | 196 | 1.755329% |
| B | 11167 | 422 | 3.778992% |
| C | 11167 | 83 | 0.743261% |
| D | 11167 | 590 | 5.283424% |
Noise dominated data is calculated using 1-second bins in cleaned event files. If a bin has >2000 counts, and if more than 50% of those come from <1% of pixels, then it is considered to be noise-dominated and hence unusable.
| Quadrant | # 1 sec bins | Bins with >0 counts | Bins with >2000 counts | High rate bins dominated by noise | Noise dominated (total time) | Noise dominated (detector-on time) | Marked lightcurve |
|---|---|---|---|---|---|---|---|
| A | 11181 | 11167 | 35 | 35 | 0.31% | 0.31% |  |
| B | 11182 | 11168 | 174 | 174 | 1.56% | 1.56% | 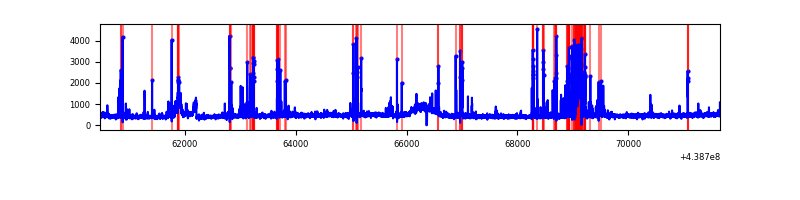 |
| C | 11182 | 11168 | 20 | 20 | 0.18% | 0.18% | 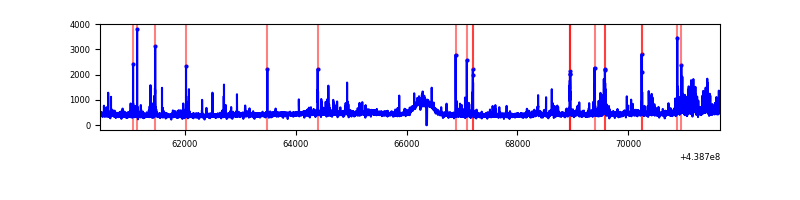 |
| D | 11182 | 11168 | 427 | 427 | 3.82% | 3.82% | 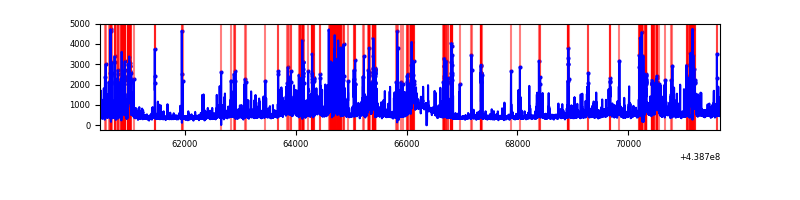 |
Top three noisy pixels from each quadrant. If the there are fewer than three noisy pixels in the level2.evt file, extra rows are filled as -1
| Pixel properties | Quadrant properties | ||||||
|---|---|---|---|---|---|---|---|
| Quadrant | DetID | PixID | Counts | Sigma | Mean | Median | Sigma |
| A | 10 | 83 | 1878762 | 7180.85 | 1247 | 1221 | 261.5 |
| A | 15 | 223 | 774250 | 2956.53 | 1247 | 1221 | 261.5 |
| A | 3 | 137 | 14382 | 50.34 | 1247 | 1221 | 261.5 |
| B | 5 | 172 | 777373 | 3162.46 | 1229 | 1188 | 245.4 |
| B | 0 | 189 | 249412 | 1011.35 | 1229 | 1188 | 245.4 |
| B | 4 | 173 | 50068 | 199.15 | 1229 | 1188 | 245.4 |
| C | 14 | 254 | 239049 | 828.54 | 1217 | 1223 | 287.0 |
| C | 12 | 16 | 202566 | 701.44 | 1217 | 1223 | 287.0 |
| C | 15 | 158 | 86428 | 296.84 | 1217 | 1223 | 287.0 |
| D | 13 | 171 | 992696 | 3229.79 | 1198 | 1157 | 307.0 |
| D | 4 | 235 | 377827 | 1226.95 | 1198 | 1157 | 307.0 |
| D | 1 | 52 | 361269 | 1173.01 | 1198 | 1157 | 307.0 |
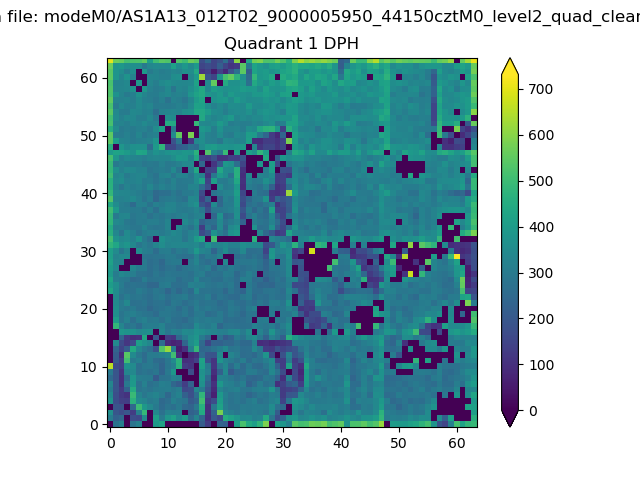
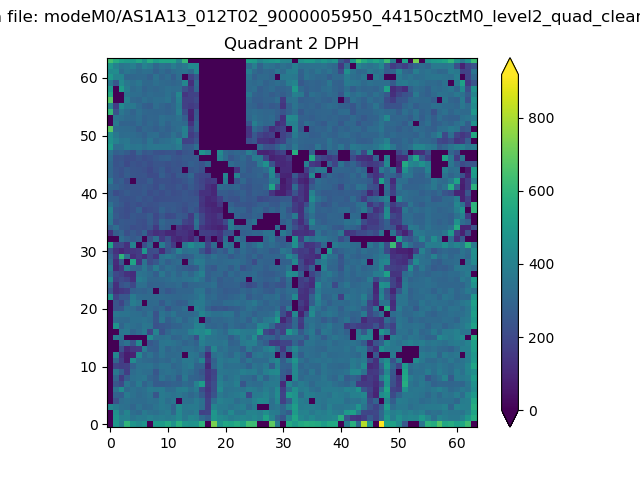
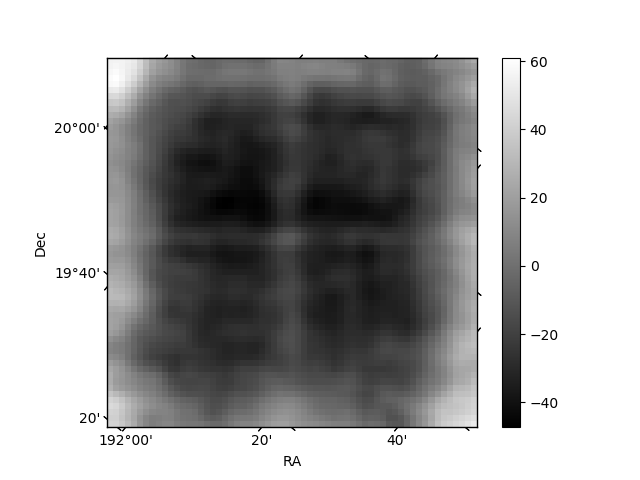
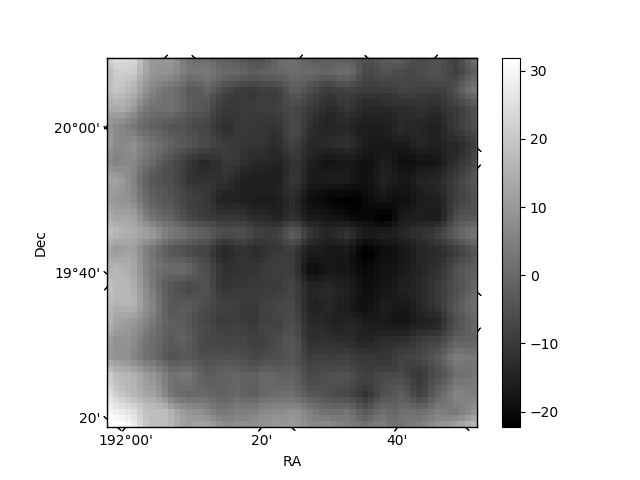
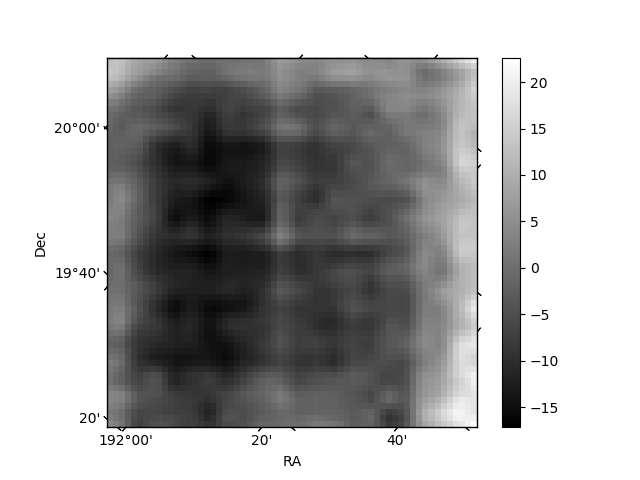
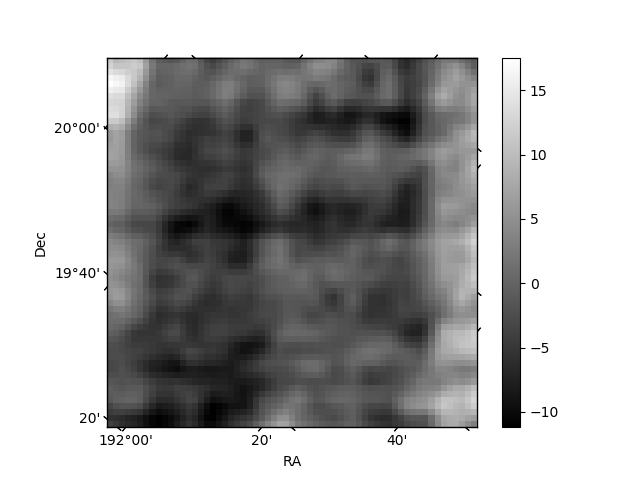
Histogram calculated using DETX and DETY for each event in the final _common_clean file
| Quadrant A | 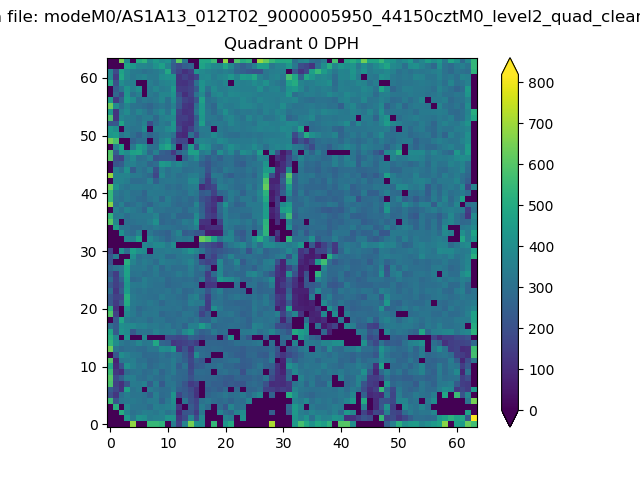 |
 |
Quadrant B |
|---|---|---|---|
| Quadrant D | 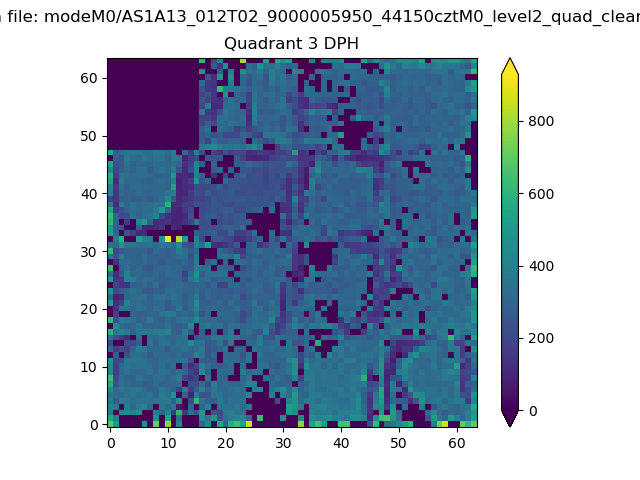 |
 |
Quadrant C |
| Plot type | Count rate plots | Images |
|---|---|---|
| Comparison with Poisson distribution Blue bars denote a histogram of data divided into 1 sec bins. Red curve is a Poisson curve with rate = median count rate of data. |
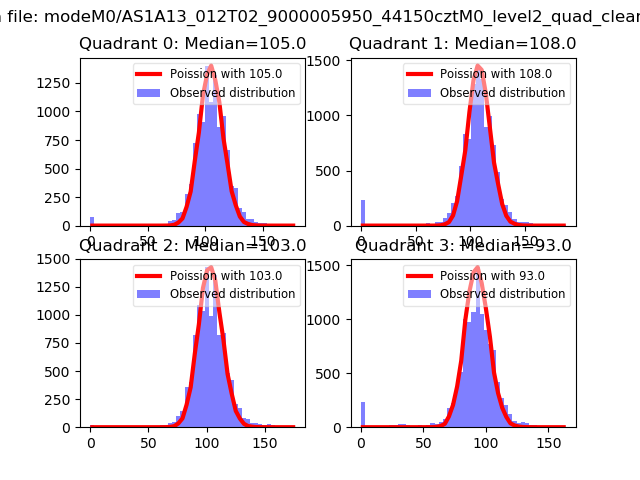 |
 |
| Quadrant-wise count rates Data is divided into 100 sec bins |
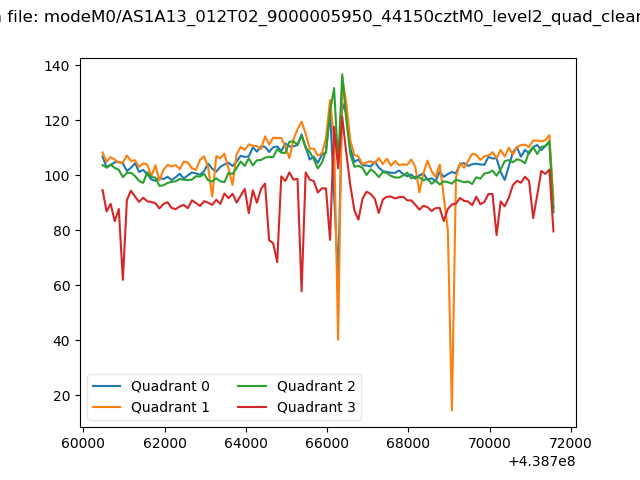 |
|
| Module-wise count rates for Quadrant A Data is divided into 100 sec bins |
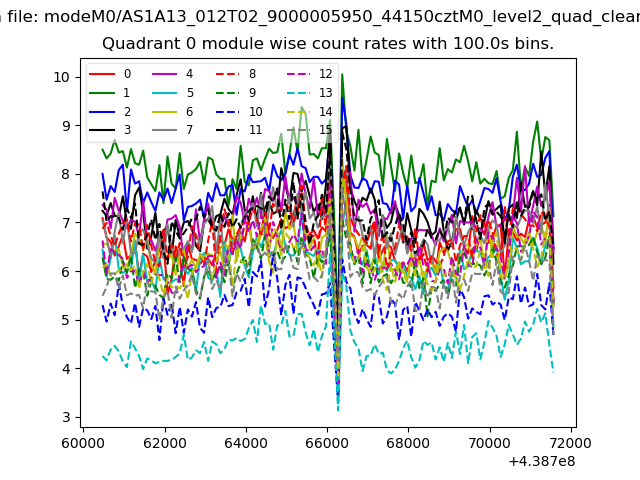 |
 |
| Module-wise count rates for Quadrant B Data is divided into 100 sec bins |
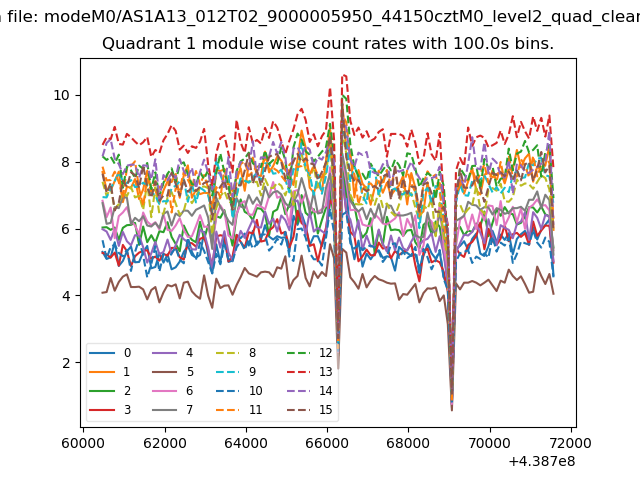 |
 |
| Module-wise count rates for Quadrant C Data is divided into 100 sec bins |
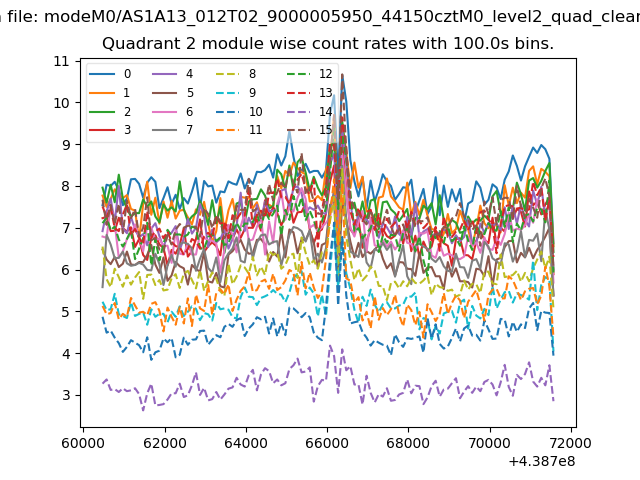 |
 |
| Module-wise count rates for Quadrant D Data is divided into 100 sec bins |
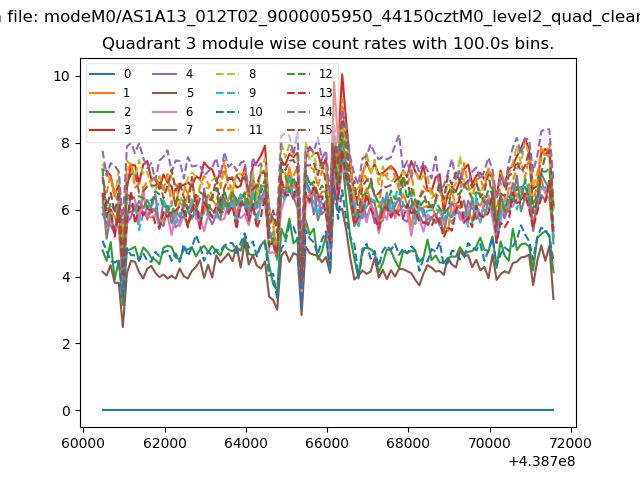 |
 |
| Parameter | Plot |
|---|---|
| CZT HV Monitor | 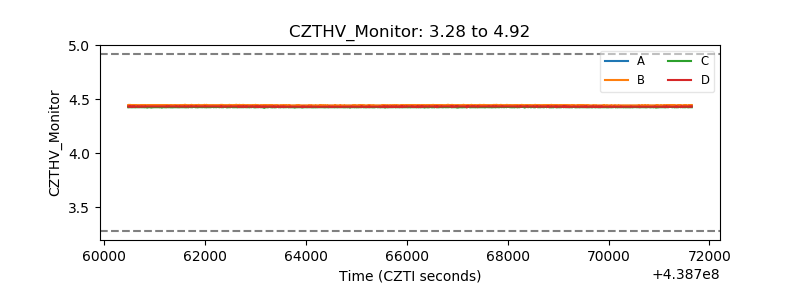 |
| D_VDD | 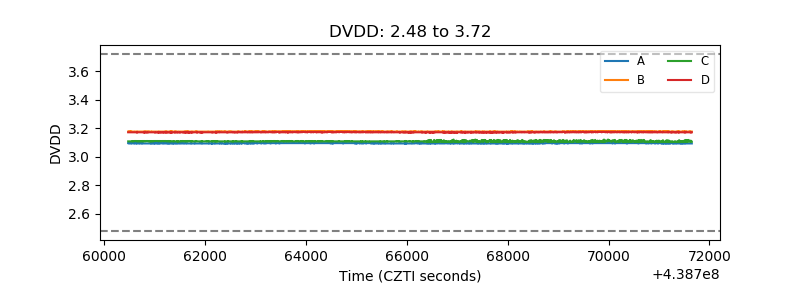 |
| Temperature 1 | 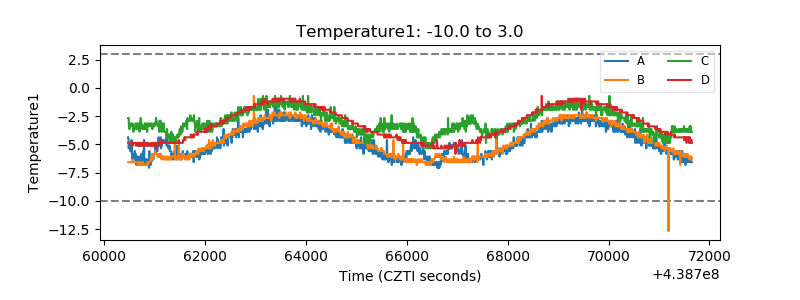 |
| Veto HV Monitor | 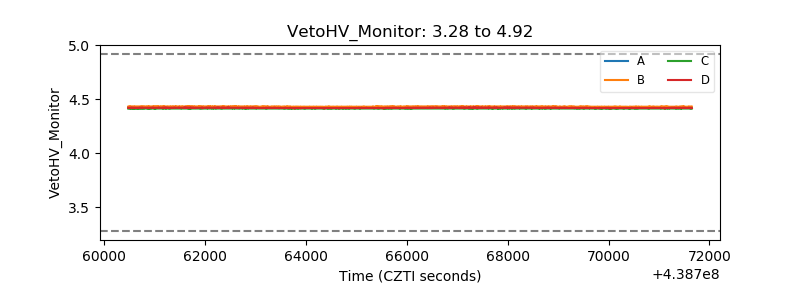 |
| Veto LLD | 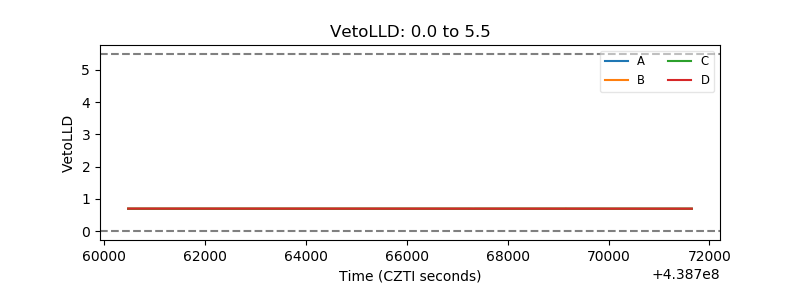 |
| Alpha Counter | 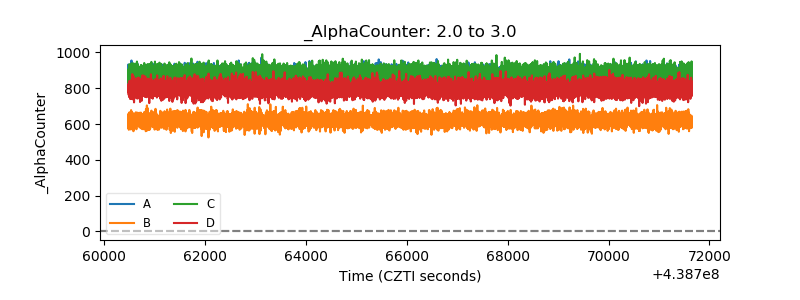 |
| _CPM_Rate | 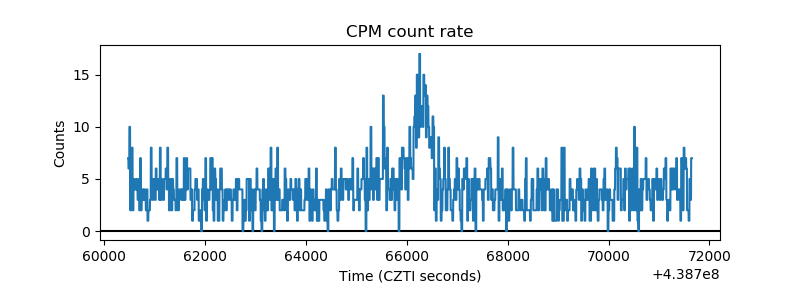 |
| CZT Counter | 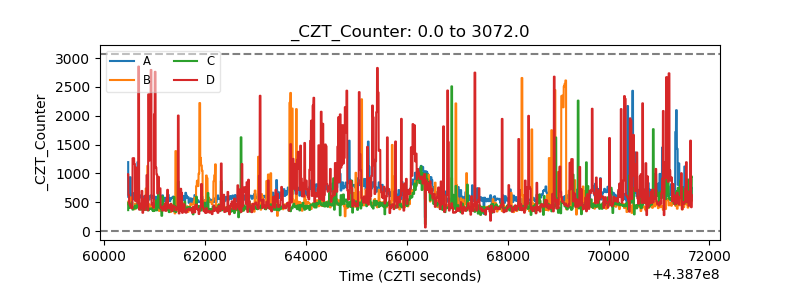 |
| +2.5 Volts monitor | 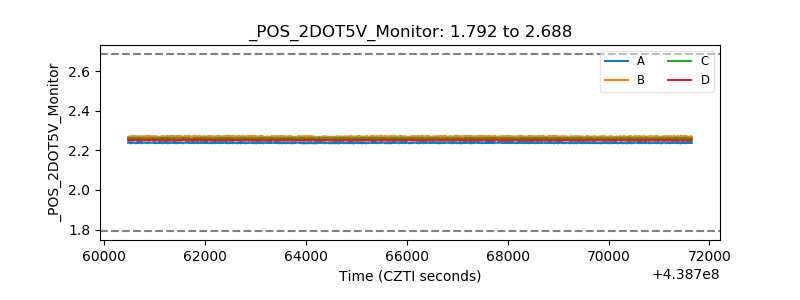 |
| +5 Volts monitor | 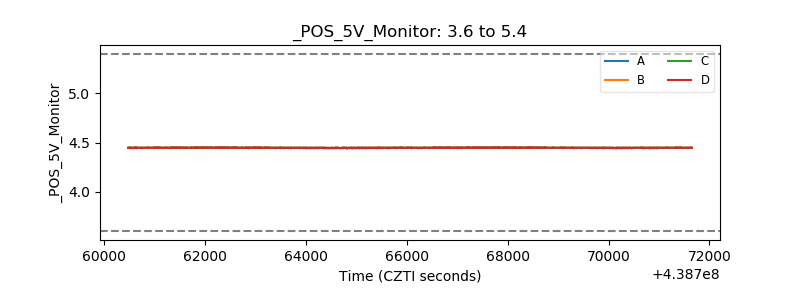 |
| _ROLL_ROT | 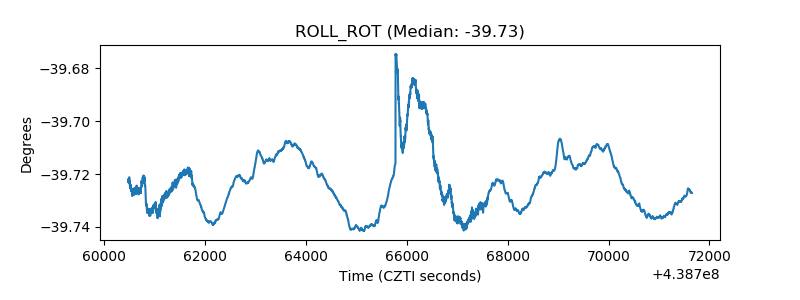 |
| _Roll_DEC | 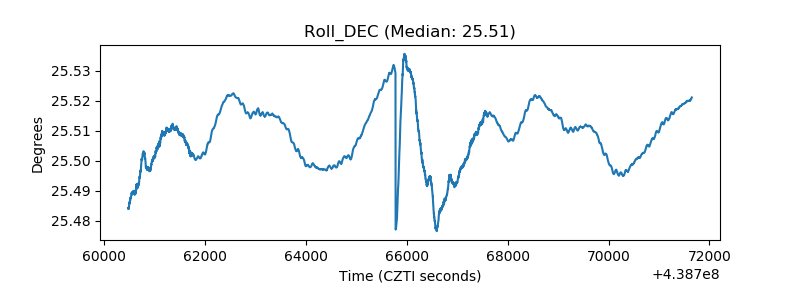 |
| _Roll_RA | 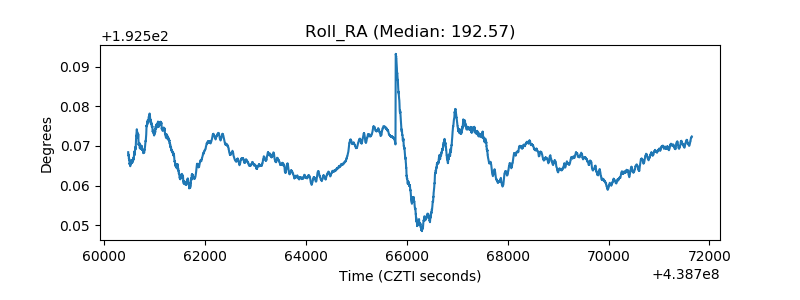 |
| Veto Counter | 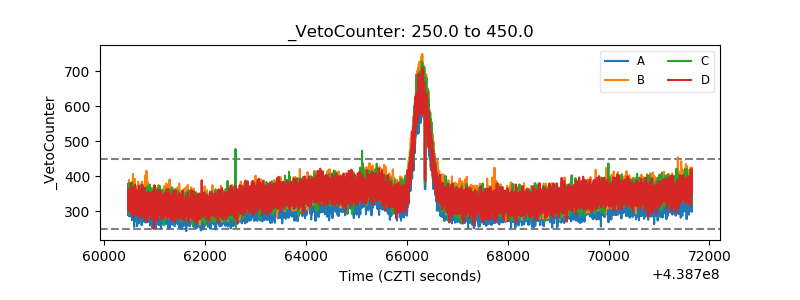 |