| Param | Original file | Final file |
|---|---|---|
| Filename | modeM0/AS1A13_080T05_9000005952_44150cztM0_level2.fits | modeM0/AS1A13_080T05_9000005952_44150cztM0_level2_quad_clean.evt |
| Size (bytes) | 761,374,080 | 123,494,400 |
| Size | 726.1 MB | 117.8 MB |
| Events in quadrant A | 8,327,828 | 777,492 |
| Events in quadrant B | 5,441,968 | 879,549 |
| Events in quadrant C | 7,414,742 | 723,133 |
| Events in quadrant D | 6,341,341 | 769,100 |
| Mode M9 | |||
|---|---|---|---|
| Quadrant | BADHDUFLAG | Total packets | Discarded packets |
| A | 0 | 7 | 0 |
| B | 0 | 7 | 0 |
| C | 0 | 7 | 0 |
| D | 0 | 7 | 0 |
| Mode SS | |||
|---|---|---|---|
| Quadrant | BADHDUFLAG | Total packets | Discarded packets |
| A | 0 | 172 | 0 |
| B | 0 | 172 | 0 |
| C | 0 | 172 | 0 |
| D | 0 | 172 | 0 |
| Mode M0 | |||
|---|---|---|---|
| Quadrant | BADHDUFLAG | Total packets | Discarded packets |
| A | 0 | 31211 | 1 |
| B | 0 | 21948 | 1 |
| C | 0 | 28054 | 1 |
| D | 0 | 24819 | 1 |
| Quadrant | Total seconds | Saturated seconds | Saturation percentage |
|---|---|---|---|
| A | 8486 | 1217 | 14.341268% |
| B | 8486 | 377 | 4.442611% |
| C | 8486 | 1629 | 19.196323% |
| D | 8486 | 552 | 6.504831% |
Noise dominated data is calculated using 1-second bins in cleaned event files. If a bin has >2000 counts, and if more than 50% of those come from <1% of pixels, then it is considered to be noise-dominated and hence unusable.
| Quadrant | # 1 sec bins | Bins with >0 counts | Bins with >2000 counts | High rate bins dominated by noise | Noise dominated (total time) | Noise dominated (detector-on time) | Marked lightcurve |
|---|---|---|---|---|---|---|---|
| A | 9181 | 8487 | 971 | 971 | 10.58% | 11.44% | 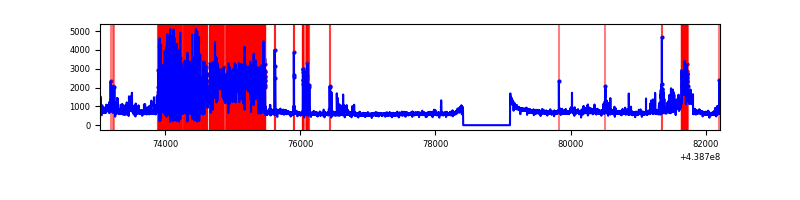 |
| B | 9181 | 8487 | 199 | 199 | 2.17% | 2.34% | 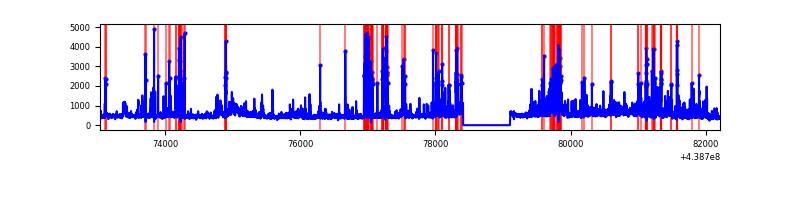 |
| C | 9181 | 8487 | 1137 | 1137 | 12.38% | 13.40% | 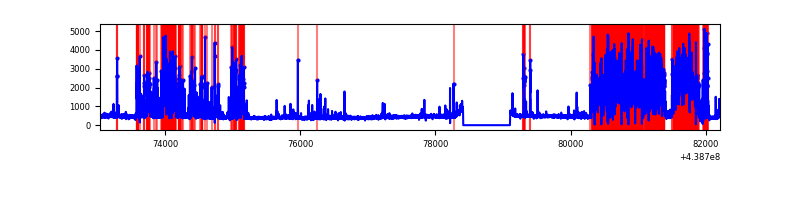 |
| D | 9181 | 8487 | 394 | 394 | 4.29% | 4.64% | 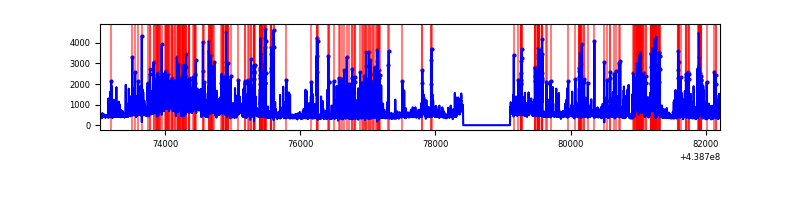 |
Top three noisy pixels from each quadrant. If the there are fewer than three noisy pixels in the level2.evt file, extra rows are filled as -1
| Pixel properties | Quadrant properties | ||||||
|---|---|---|---|---|---|---|---|
| Quadrant | DetID | PixID | Counts | Sigma | Mean | Median | Sigma |
| A | 15 | 223 | 3184168 | 17573.66 | 872 | 854 | 181.1 |
| A | 10 | 83 | 1694441 | 9349.54 | 872 | 854 | 181.1 |
| A | 14 | 238 | 32712 | 175.87 | 872 | 854 | 181.1 |
| B | 5 | 172 | 603994 | 3429.0 | 896 | 871 | 175.9 |
| B | 0 | 189 | 352200 | 1997.44 | 896 | 871 | 175.9 |
| B | 0 | 219 | 280372 | 1589.07 | 896 | 871 | 175.9 |
| C | 15 | 158 | 3093369 | 16774.45 | 783 | 786 | 184.4 |
| C | 12 | 16 | 831627 | 4506.56 | 783 | 786 | 184.4 |
| C | 14 | 254 | 234763 | 1269.11 | 783 | 786 | 184.4 |
| D | 1 | 52 | 1740506 | 7952.21 | 876 | 848 | 218.8 |
| D | 2 | 153 | 164941 | 750.09 | 876 | 848 | 218.8 |
| D | 13 | 249 | 151643 | 689.3 | 876 | 848 | 218.8 |
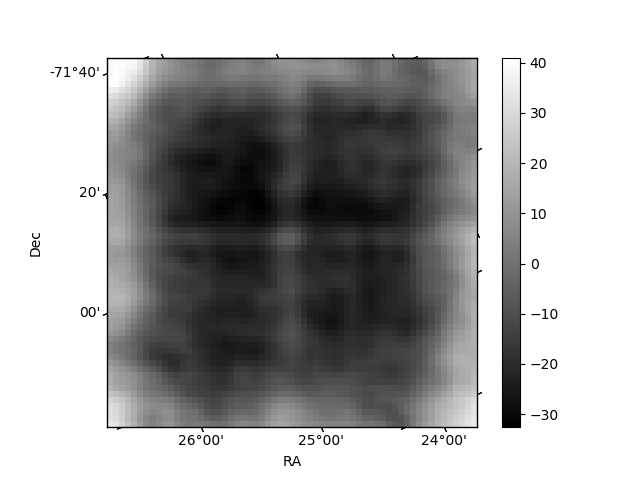
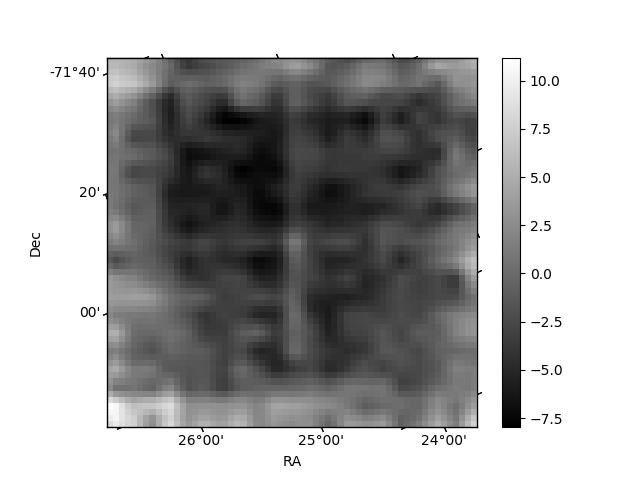
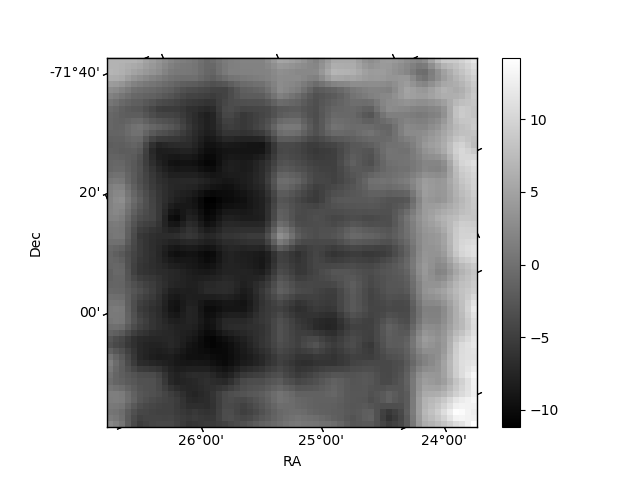
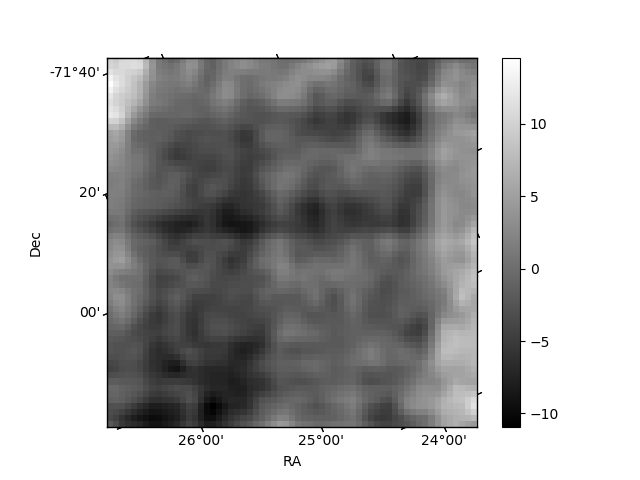
Histogram calculated using DETX and DETY for each event in the final _common_clean file
| Quadrant A | 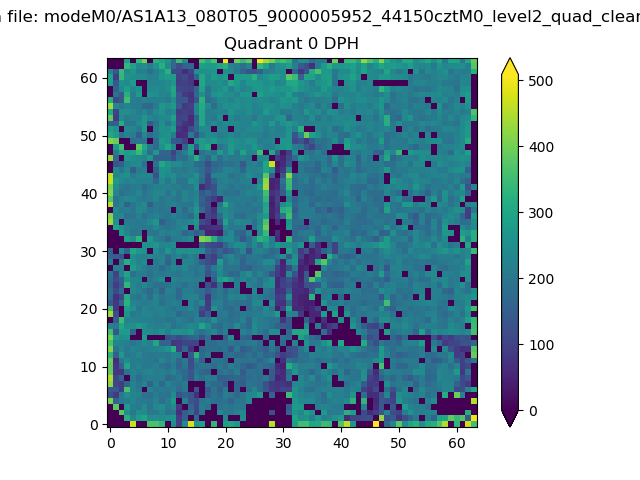 |
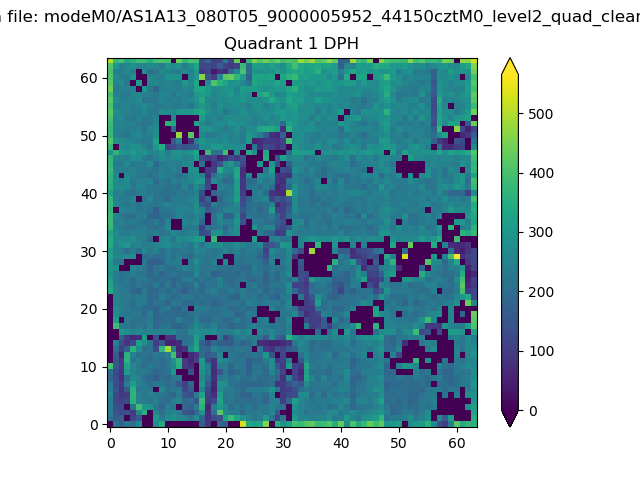 |
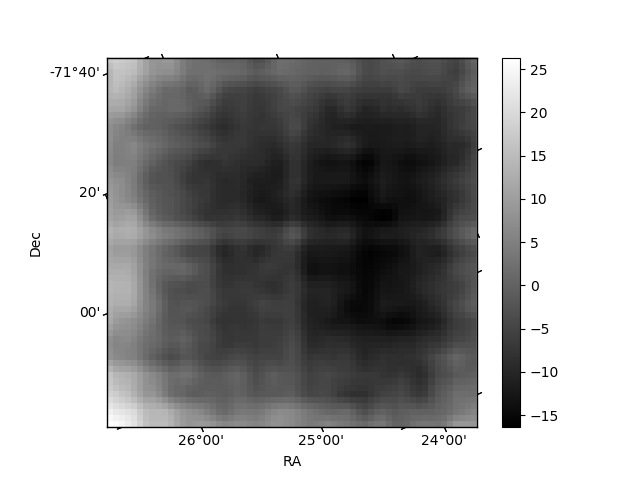
Quadrant B |
|---|---|---|---|
| Quadrant D | 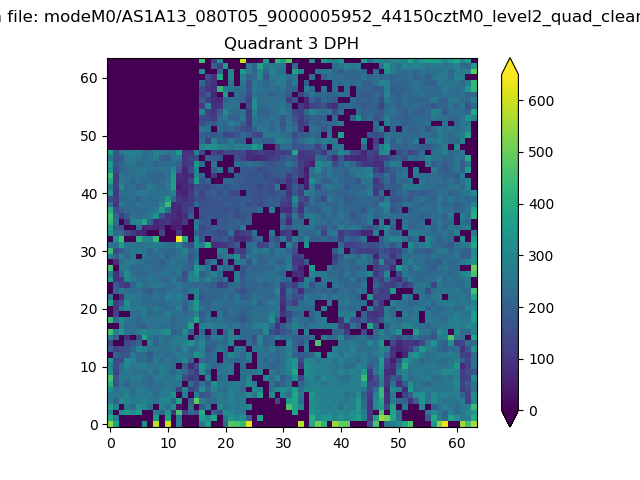 |
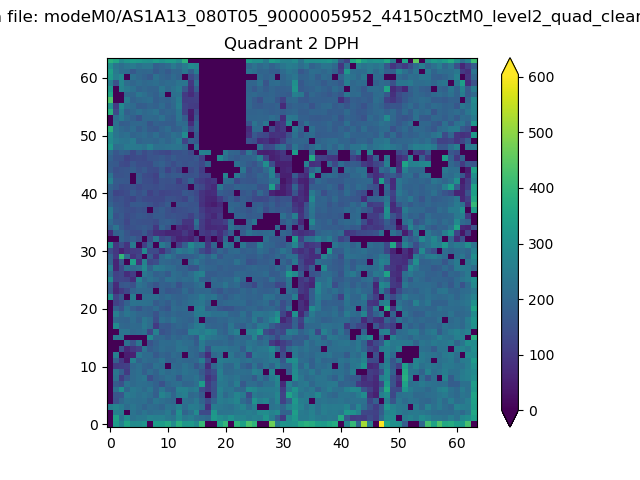 |
Quadrant C |
| Plot type | Count rate plots | Images |
|---|---|---|
| Comparison with Poisson distribution Blue bars denote a histogram of data divided into 1 sec bins. Red curve is a Poisson curve with rate = median count rate of data. |
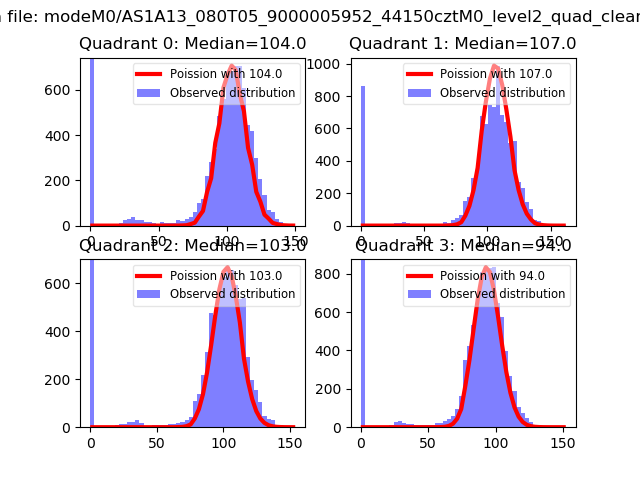 |
 |
| Quadrant-wise count rates Data is divided into 100 sec bins |
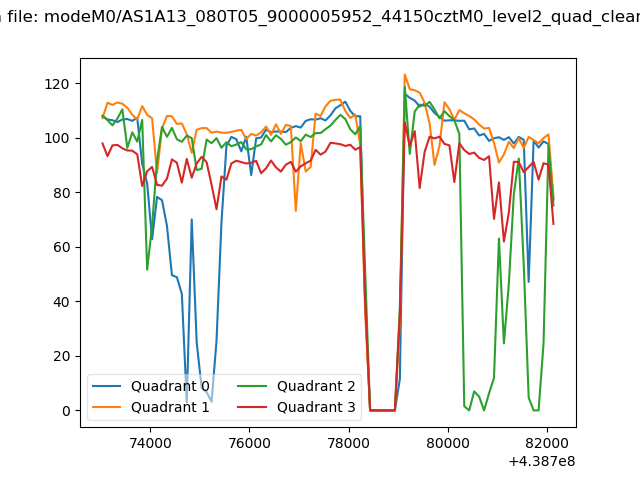 |
|
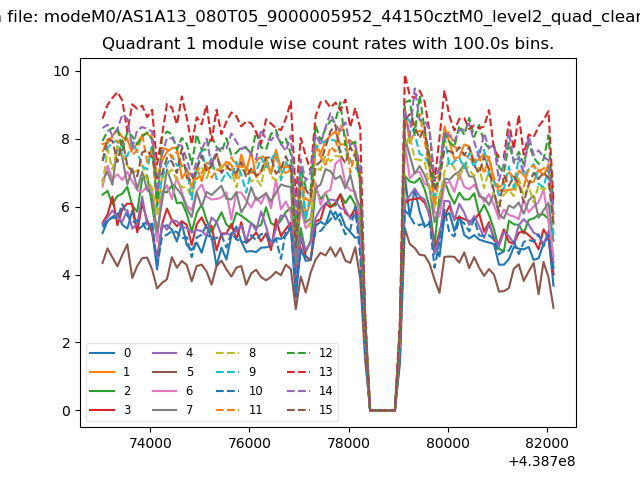
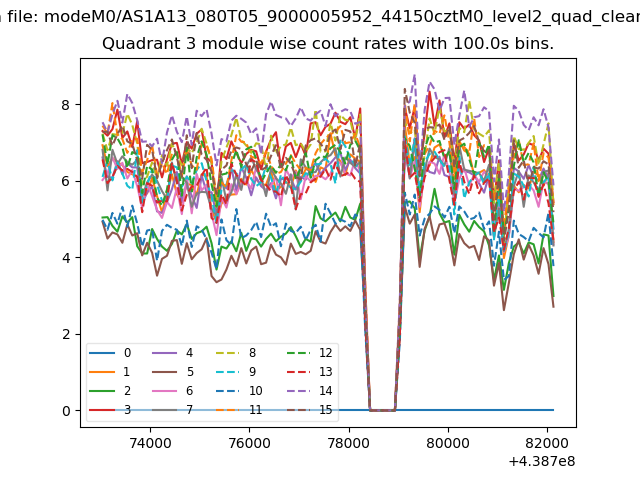
| Module-wise count rates for Quadrant A Data is divided into 100 sec bins |
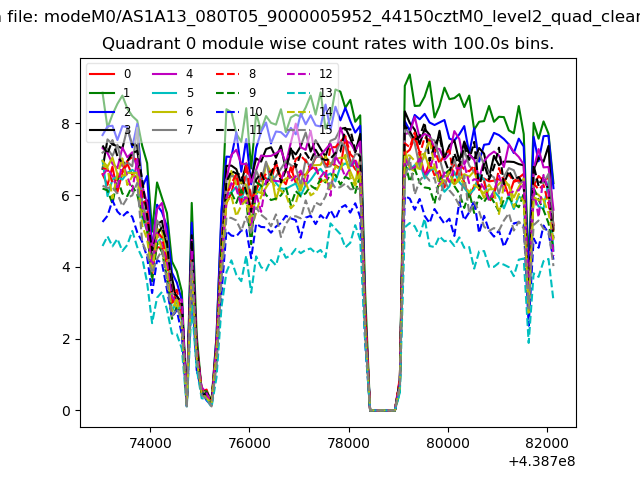 |
 |
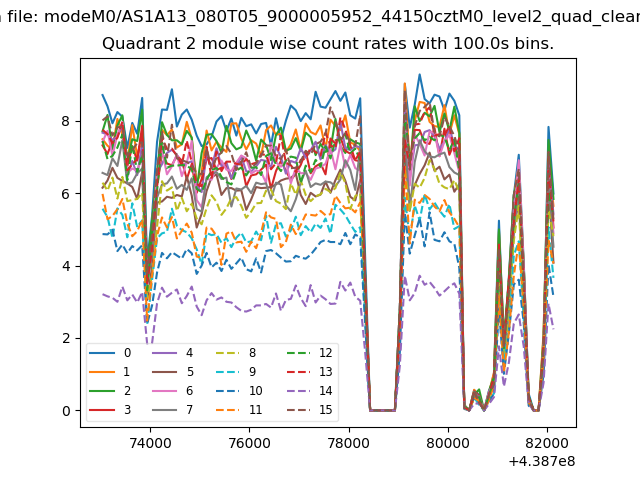
| Module-wise count rates for Quadrant B Data is divided into 100 sec bins |
 |
 |
| Module-wise count rates for Quadrant C Data is divided into 100 sec bins |
 |
 |
| Module-wise count rates for Quadrant D Data is divided into 100 sec bins |
 |
 |
| Parameter | Plot |
|---|---|
| CZT HV Monitor |  |
| D_VDD | 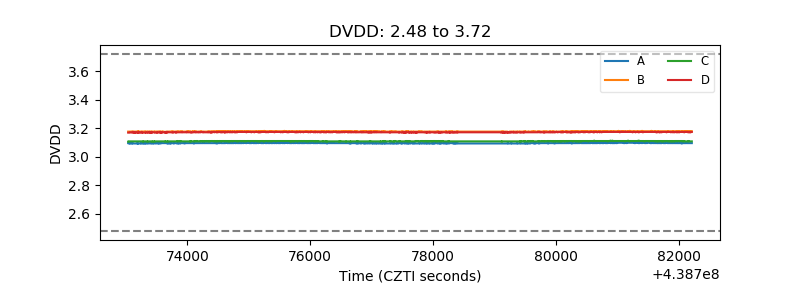 |
| Temperature 1 | 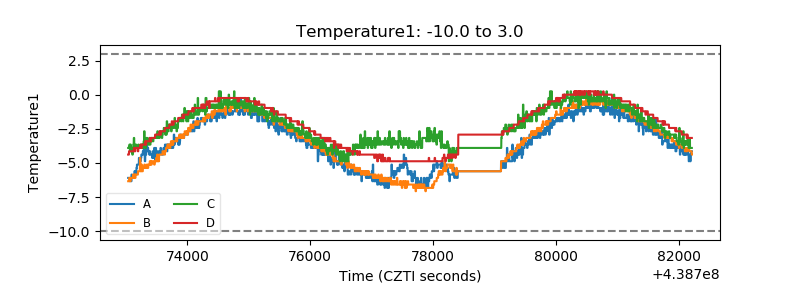 |
| Veto HV Monitor | 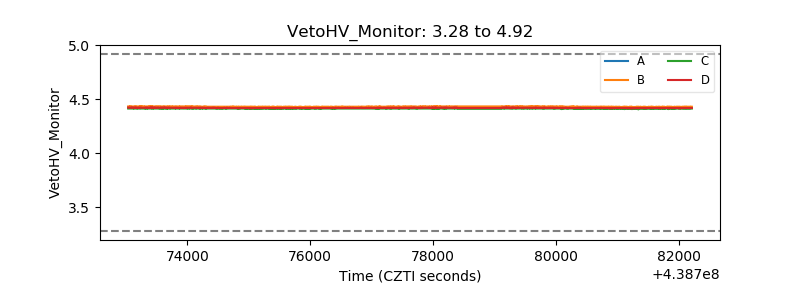 |
| Veto LLD | 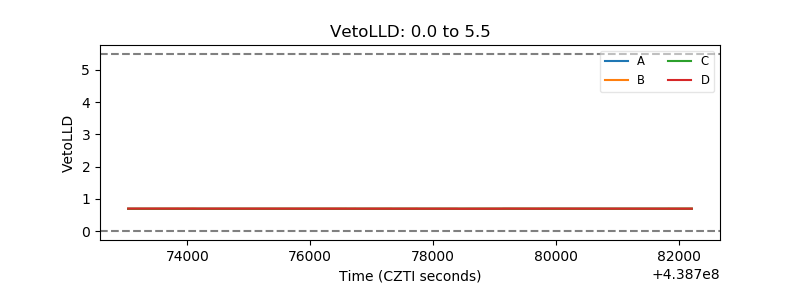 |
| Alpha Counter | 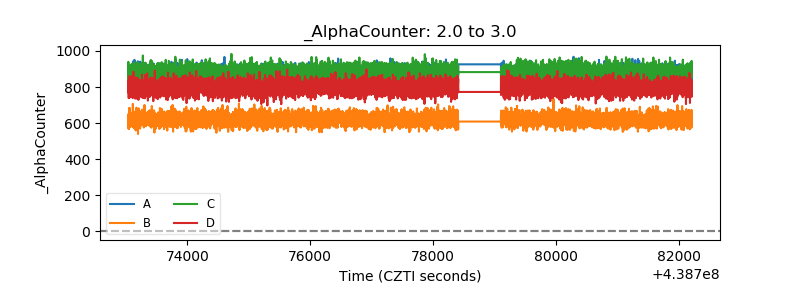 |
| _CPM_Rate | 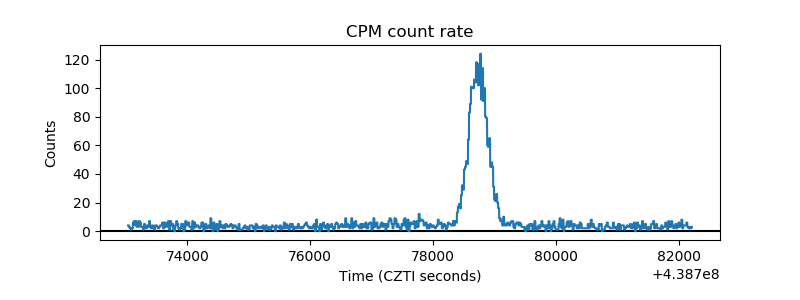 |
| CZT Counter | 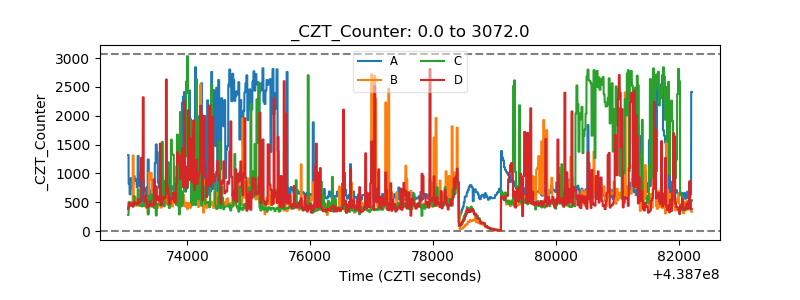 |
| +2.5 Volts monitor | 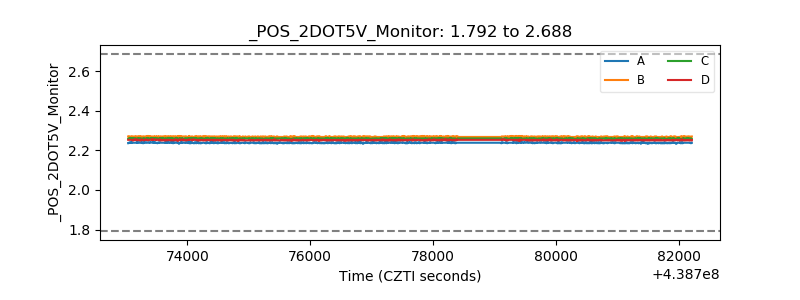 |
| +5 Volts monitor | 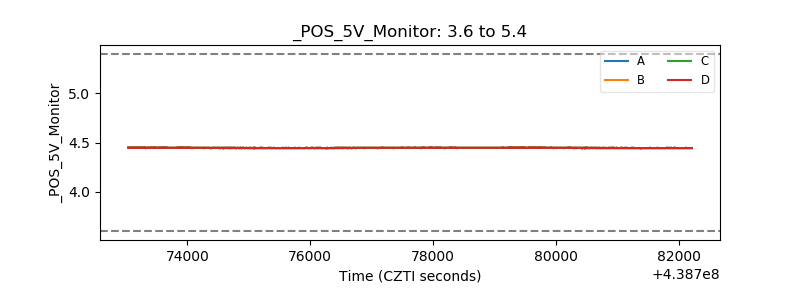 |
| _ROLL_ROT | 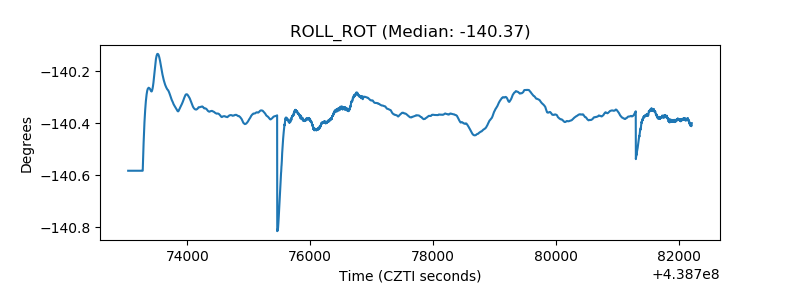 |
| _Roll_DEC | 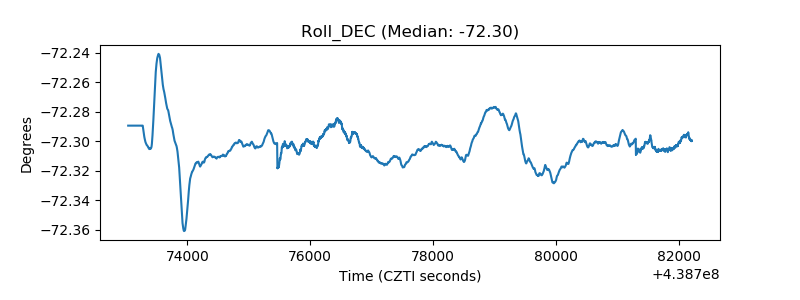 |
| _Roll_RA | 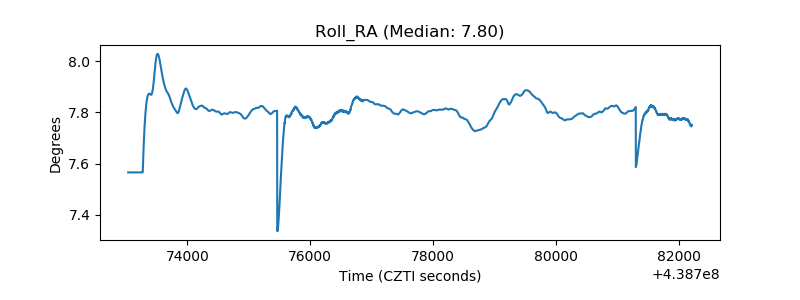 |
| Veto Counter | 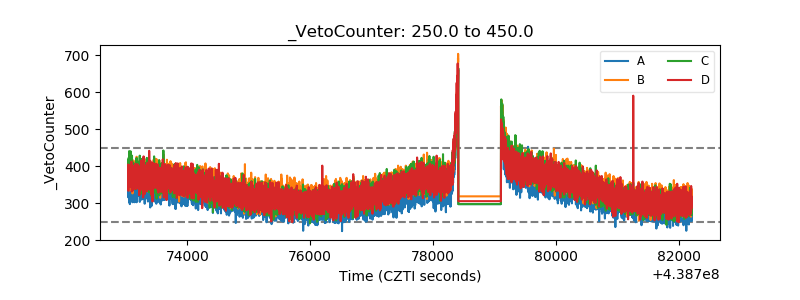 |