| Param | Original file | Final file |
|---|---|---|
| Filename | modeM0/AS1A13_080T05_9000005952_44152cztM0_level2.fits | modeM0/AS1A13_080T05_9000005952_44152cztM0_level2_quad_clean.evt |
| Size (bytes) | 804,931,200 | 157,052,160 |
| Size | 767.6 MB | 149.8 MB |
| Events in quadrant A | 8,165,306 | 1,045,032 |
| Events in quadrant B | 6,167,914 | 1,097,511 |
| Events in quadrant C | 6,340,500 | 998,629 |
| Events in quadrant D | 8,339,316 | 913,444 |
| Mode M9 | |||
|---|---|---|---|
| Quadrant | BADHDUFLAG | Total packets | Discarded packets |
| A | 0 | 20 | 0 |
| B | 0 | 20 | 0 |
| C | 0 | 20 | 0 |
| D | 0 | 20 | 0 |
| Mode SS | |||
|---|---|---|---|
| Quadrant | BADHDUFLAG | Total packets | Discarded packets |
| A | 0 | 204 | 0 |
| B | 0 | 204 | 0 |
| C | 0 | 204 | 0 |
| D | 0 | 204 | 0 |
| Mode M0 | |||
|---|---|---|---|
| Quadrant | BADHDUFLAG | Total packets | Discarded packets |
| A | 0 | 31645 | 2 |
| B | 0 | 25383 | 2 |
| C | 0 | 25707 | 2 |
| D | 0 | 31979 | 2 |
| Quadrant | Total seconds | Saturated seconds | Saturation percentage |
|---|---|---|---|
| A | 10111 | 581 | 5.746217% |
| B | 10112 | 292 | 2.887658% |
| C | 10112 | 681 | 6.734573% |
| D | 10112 | 845 | 8.356408% |
Noise dominated data is calculated using 1-second bins in cleaned event files. If a bin has >2000 counts, and if more than 50% of those come from <1% of pixels, then it is considered to be noise-dominated and hence unusable.
| Quadrant | # 1 sec bins | Bins with >0 counts | Bins with >2000 counts | High rate bins dominated by noise | Noise dominated (total time) | Noise dominated (detector-on time) | Marked lightcurve |
|---|---|---|---|---|---|---|---|
| A | 12001 | 10113 | 341 | 341 | 2.84% | 3.37% | 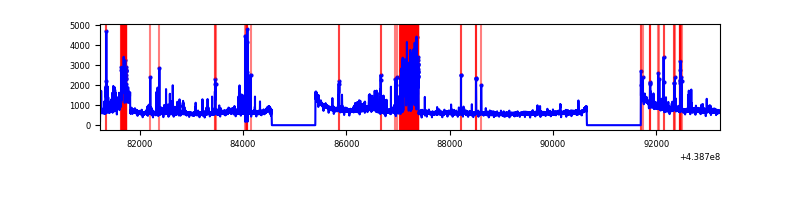 |
| B | 12002 | 10114 | 91 | 91 | 0.76% | 0.90% | 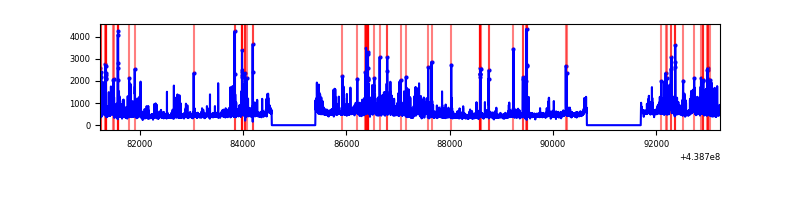 |
| C | 12002 | 10114 | 425 | 425 | 3.54% | 4.20% | 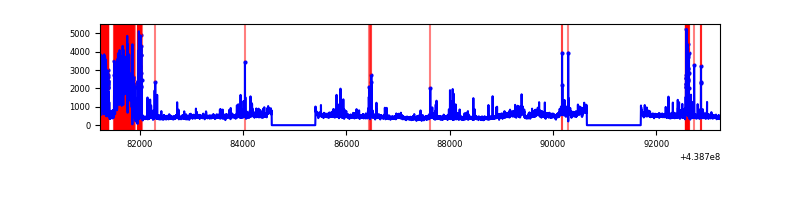 |
| D | 12002 | 10114 | 639 | 639 | 5.32% | 6.32% | 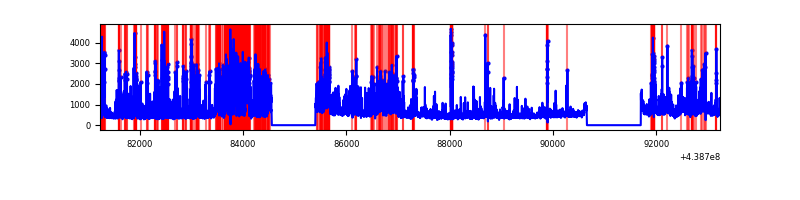 |
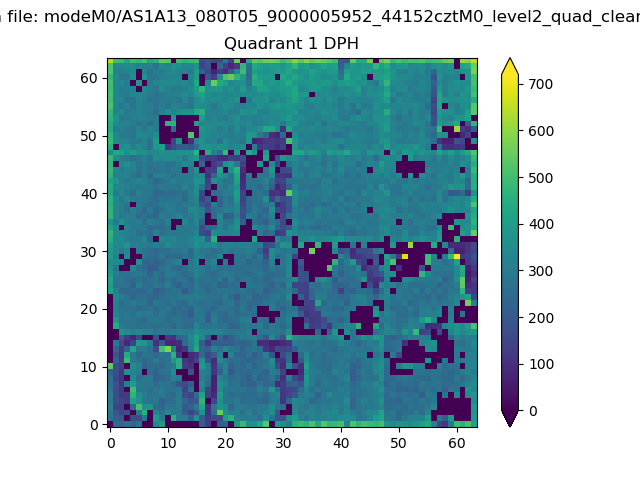
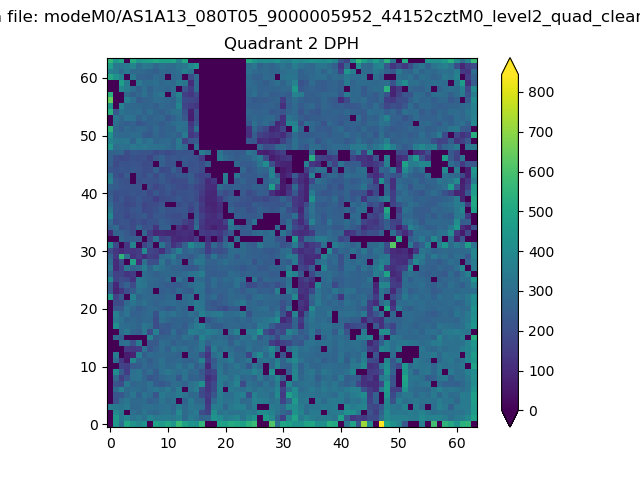
Top three noisy pixels from each quadrant. If the there are fewer than three noisy pixels in the level2.evt file, extra rows are filled as -1
| Pixel properties | Quadrant properties | ||||||
|---|---|---|---|---|---|---|---|
| Quadrant | DetID | PixID | Counts | Sigma | Mean | Median | Sigma |
| A | 10 | 83 | 2301783 | 10208.82 | 1092 | 1069 | 225.4 |
| A | 15 | 223 | 1399521 | 6205.27 | 1092 | 1069 | 225.4 |
| A | 14 | 238 | 89301 | 391.51 | 1092 | 1069 | 225.4 |
| B | 0 | 200 | 470090 | 2195.49 | 1103 | 1070 | 213.6 |
| B | 15 | 36 | 238396 | 1110.93 | 1103 | 1070 | 213.6 |
| B | 0 | 219 | 234986 | 1094.96 | 1103 | 1070 | 213.6 |
| C | 15 | 158 | 1277268 | 5281.02 | 1039 | 1043 | 241.7 |
| C | 3 | 233 | 536239 | 2214.64 | 1039 | 1043 | 241.7 |
| C | 14 | 254 | 179396 | 738.03 | 1039 | 1043 | 241.7 |
| D | 1 | 52 | 2212998 | 8324.04 | 1047 | 1011 | 265.7 |
| D | 2 | 249 | 681775 | 2561.82 | 1047 | 1011 | 265.7 |
| D | 13 | 171 | 288768 | 1082.87 | 1047 | 1011 | 265.7 |
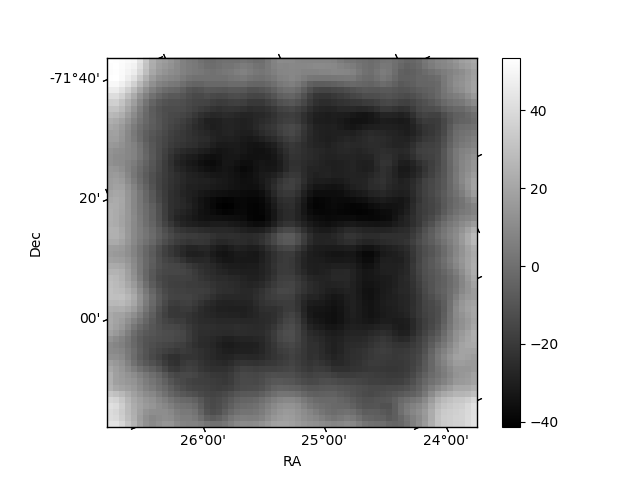
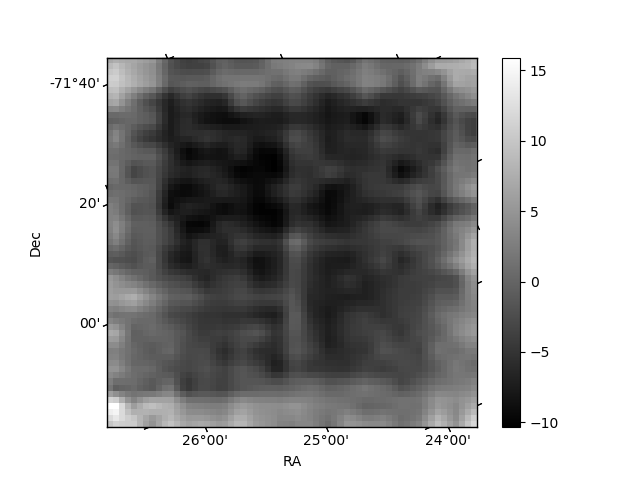
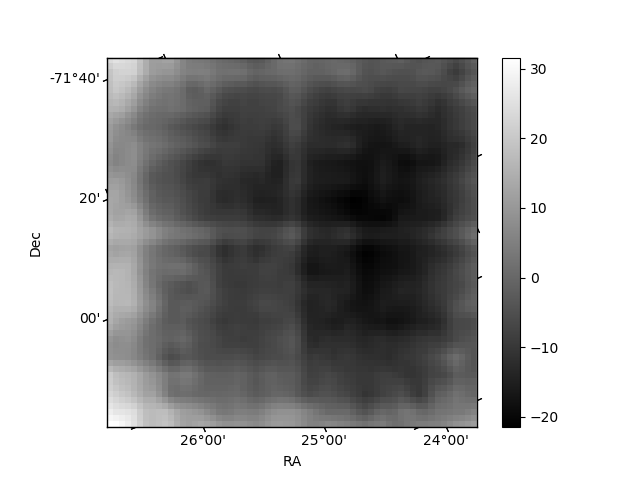
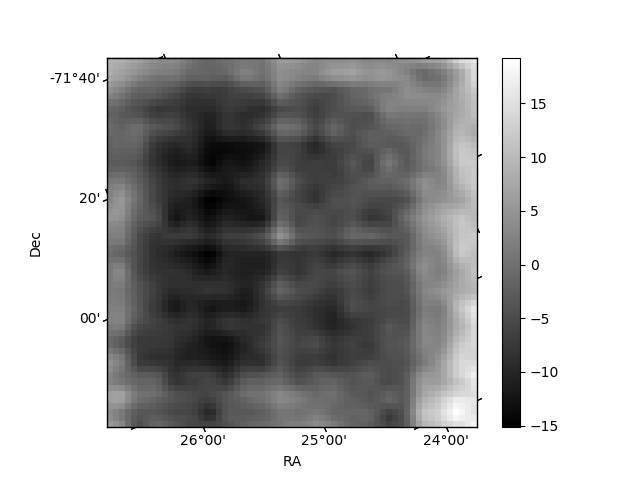
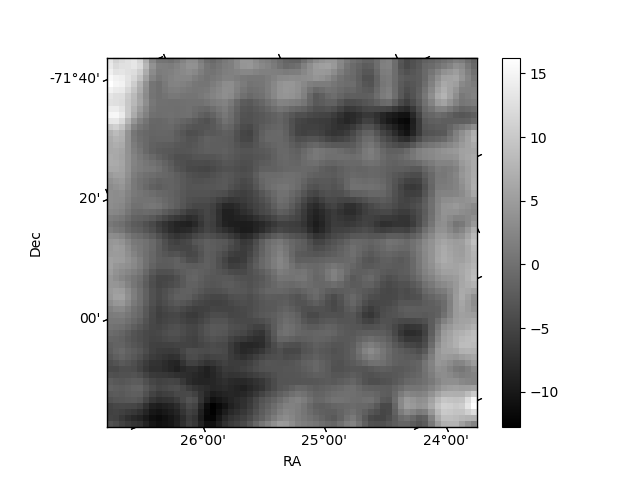
Histogram calculated using DETX and DETY for each event in the final _common_clean file
| Quadrant A | 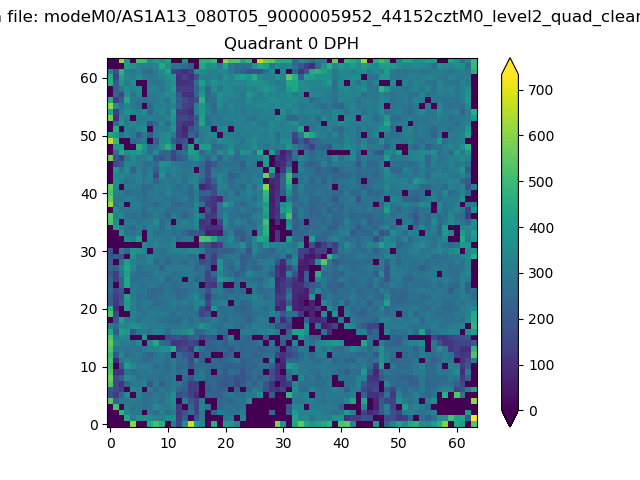 |
 |
Quadrant B |
|---|---|---|---|
| Quadrant D | 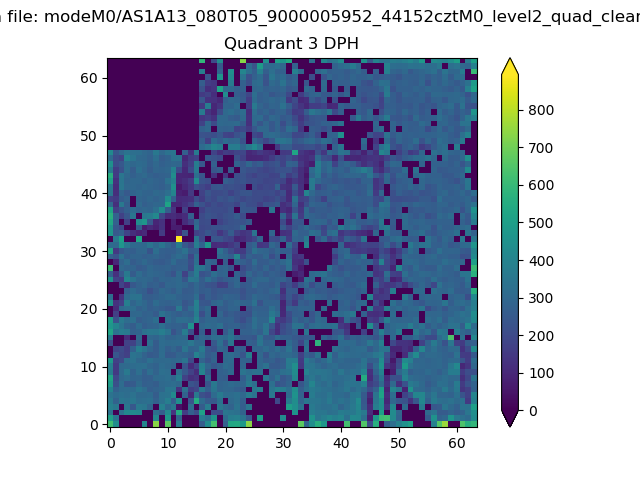 |
 |
Quadrant C |
| Plot type | Count rate plots | Images |
|---|---|---|
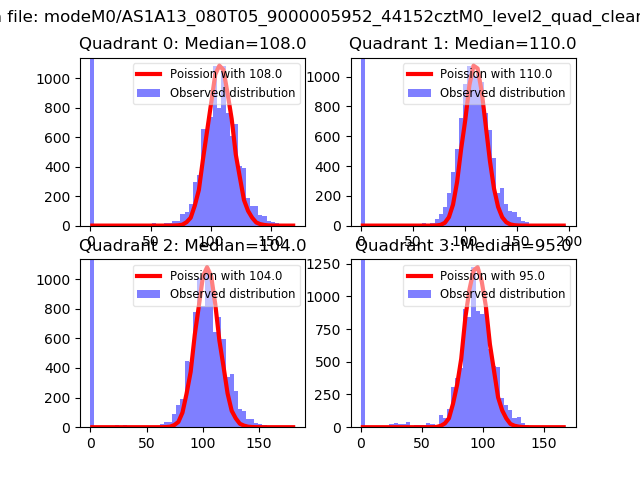
| Comparison with Poisson distribution Blue bars denote a histogram of data divided into 1 sec bins. Red curve is a Poisson curve with rate = median count rate of data. |
 |
 |
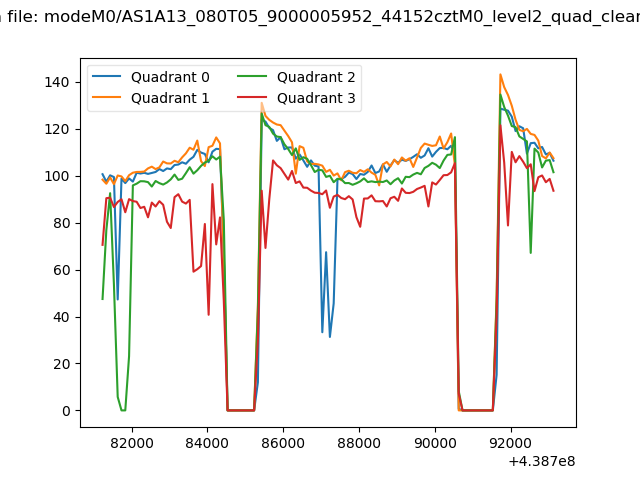
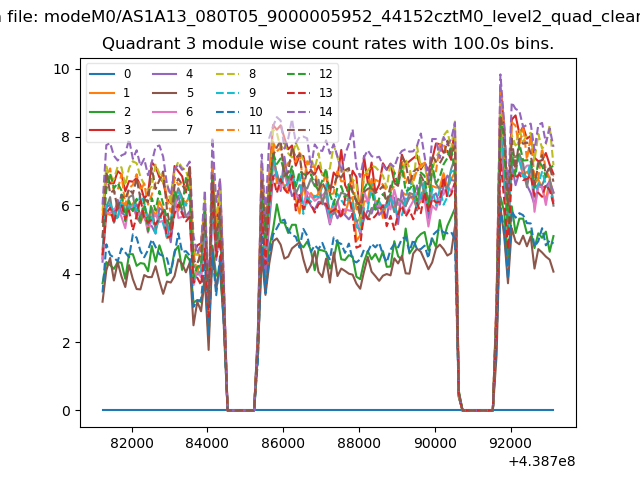
| Quadrant-wise count rates Data is divided into 100 sec bins |
 |
|
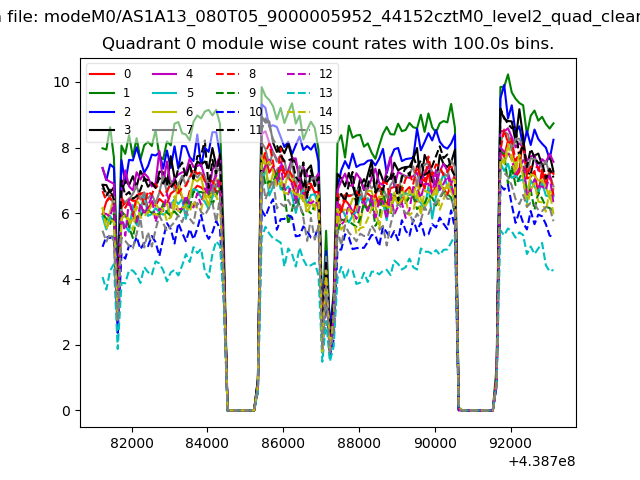
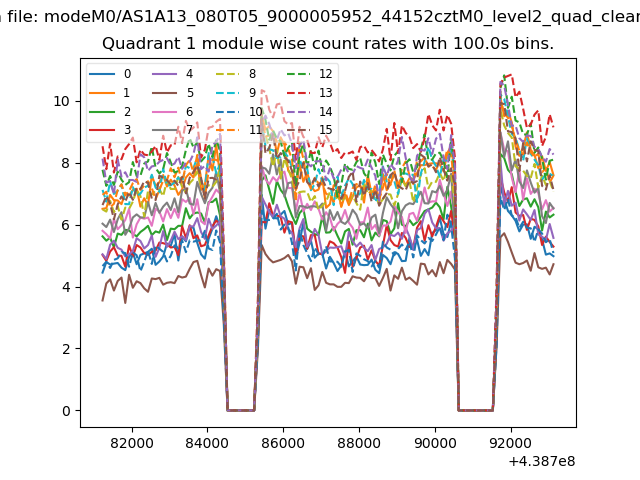
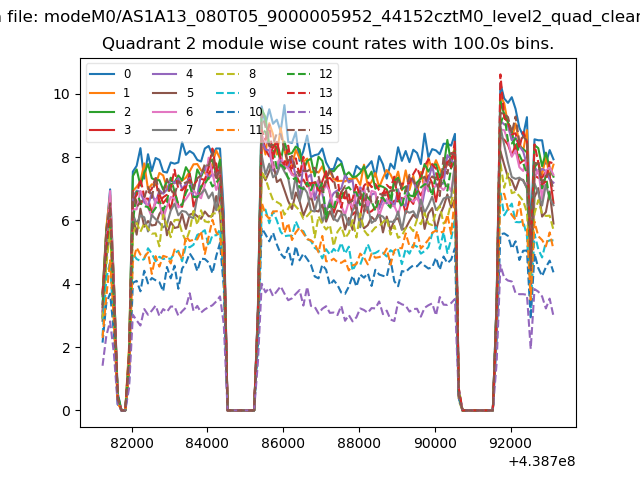
| Module-wise count rates for Quadrant A Data is divided into 100 sec bins |
 |
 |
| Module-wise count rates for Quadrant B Data is divided into 100 sec bins |
 |
 |
| Module-wise count rates for Quadrant C Data is divided into 100 sec bins |
 |
 |
| Module-wise count rates for Quadrant D Data is divided into 100 sec bins |
 |
 |
| Parameter | Plot |
|---|---|
| CZT HV Monitor | 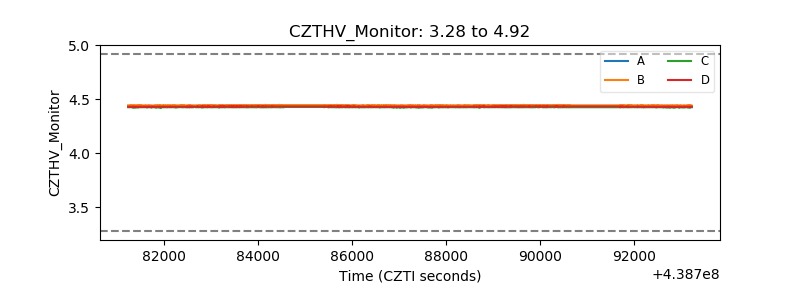 |
| D_VDD | 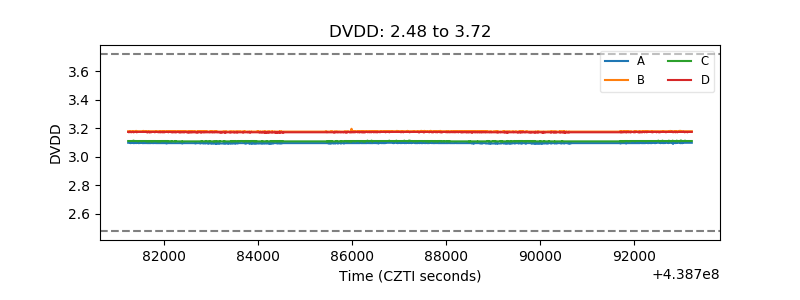 |
| Temperature 1 | 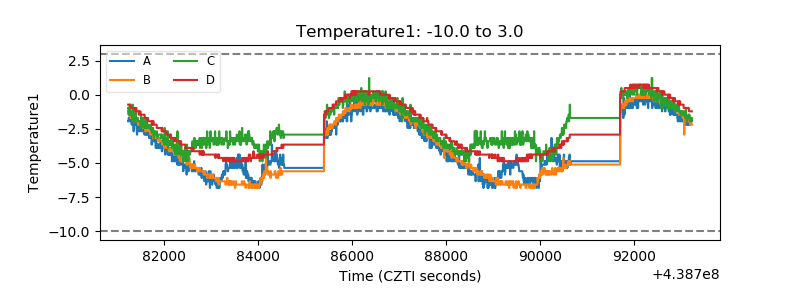 |
| Veto HV Monitor | 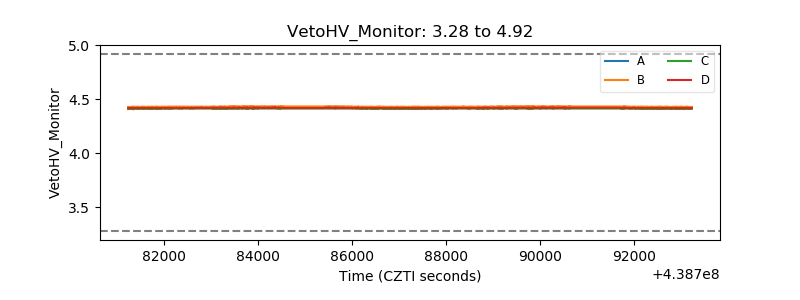 |
| Veto LLD | 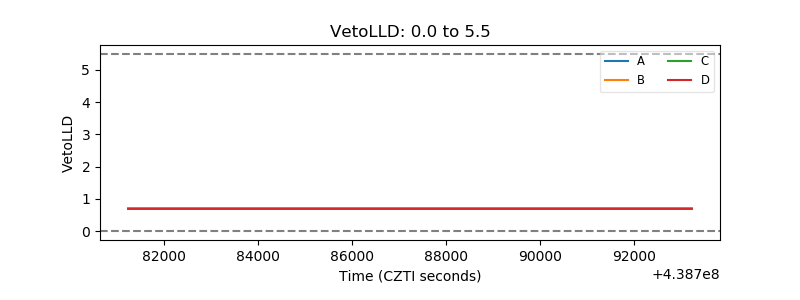 |
| Alpha Counter | 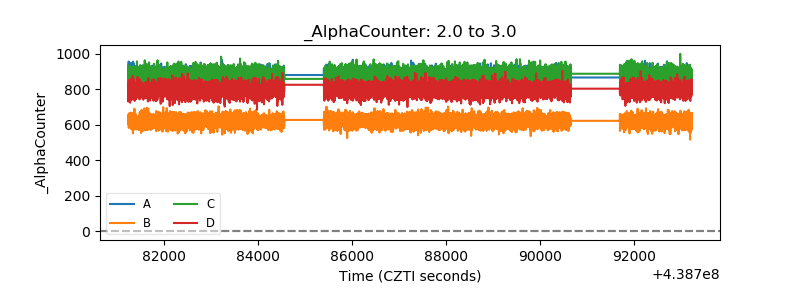 |
| _CPM_Rate | 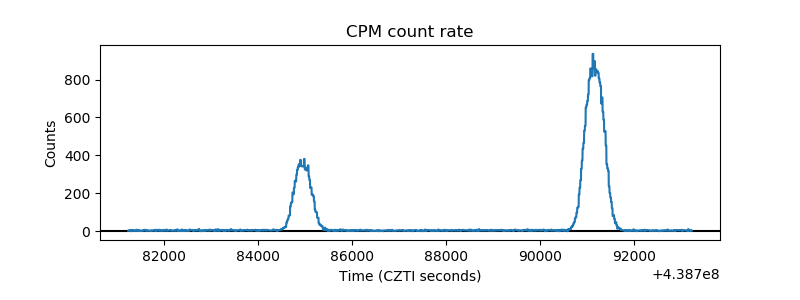 |
| CZT Counter | 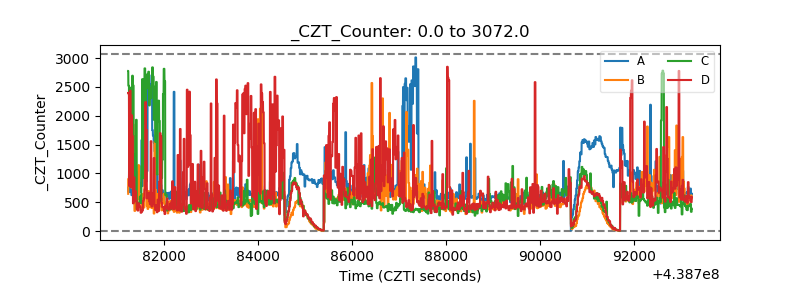 |
| +2.5 Volts monitor | 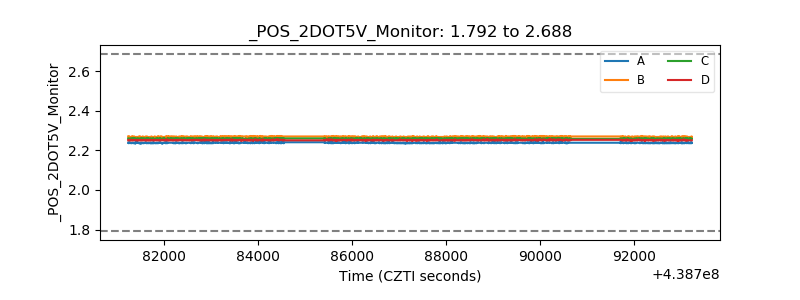 |
| +5 Volts monitor | 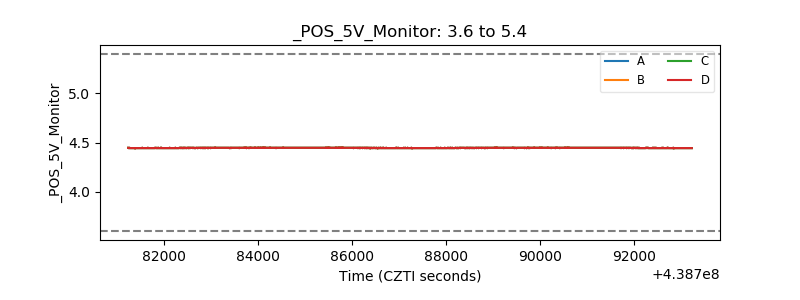 |
| _ROLL_ROT | 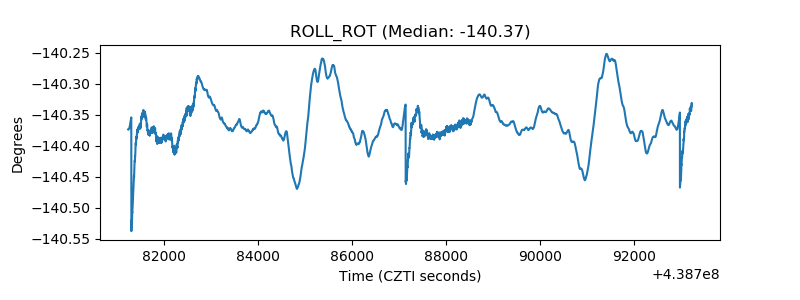 |
| _Roll_DEC |  |
| _Roll_RA | 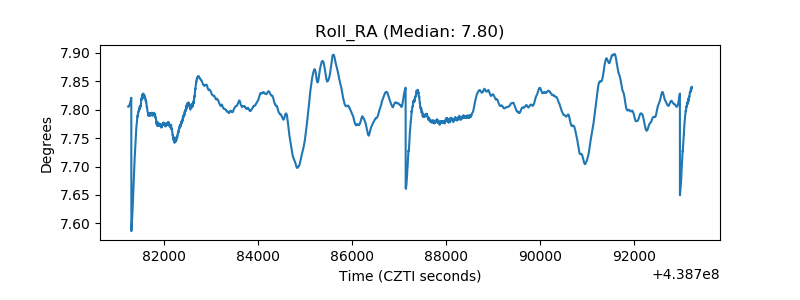 |
| Veto Counter | 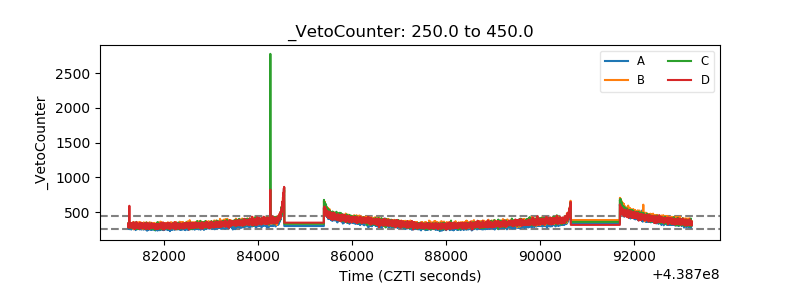 |